
This article is based on publicly available IR materials and is not a recommendation to buy or sell any specific securities.
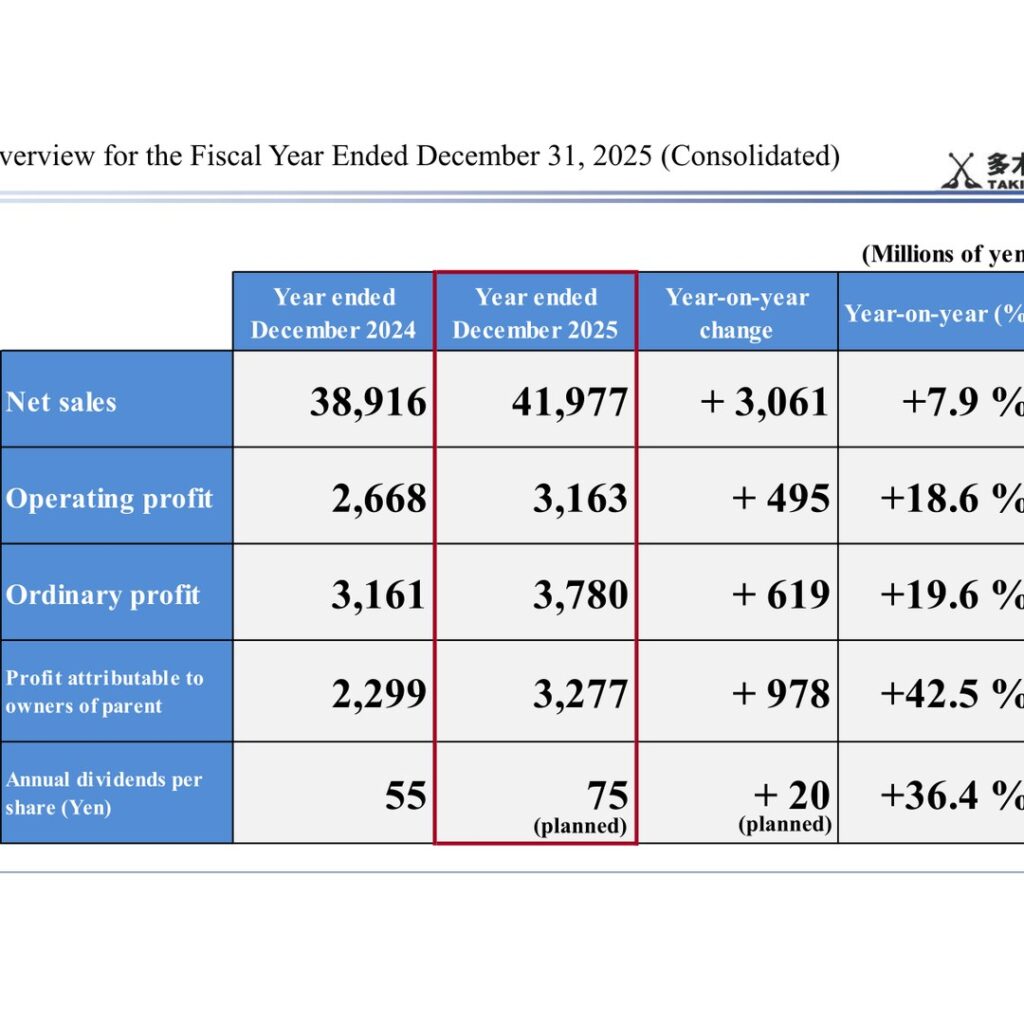
Taki Chemical Co., Ltd. reported results for the fiscal year ended December 31, 2025 (FY2025) with net sales of 41,977 million yen (+7.9% year on year), operating profit of 3,163 million yen (+18.6%), ordinary profit of 3,780 million yen (+19.6%) and profit attributable to owners of parent of 3,277 million yen (+42.5%). The company states that businesses in each segment performed steadily, in addition to increased sales volumes of fertilizer and water treatment chemicals as well as higher sales prices resulting from rising raw material costs. The planned annual dividend is 75 yen per share, up 20 yen, including a special dividend of 10 yen. For the fiscal year ending December 31, 2026, the company forecasts higher net sales of 43,000 million yen but lower operating profit of 2,450 million yen.
Consolidated Results (Full-Year Actual)
All four profit and sales lines increased year on year. ROE rose to 8.1% from 6.4%, the ratio of ordinary profit to total assets (ROA) rose to 6.1% from 5.8%, and the ratio of operating profit to net sales rose to 7.5% from 6.9%. EBITDA, which the company calculates as operating profit plus depreciation (including goodwill), was 4,533 million yen (+620 million yen), with depreciation of 1,369 million yen. The increase in property, plant and equipment and intangible assets was 1,593 million yen, down 285 million yen year on year.
| Item (millions of yen) | Year ended December 2024 | Year ended December 2025 | Year-on-year change | Year-on-year (%) |
|---|---|---|---|---|
| Net sales | 38,916 | 41,977 | +3,061 | +7.9% |
| Operating profit | 2,668 | 3,163 | +495 | +18.6% |
| Ordinary profit | 3,161 | 3,780 | +619 | +19.6% |
| Profit attributable to owners of parent | 2,299 | 3,277 | +978 | +42.5% |
| Annual dividends per share (yen) | 55 | 75 (planned) | +20 (planned) | +36.4% |
| Return on equity (ROE) (%) | 6.4 | 8.1 | ― | ― |
| Ratio of operating profit to net sales (%) | 6.9 | 7.5 | ― | ― |
| EBITDA | 3,912 | 4,533 | +620 | ― |
On the balance sheet, total assets were 65,653 million yen (+7,250 million yen from 58,402 million yen), total liabilities were 22,324 million yen (+1,881 million yen) and total net assets were 43,328 million yen (+5,368 million yen). The equity-to-asset ratio was 65.3% (64.9% a year earlier), and net assets per share were 5,143.16 yen (4,468.46 yen). Cash flows from operating activities were 2,310 million yen (4,343 million yen in the prior year), cash flows from investing activities were (1,056) million yen, cash flows from financing activities were (1,455) million yen, and cash and cash equivalents at end of period were 7,256 million yen.
Segment Results
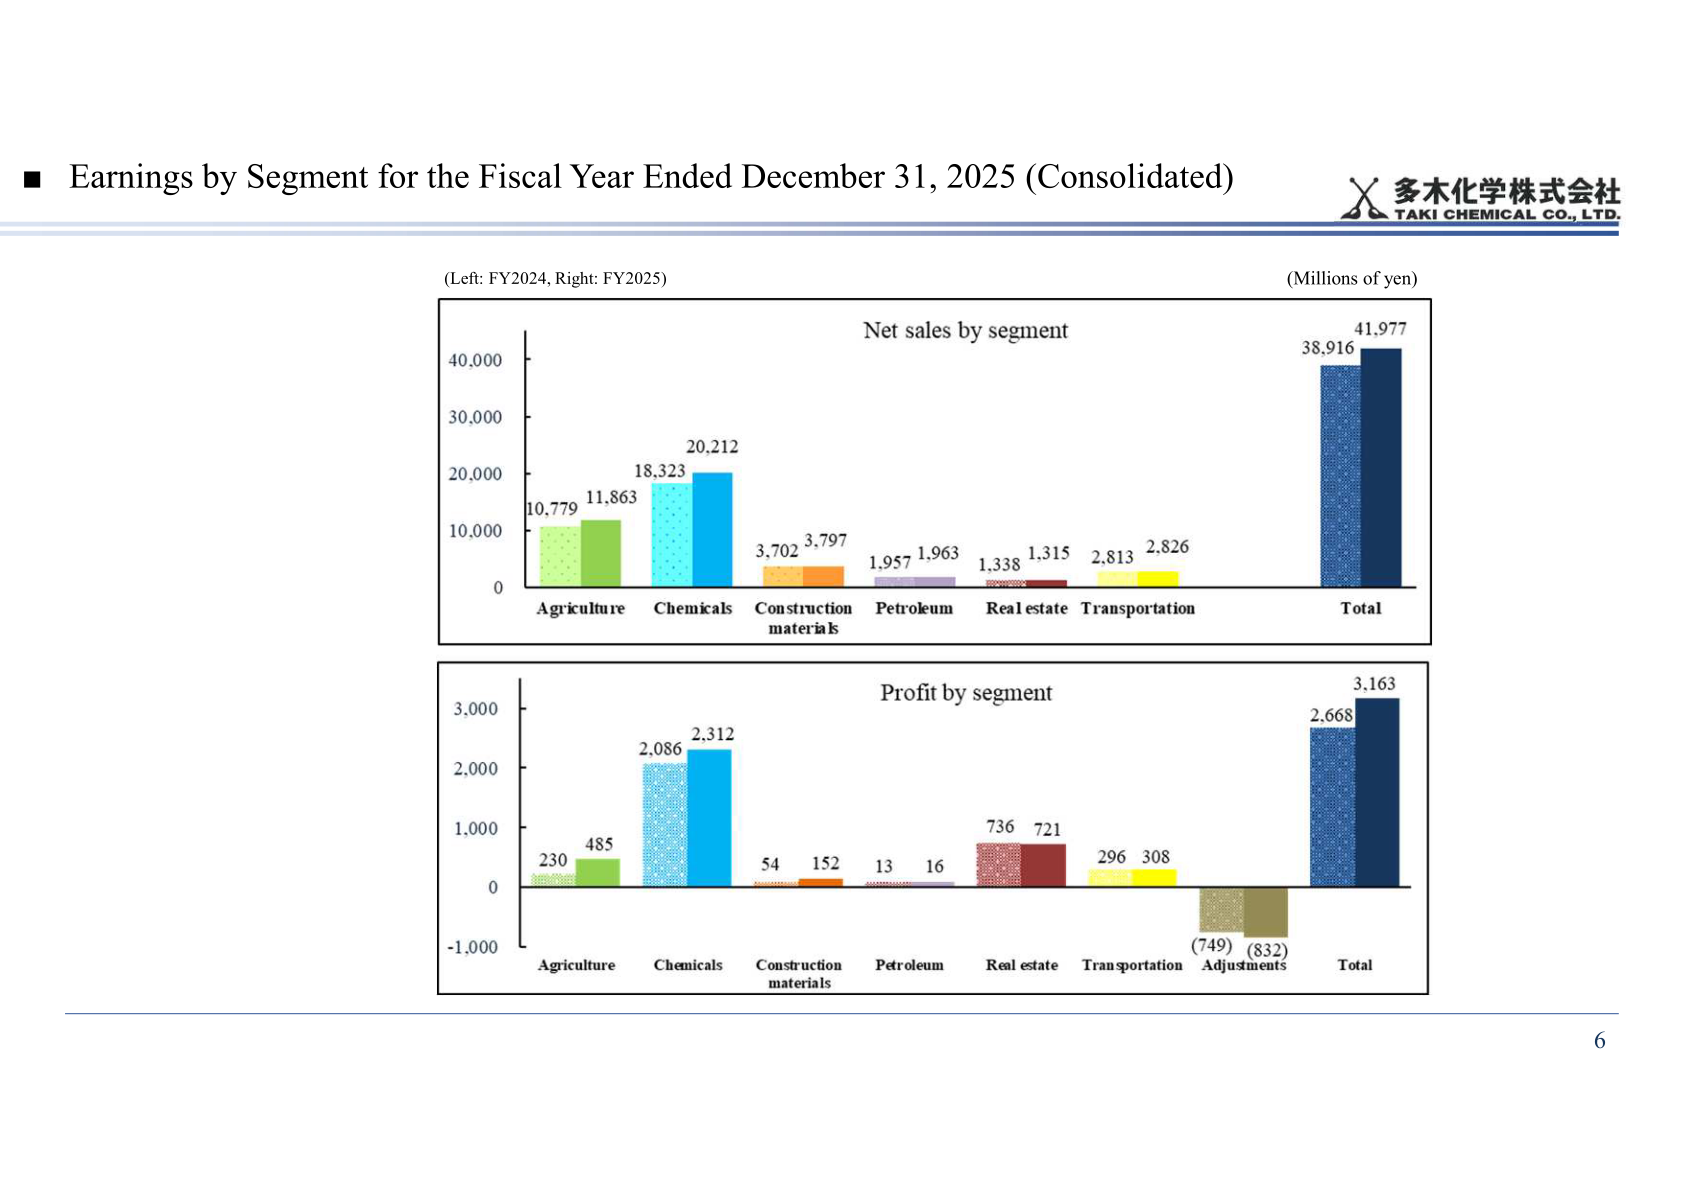
Agriculture: Net sales increased significantly by 10.1% to 11,863 million yen due to an increase in sales volumes of fertilizer and higher sales prices resulting from rising raw material costs. Segment profit increased significantly by 110.9% to 485 million yen, mainly due to streamlining of production methods.
Chemicals: Net sales increased significantly by 10.3% to 20,212 million yen and segment profit rose substantially by 10.8% to 2,312 million yen. Net sales of water treatment chemicals increased significantly by 11.8% to 13,417 million yen due to an increase in sales volumes of ultra-high-basicity polyaluminum chloride and efforts to revise sales prices to reflect rising raw material prices. Net sales of functional materials increased by 7.3% to 6,619 million yen (6,168 million yen in the prior year), driven by strong sales volumes of aluminum chloride with high basicity for automotive ceramic fibers and other products, despite a decrease in sales volumes of high-purity tantalum oxide for smartphones due to intensified competition. Net sales of other chemical products increased by 11.4% to 175 million yen (157 million yen).
Real Estate: Net sales decreased by 1.8% to 1,315 million yen, mainly due to a decrease in rental properties, although rental income from shopping centers remained at the same level as the previous fiscal year; segment profit decreased by 2.0% to 721 million yen. Construction Materials: Net sales increased by 2.5% to 3,797 million yen due to higher sales prices of gypsum board despite lower sales volumes, and segment profit increased significantly by 178.7% to 152 million yen. Petroleum: Net sales increased by 0.3% to 1,963 million yen on rising sales prices of fuel oil despite lower volumes, and segment profit increased by 28.1% to 16 million yen, mainly due to reduced selling, general and administrative expenses. Transportation: Net sales increased by 0.5% to 2,826 million yen on higher transported cargo and handling volumes despite a decline in merchandise sales, and segment profit increased by 3.9% to 308 million yen.
| Segment (millions of yen) | Net sales FY2024 | Net sales FY2025 | Segment profit FY2024 | Segment profit FY2025 |
|---|---|---|---|---|
| Agriculture | 10,779 | 11,863 | 230 | 485 |
| Chemicals | 18,323 | 20,212 | 2,086 | 2,312 |
| Construction materials | 3,702 | 3,797 | 54 | 152 |
| Petroleum | 1,957 | 1,963 | 13 | 16 |
| Real estate | 1,338 | 1,315 | 736 | 721 |
| Transportation | 2,813 | 2,826 | 296 | 308 |
| Adjustments | ― | ― | (749) | (832) |
| Total | 38,916 | 41,977 | 2,668 | 3,163 |
FY2026 Forecast
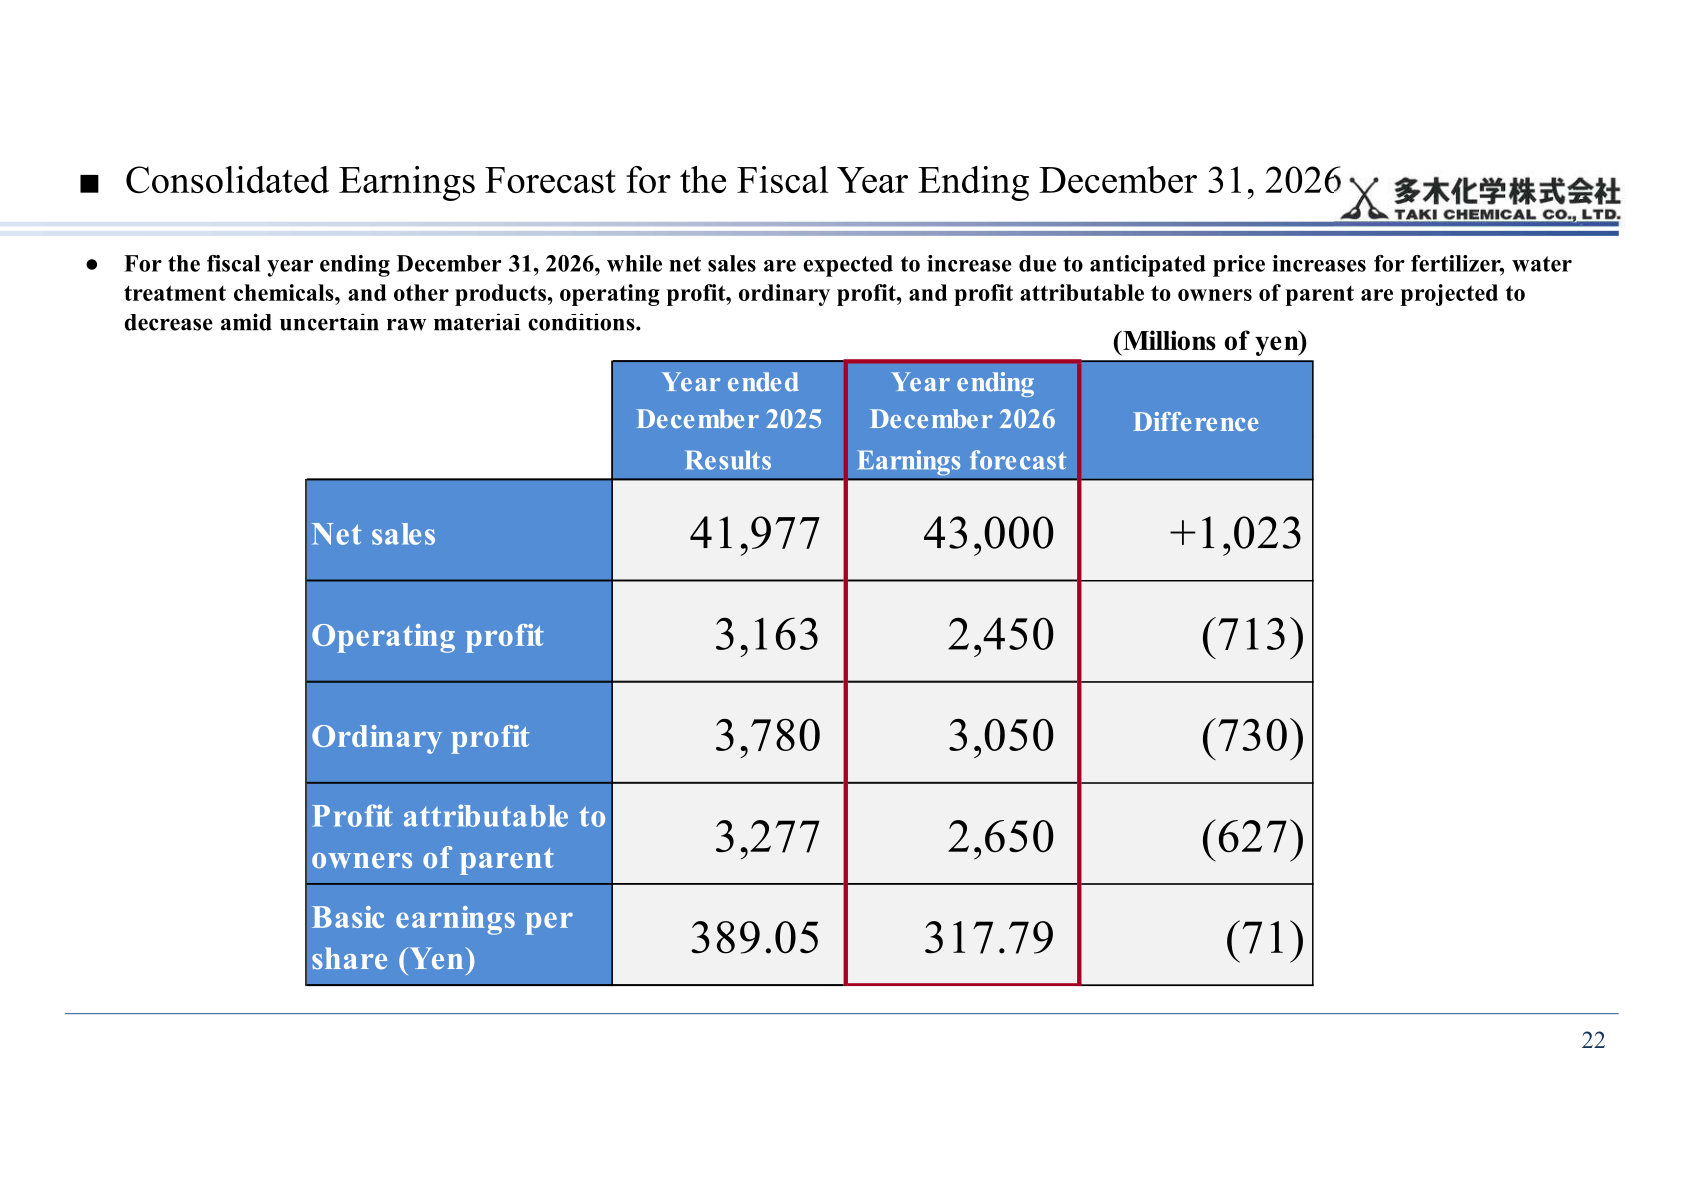
For the fiscal year ending December 31, 2026, the company expects net sales to increase due to anticipated price increases for fertilizer, water treatment chemicals and other products, while operating profit, ordinary profit and profit attributable to owners of parent are projected to decrease amid uncertain raw material conditions.
| Item (millions of yen) | Year ended December 2025 (Results) | Year ending December 2026 (Forecast) | Difference |
|---|---|---|---|
| Net sales | 41,977 | 43,000 | +1,023 |
| Operating profit | 3,163 | 2,450 | (713) |
| Ordinary profit | 3,780 | 3,050 | (730) |
| Profit attributable to owners of parent | 3,277 | 2,650 | (627) |
| Basic earnings per share (yen) | 389.05 | 317.79 | (71) |
Shareholder Returns
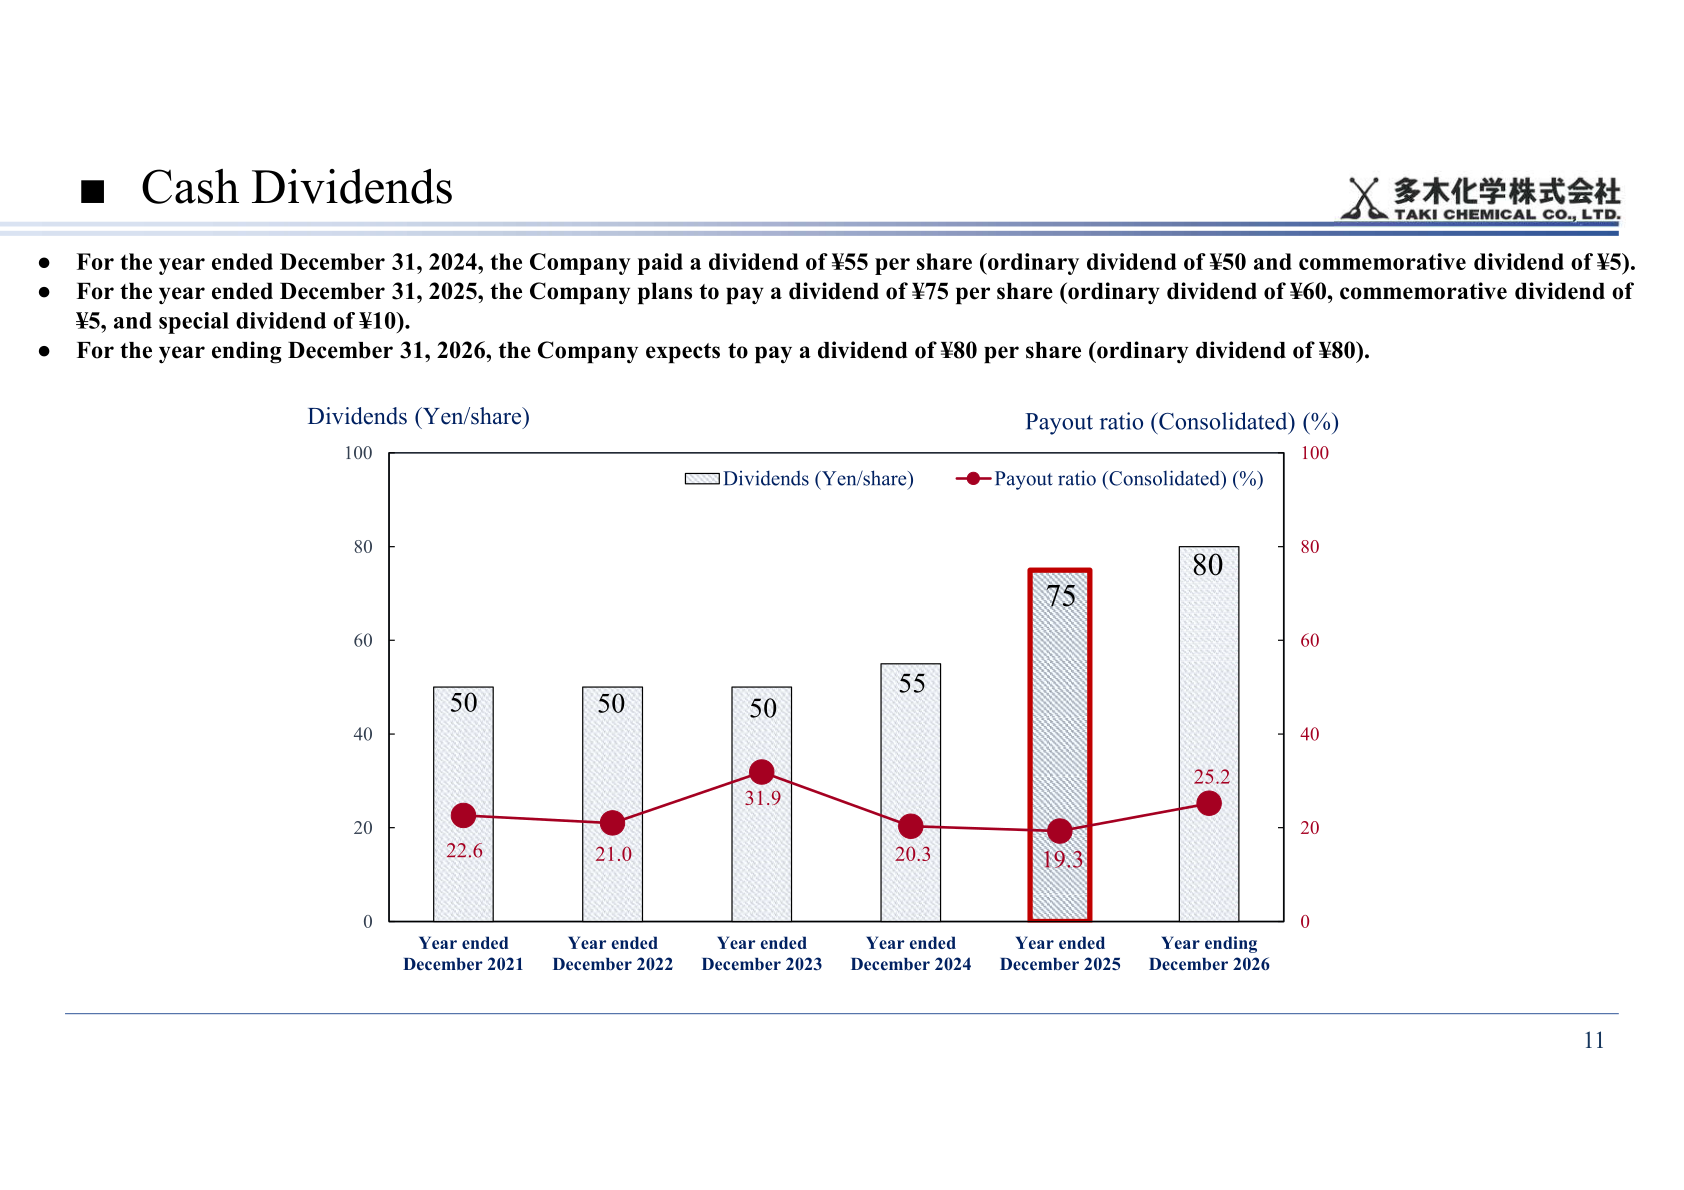
For the year ended December 31, 2025, the company plans to pay a dividend of 75 yen per share, consisting of an ordinary dividend of 60 yen, a commemorative dividend of 5 yen and a special dividend of 10 yen. This compares with 55 yen per share for the prior year (ordinary dividend of 50 yen and commemorative dividend of 5 yen). For the year ending December 31, 2026, the company expects to pay a dividend of 80 yen per share, all as an ordinary dividend.
| Fiscal year | Dividend per share (yen) | Breakdown | Payout ratio (consolidated) |
|---|---|---|---|
| Year ended December 2024 | 55 | Ordinary 50 + commemorative 5 | 20.3% |
| Year ended December 2025 | 75 (planned) | Ordinary 60 + commemorative 5 + special 10 | 19.3% |
| Year ending December 2026 | 80 (forecast) | Ordinary 80 | 25.2% |
Medium-term Management Plan 2028
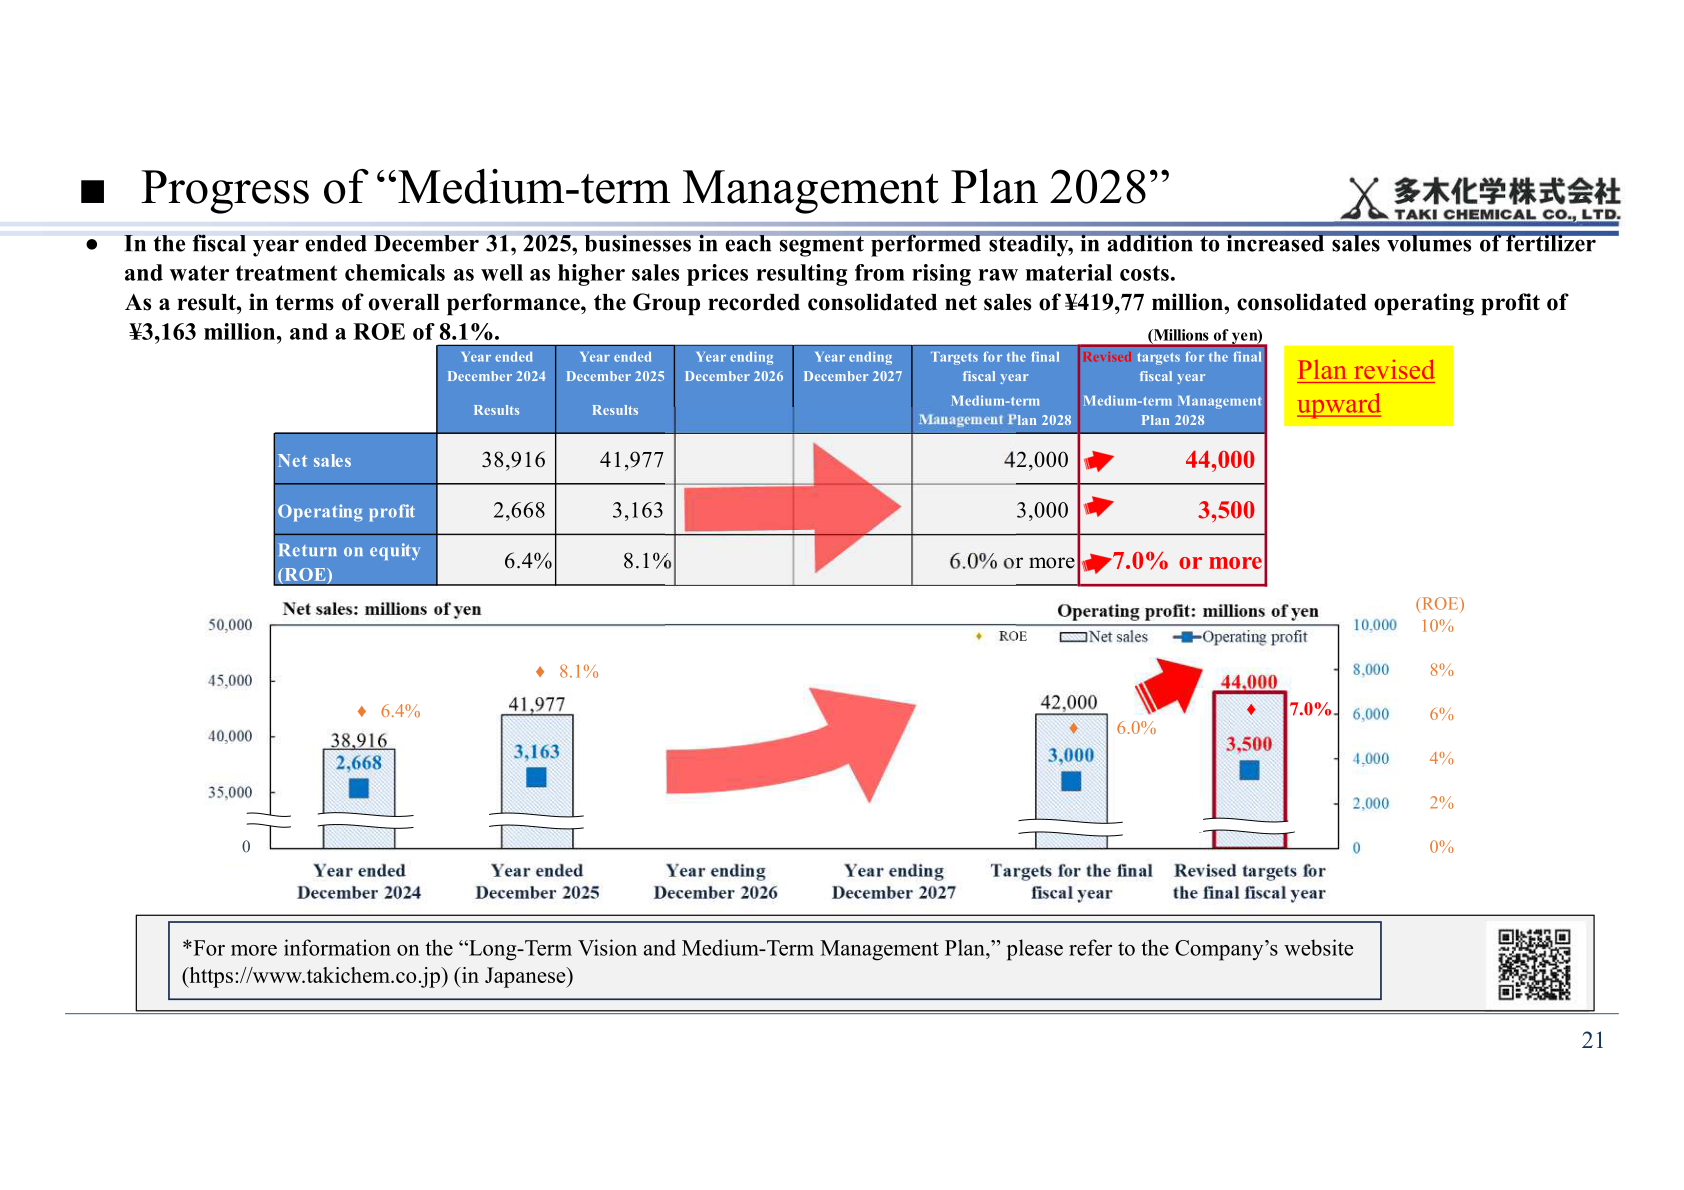
Under the Medium-term Management Plan 2028, the company has revised upward its targets for the final fiscal year of the plan: net sales to 44,000 million yen from 42,000 million yen, operating profit to 3,500 million yen from 3,000 million yen, and ROE to 7.0% or more from 6.0% or more. FY2025 results were net sales of 41,977 million yen, operating profit of 3,163 million yen and ROE of 8.1%.
This article is an analysis based on publicly available information and is not a recommendation to buy or sell any specific securities. Investment decisions are your own responsibility.
















