
This article is based on publicly available IR materials and is not a recommendation to buy or sell any specific securities.
Note: Nippon Paper Industries’ fiscal year ends in March. Following this site’s convention, the fiscal year ended March 31, 2026 is classified as FY2025; the body text and tables below keep the company’s own labels (FY2026/3 = fiscal year ended March 2026; FY2027/3 = fiscal year ending March 2027).
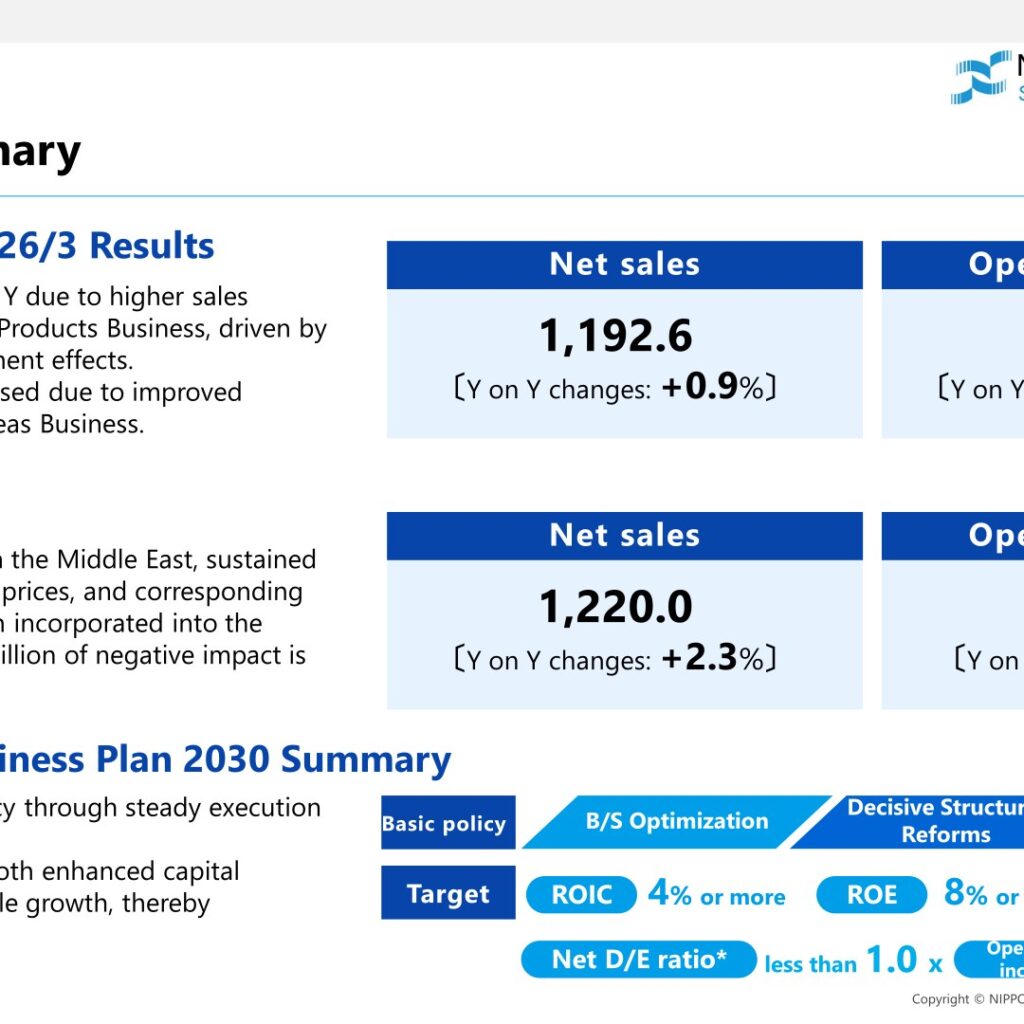
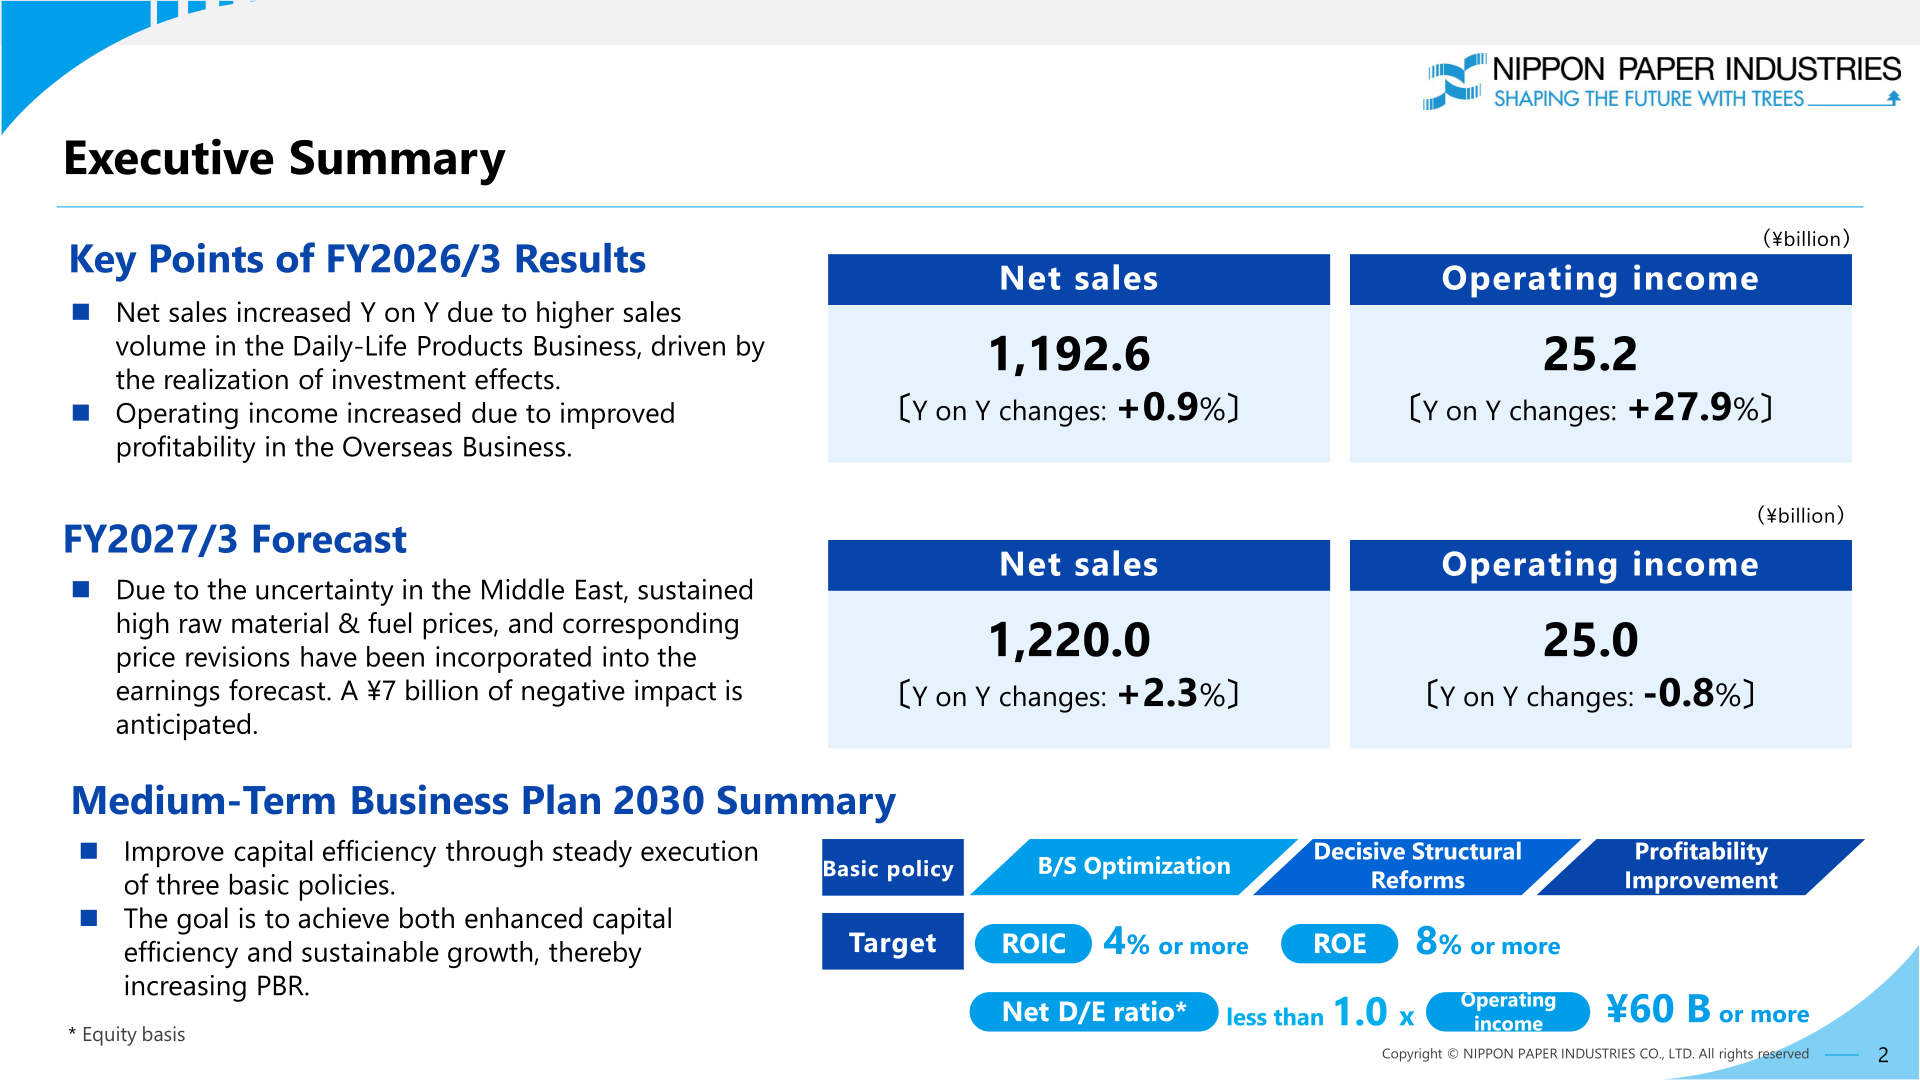
Nippon Paper Industries Co., Ltd. (3863) reported FY2026/3 net sales of ¥1,192.6 billion (+0.9% YoY) and operating income of ¥25.2 billion (+27.9%). Net sales rose on higher sales volume in the Daily-Life Products Business, driven by the realization of investment effects, and operating income increased on improved profitability in the Overseas Business. Profit attributable to owners of parent was ¥11.7 billion (+158.7%). For FY2027/3, the company forecasts net sales of ¥1,220.0 billion (+2.3%) and operating income of ¥25.0 billion (-0.8%), factoring in a ¥7 billion negative impact from the uncertainty in the Middle East and sustained high raw material and fuel prices.
Consolidated Results (FY2026/3 Actual)
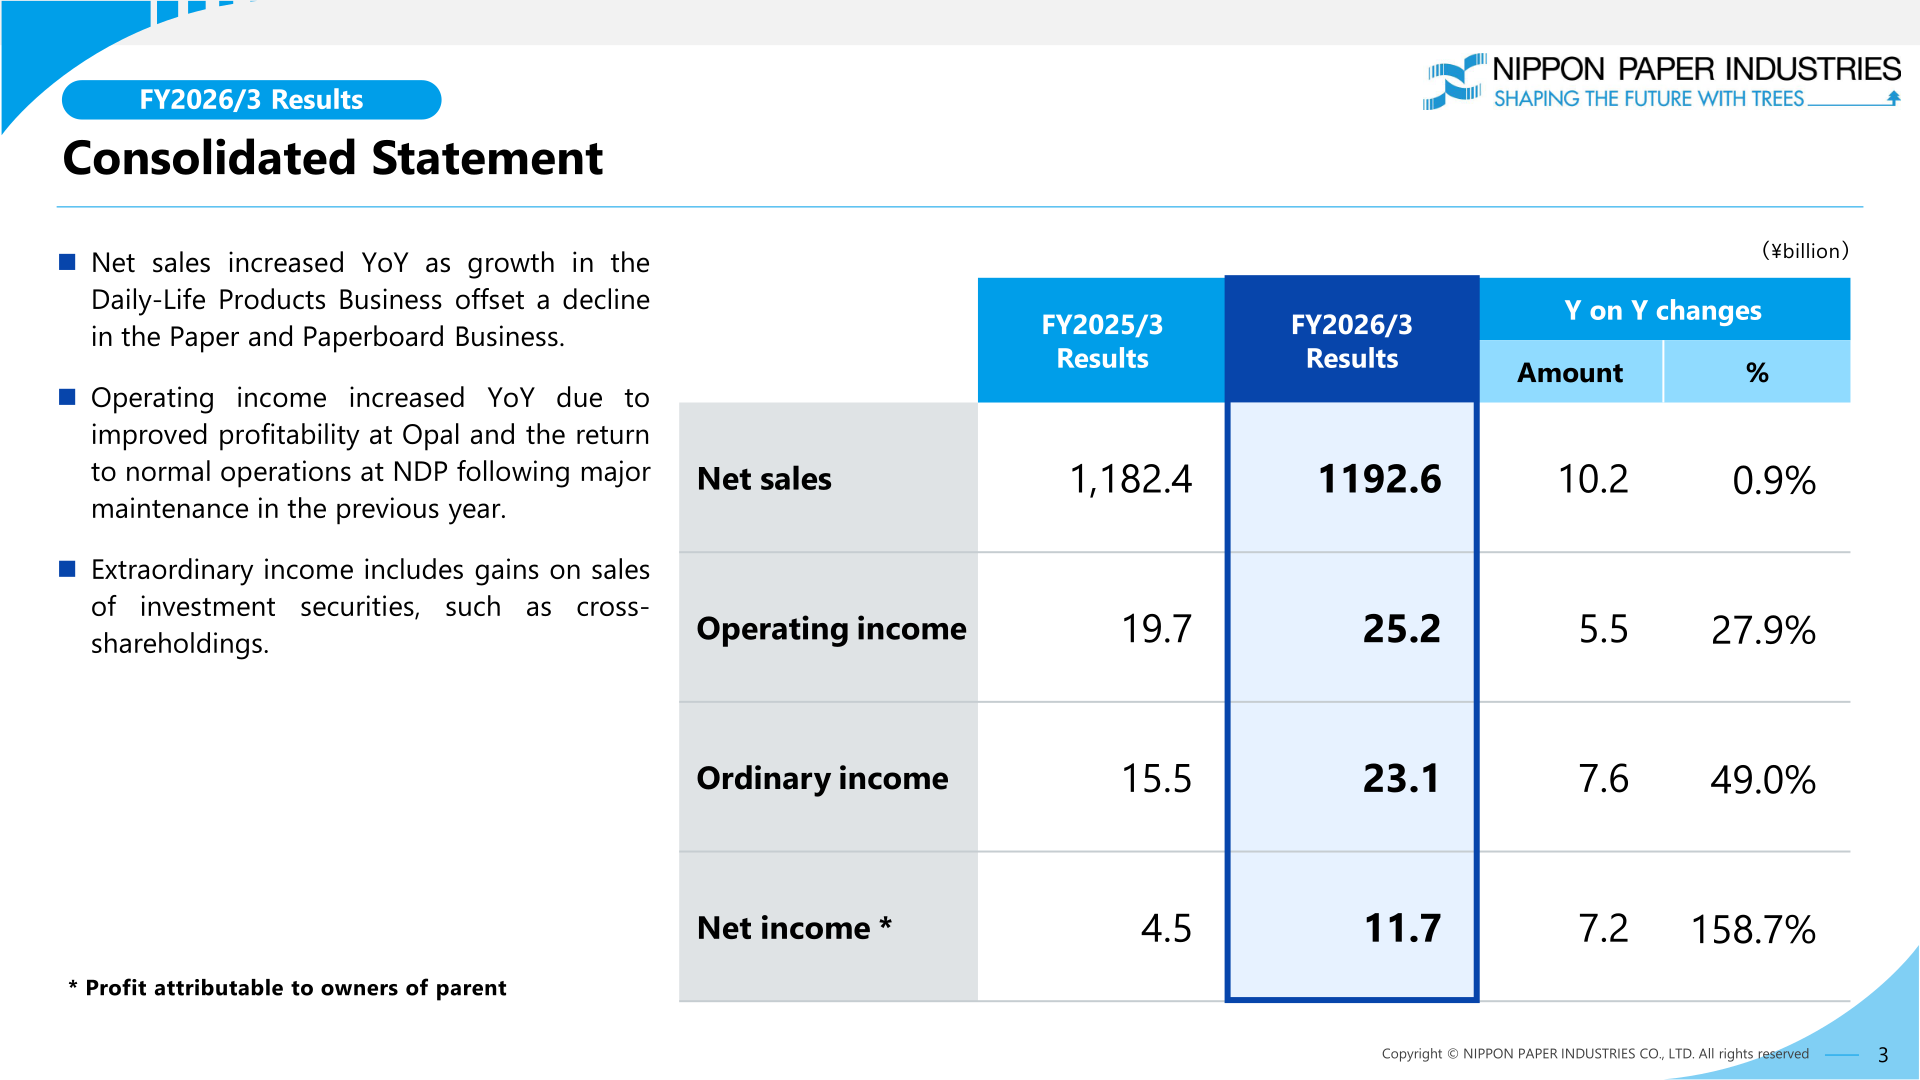
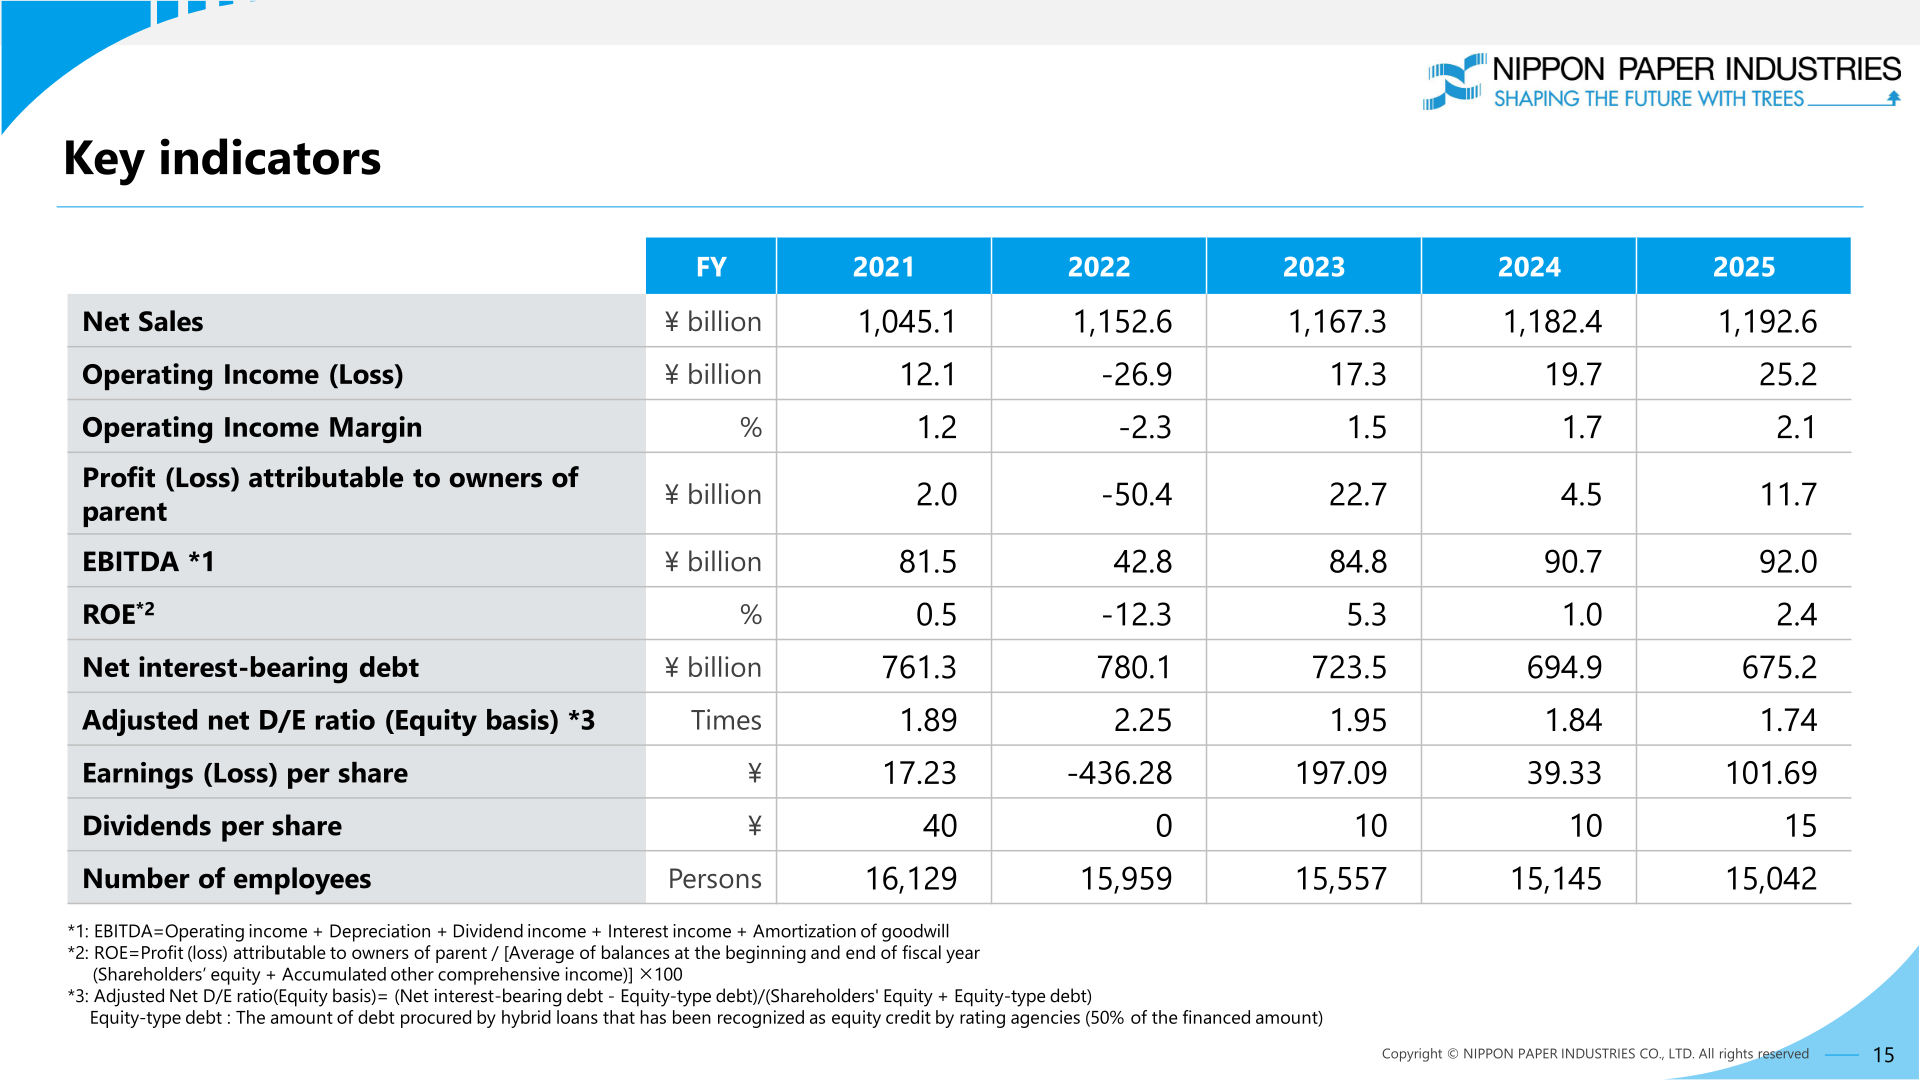
Net sales increased year on year as growth in the Daily-Life Products Business offset a decline in the Paper and Paperboard Business. Operating income increased due to improved profitability at Opal and the return to normal operations at NDP following major maintenance in the previous year. Extraordinary income includes gains on sales of investment securities, such as cross-shareholdings. EBITDA was ¥92.0 billion (¥90.7 billion in FY2025/3), the operating income margin was 2.1% (1.7%), ROE was 2.4% (1.0%), and earnings per share were ¥101.69 (¥39.33).
| Item (¥billion) | FY2025/3 Results | FY2026/3 Results | YoY change (amount) | YoY change (%) |
|---|---|---|---|---|
| Net sales | 1,182.4 | 1,192.6 | 10.2 | 0.9% |
| Operating income | 19.7 | 25.2 | 5.5 | 27.9% |
| Ordinary income | 15.5 | 23.1 | 7.6 | 49.0% |
| Profit attributable to owners of parent | 4.5 | 11.7 | 7.2 | 158.7% |
In the breakdown of the ¥5.5 billion increase in operating income, the Paper and Paperboard Business contributed -7.7 (domestic business -7.0, overseas business -0.7) and the Daily-Life Products Business contributed 13.3 (domestic business 4.2, overseas business 9.1), while other businesses contributed -0.1 (Energy -0.3, Wood Products and Construction Related 0.4, Others -0.2) (¥billion). Within Paper and Paperboard, cost reductions, etc. were -4.1, including labor costs of -1.7 and logistics costs of -1.9; within Daily-Life Products, the overseas business improvement of 9.1 comprised Opal 4.6, NDP 4.5 and TSP 0.0.
On the balance sheet, total assets were ¥1,738.4 billion as of March 31, 2026 (¥1,703.3 billion a year earlier), as inventories and tangible and intangible fixed assets increased due to factors including foreign exchange effects. Net interest-bearing debt fell to ¥675.2 billion (¥694.9 billion) and the adjusted net D/E ratio (equity basis) improved to 1.74 times (1.84 times), achieving the Medium-Term Business Plan 2025 targets of net interest-bearing debt of ¥710.0 billion or less and a net D/E ratio in the 1.7x range. Cash flows from operating activities were ¥74.9 billion and free cash flows were ¥31.4 billion (¥39.3 billion in FY2025/3).
Segment Results
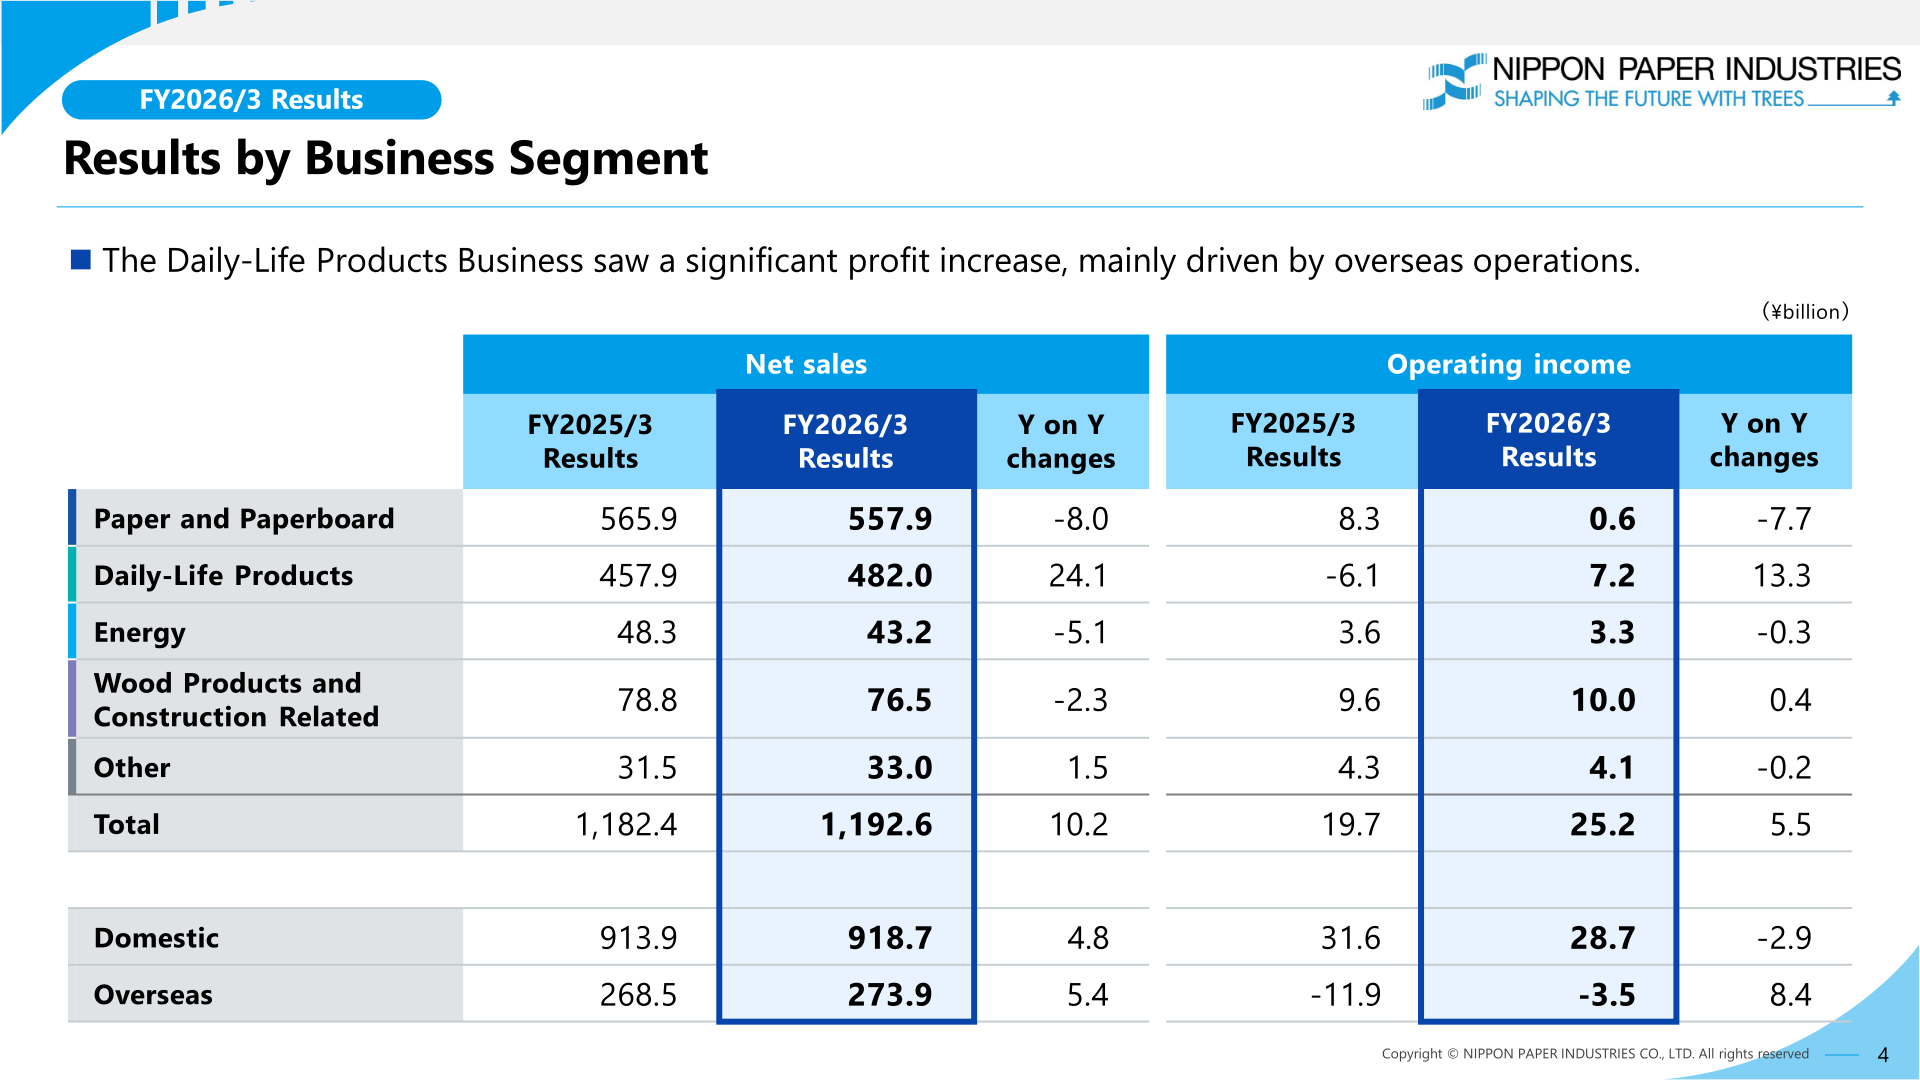
The Daily-Life Products Business saw a significant profit increase, mainly driven by overseas operations, with operating income turning from -6.1 to 7.2 (¥billion). Overseas operating income overall improved from -11.9 to -3.5, while domestic operating income declined from 31.6 to 28.7.
| Segment | Metric (¥billion) | FY2025/3 Results | FY2026/3 Results | YoY change |
|---|---|---|---|---|
| Paper and Paperboard | Net sales | 565.9 | 557.9 | -8.0 |
| Paper and Paperboard | Operating income | 8.3 | 0.6 | -7.7 |
| Daily-Life Products | Net sales | 457.9 | 482.0 | 24.1 |
| Daily-Life Products | Operating income | -6.1 | 7.2 | 13.3 |
| Energy | Net sales | 48.3 | 43.2 | -5.1 |
| Energy | Operating income | 3.6 | 3.3 | -0.3 |
| Wood Products and Construction Related | Net sales | 78.8 | 76.5 | -2.3 |
| Wood Products and Construction Related | Operating income | 9.6 | 10.0 | 0.4 |
| Other | Net sales | 31.5 | 33.0 | 1.5 |
| Other | Operating income | 4.3 | 4.1 | -0.2 |
| Total | Net sales | 1,182.4 | 1,192.6 | 10.2 |
| Total | Operating income | 19.7 | 25.2 | 5.5 |
| Domestic | Net sales | 913.9 | 918.7 | 4.8 |
| Domestic | Operating income | 31.6 | 28.7 | -2.9 |
| Overseas | Net sales | 268.5 | 273.9 | 5.4 |
| Overseas | Operating income | -11.9 | -3.5 | 8.4 |
Paper and Paperboard: Net sales decreased year on year due to weaker export market conditions for paper and sluggish domestic demand for paperboard. Profits decreased due to higher labor and logistics costs, despite stable coal and other fuel prices. Overseas, JTOy’s profits decreased due to continued weak demand for thermal paper in the European market.
Daily-Life Products: Domestic net sales were 238.5 (224.2) and operating income 13.5 (9.3), while overseas net sales were 243.5 (233.7) and operating income -6.3 (-15.4) (¥billion). In Japan, sales volume increased due to expanded investment benefits in household paper, and despite higher labor and logistics costs, performance remained solid due to price adjustments; the domestic operating income change of 4.2 comprised packaging processing 1.4, chemical 0.7 and household paper & healthcare 2.1. Overseas, Opal reduced losses due to cost improvements at the Maryvale Mill, including better unit costs and operational efficiency, and NDP improved significantly due to higher sales volume as the impact of major maintenance in the previous year was eliminated.
Energy: Sales and profits decreased year on year due to lower electricity sales prices. Wood Products and Construction Related: Profits increased due to higher domestic demand for biomass fuel.
FY2027/3 Forecast
For FY2027/3, Nippon Paper Industries forecasts net sales of ¥1,220.0 billion (+2.3%), operating income of ¥25.0 billion (-0.8%), ordinary income of ¥18.0 billion (-22.1%) and profit attributable to owners of parent of ¥10.0 billion (-14.8%). The price revisions implemented for various products in fiscal year 2025 will contribute fully throughout the year. The continuing uncertainty in the Middle East is assumed to impact earnings throughout the fiscal year; while further price revisions for various products are anticipated in response to sustained high raw material and fuel prices, a ¥7 billion decrease in profit is factored in. Major assumptions are FOREX of JPY 160/USD (sensitivity: +0.55 billion yen/year due to 1 yen appreciation against USD), coal at USD 130/t (Australian coal) and crude oil at USD 100/BL (Dubai). Capital expenditure (including construction in progress) is forecast at ¥91.0 billion (¥60.6 billion in FY2026/3) and depreciation at ¥66.0 billion (¥63.2 billion).
| Item (¥billion) | FY2026/3 Results | FY2027/3 Forecast | YoY change (amount) | YoY change (%) |
|---|---|---|---|---|
| Net sales | 1,192.6 | 1,220.0 | 27.4 | 2.3% |
| Operating income | 25.2 | 25.0 | -0.2 | -0.8% |
| Ordinary income | 23.1 | 18.0 | -5.1 | -22.1% |
| Profit attributable to owners of parent | 11.7 | 10.0 | -1.7 | -14.8% |
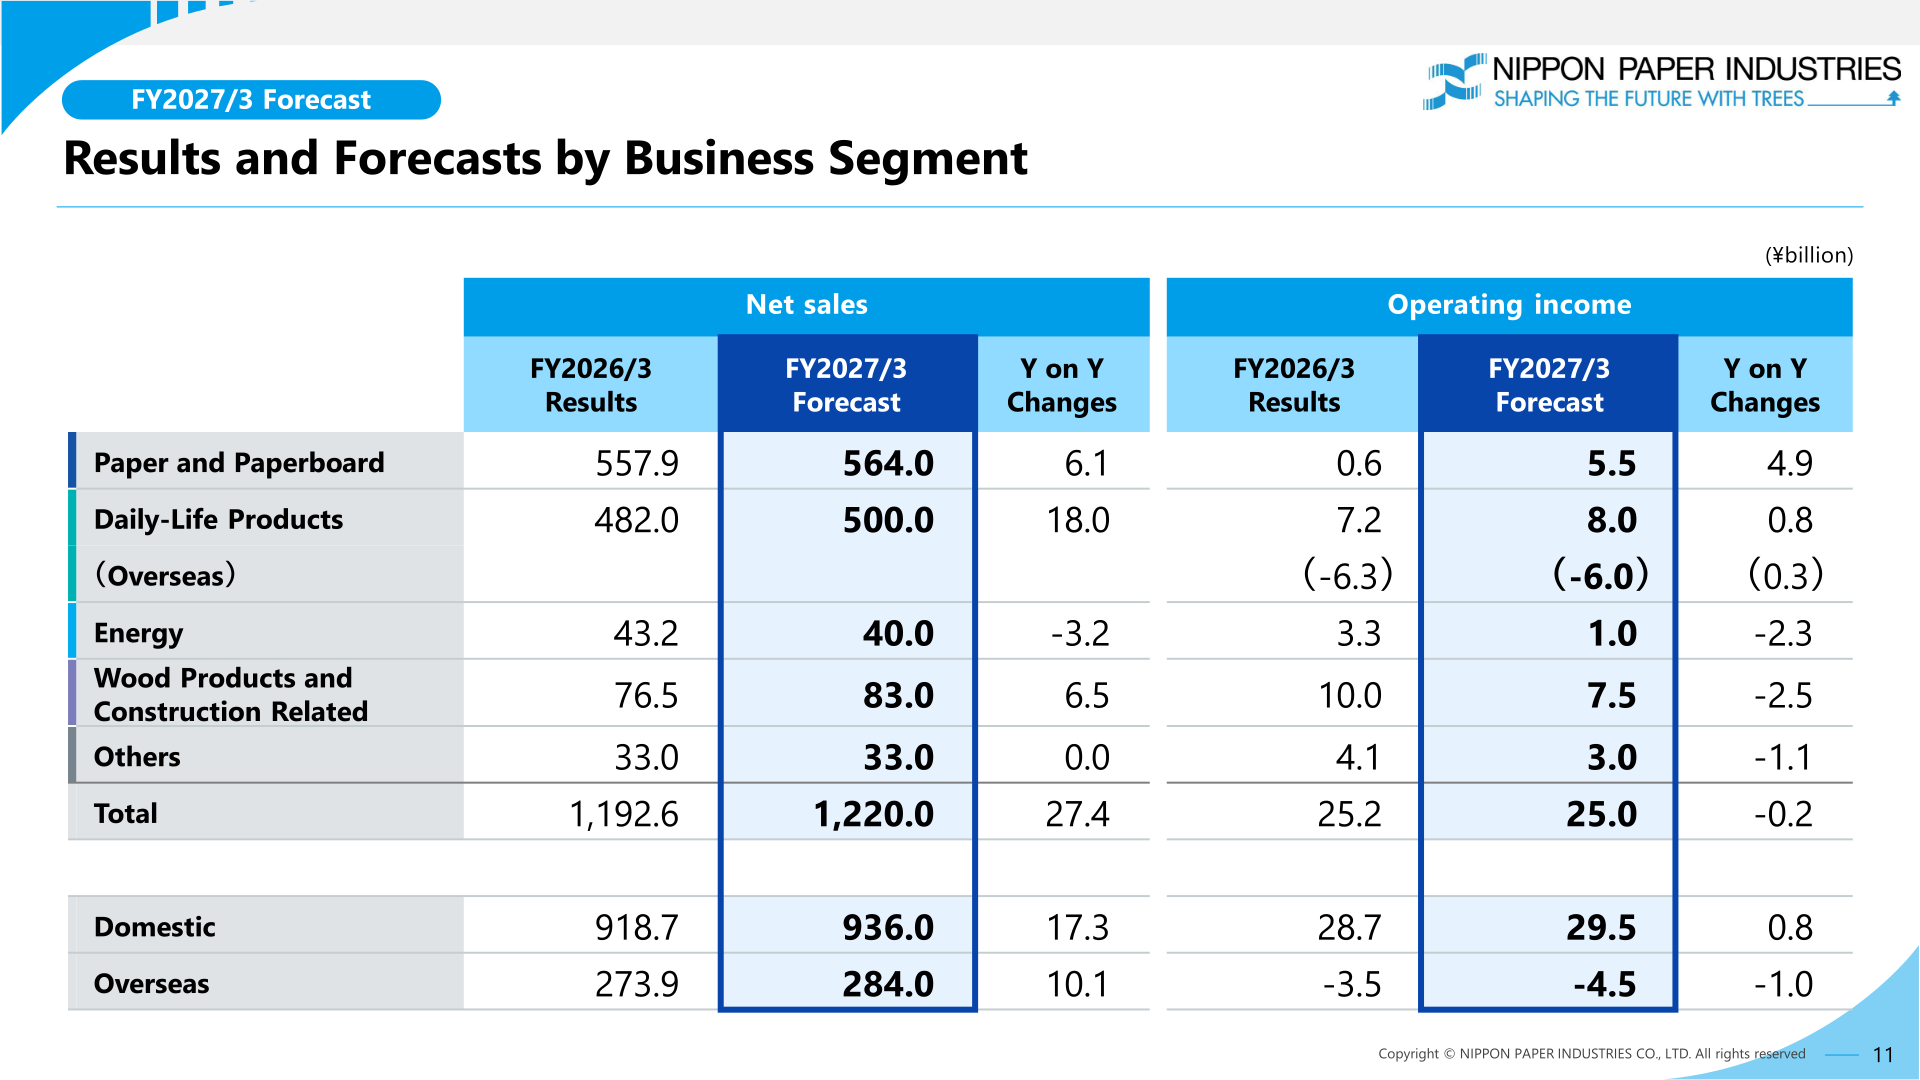
By segment, operating income is forecast at 5.5 for Paper and Paperboard (+4.9), 8.0 for Daily-Life Products (+0.8; overseas -6.0), 1.0 for Energy (-2.3), 7.5 for Wood Products and Construction Related (-2.5) and 3.0 for Others (-1.1) (¥billion). In the factors for changes, volume and sales price are expected to contribute 37.8 (Paper and Paperboard 25.8, Daily-Life Products 12.0) against raw material and fuel prices of -29.1 (Paper and Paperboard -21.0, Daily-Life Products -8.1), while other businesses contribute -5.9 (¥billion).
| Segment | Metric (¥billion) | FY2026/3 Results | FY2027/3 Forecast | YoY change |
|---|---|---|---|---|
| Paper and Paperboard | Net sales | 557.9 | 564.0 | 6.1 |
| Paper and Paperboard | Operating income | 0.6 | 5.5 | 4.9 |
| Daily-Life Products | Net sales | 482.0 | 500.0 | 18.0 |
| Daily-Life Products | Operating income | 7.2 | 8.0 | 0.8 |
| Energy | Net sales | 43.2 | 40.0 | -3.2 |
| Energy | Operating income | 3.3 | 1.0 | -2.3 |
| Wood Products and Construction Related | Net sales | 76.5 | 83.0 | 6.5 |
| Wood Products and Construction Related | Operating income | 10.0 | 7.5 | -2.5 |
| Others | Net sales | 33.0 | 33.0 | 0.0 |
| Others | Operating income | 4.1 | 3.0 | -1.1 |
| Total | Net sales | 1,192.6 | 1,220.0 | 27.4 |
| Total | Operating income | 25.2 | 25.0 | -0.2 |
Shareholder Returns
According to the key indicators in the reference materials, dividends per share were ¥15 for FY2026/3, up from ¥10 for FY2025/3 (the table labels these years “2025” and “2024”). The dividend forecast for FY2027/3 and any share buyback policy cannot be confirmed from the materials.
| Item | FY2025/3 | FY2026/3 |
|---|---|---|
| Dividends per share (¥) | 10 | 15 |
| Earnings per share (¥) | 39.33 | 101.69 |
| ROE (%) | 1.0 | 2.4 |
| EBITDA (¥ billion) | 90.7 | 92.0 |
| Net interest-bearing debt (¥ billion) | 694.9 | 675.2 |
| Adjusted net D/E ratio (equity basis, times) | 1.84 | 1.74 |
Medium-Term Business Plan 2030
Under the Medium-Term Business Plan 2030, the company aims to improve capital efficiency through steady execution of three basic policies — B/S Optimization, Decisive Structural Reforms and Profitability Improvement — with the goal of achieving both enhanced capital efficiency and sustainable growth, thereby increasing PBR. Its targets are ROIC of 4% or more, ROE of 8% or more, a net D/E ratio (equity basis) of less than 1.0 x, and operating income of ¥60 B or more.
This article is an analysis based on publicly available information and is not a recommendation to buy or sell any specific securities. Investment decisions are your own responsibility.
















