
This article is based on publicly available IR materials and is not a recommendation to buy or sell any specific securities.
Note: I’LL Inc. has a July fiscal year-end, and its materials label the fiscal year ended July 31, 2026 as “FY7/26” and the fiscal year ending July 31, 2027 as “FY7/27”. This site classifies the most recently completed fiscal year as FY2025; the figures and period labels below follow the company’s materials.
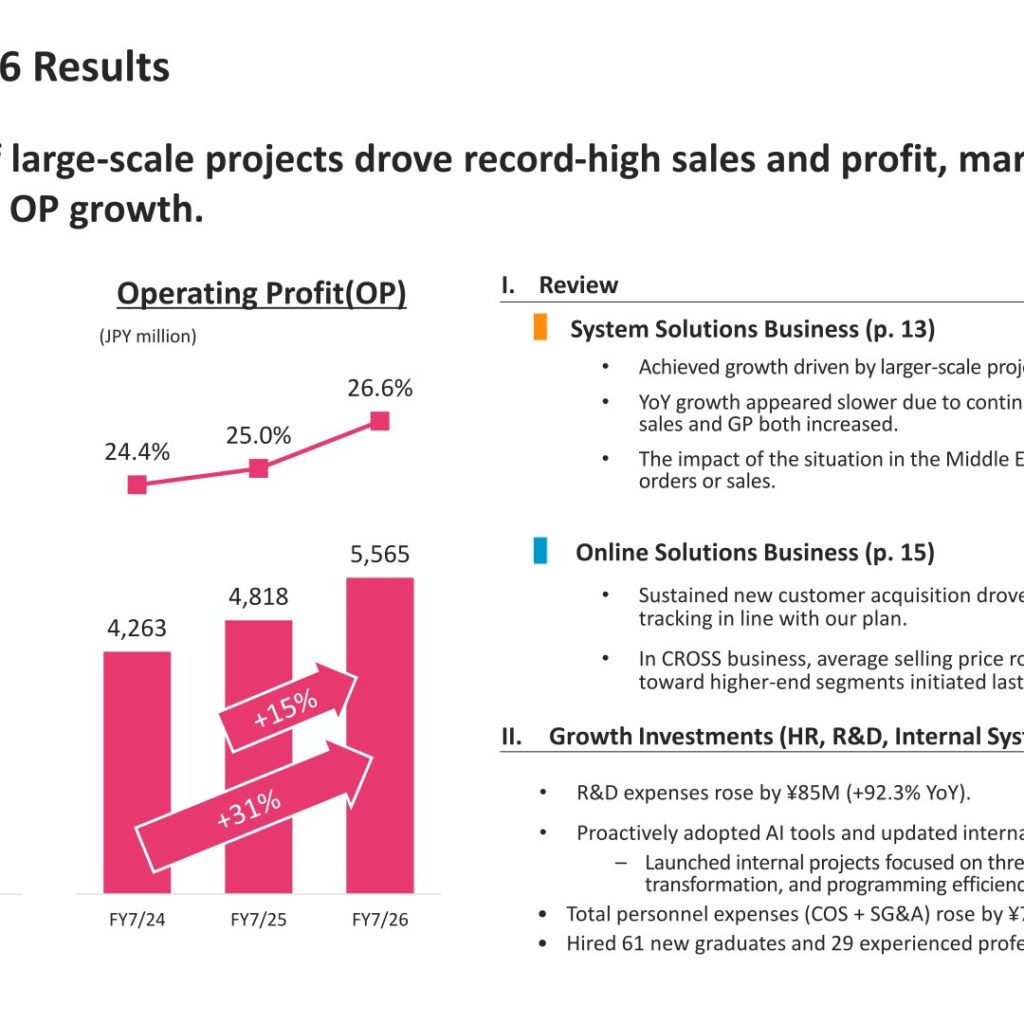
I’LL Inc. reported FY7/26 net sales of 20,889 JPY million (+8.3% YoY) and operating profit (OP) of 5,565 JPY million (+15.5% YoY), with the operating profit margin (OPM) rising 1.7pp to 26.6%. The company describes the year as record-high sales and profit, driven by strong execution of large-scale projects, marking the 11th consecutive year of OP growth. Profit rose to 4,175 JPY million (+20%). For FY7/27, the company plans net sales of 22,800 JPY million (+9.1%) and OP of 5,000 JPY million (-10.2%), reflecting stepped-up investment in human capital, product enhancement and internal systems, while planning a dividend per share of ¥70 (+¥3), which would be a 9th consecutive dividend increase.
Consolidated Results (FY7/26 Actual)
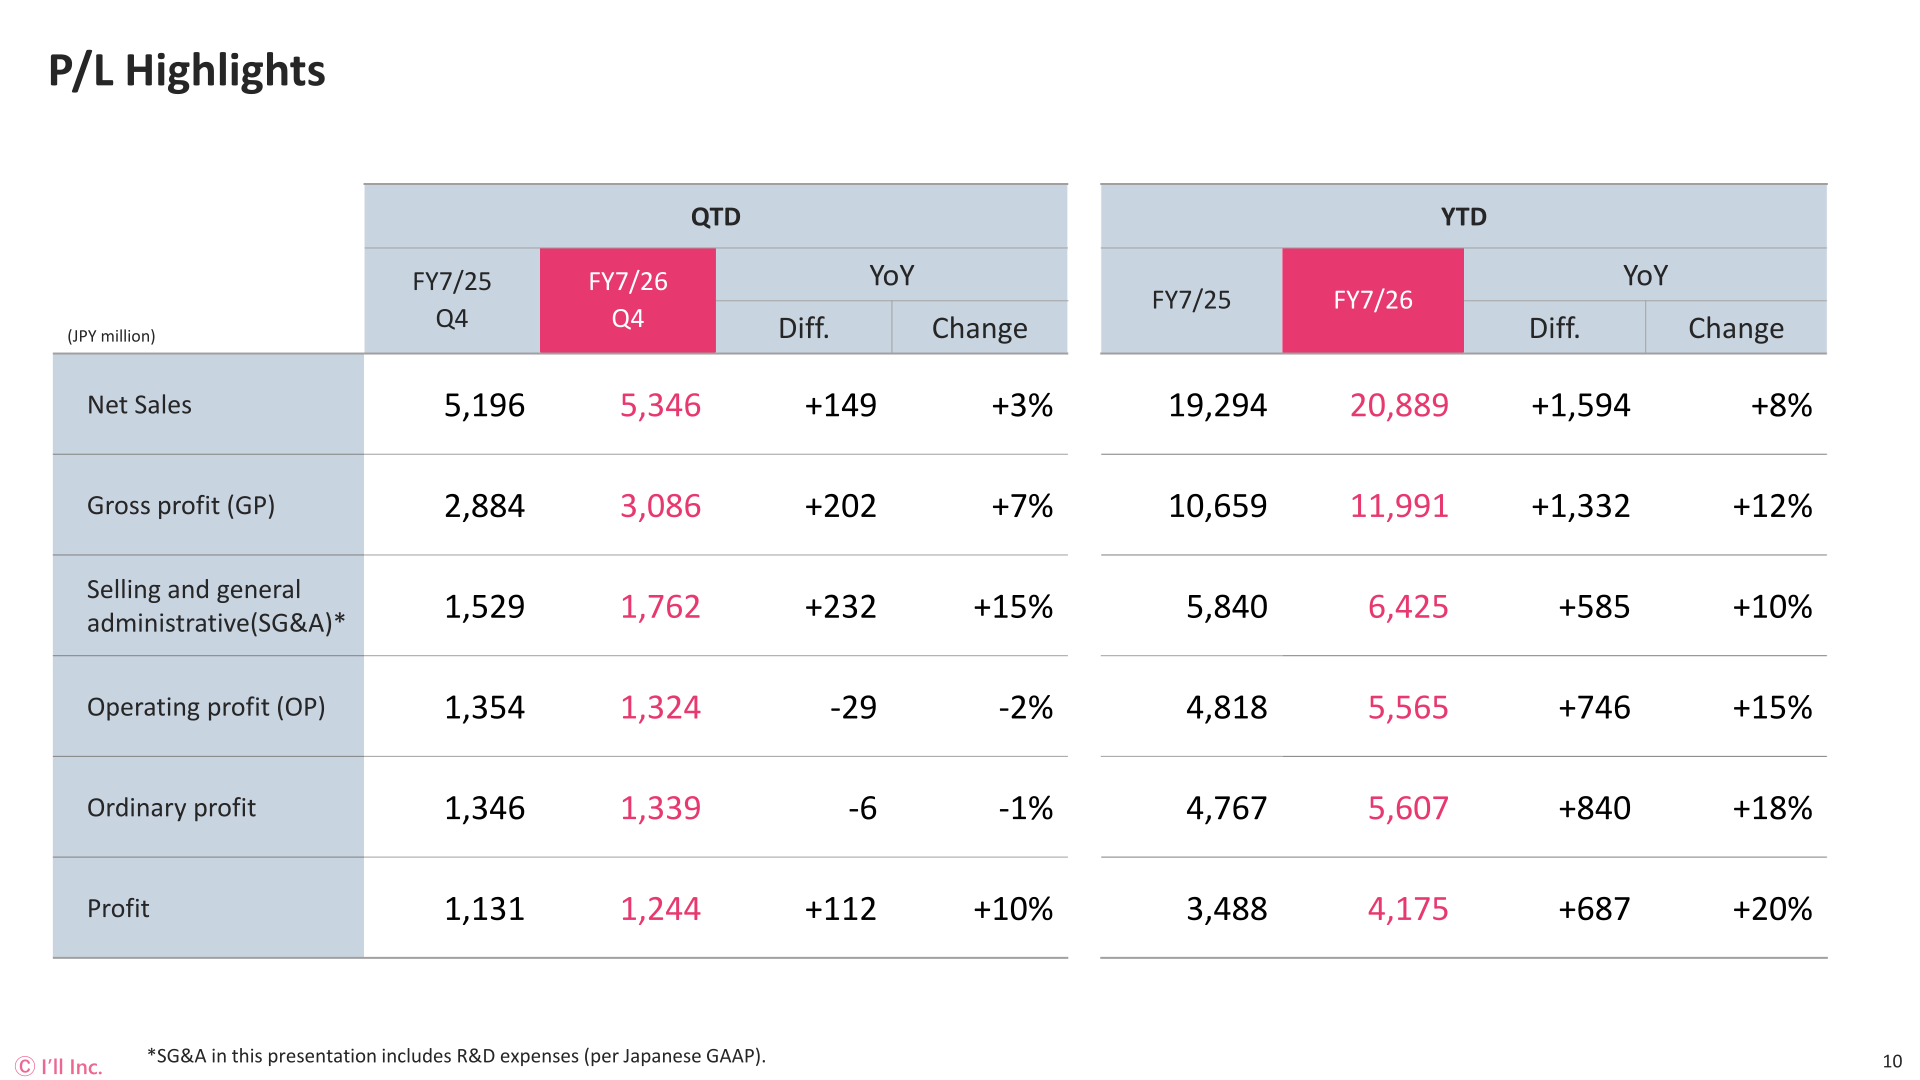
Net sales grew by 1,594 JPY million to 20,889 JPY million and gross profit (GP) by 1,332 JPY million to 11,991 JPY million, with GPM improving from 55.2% to 57.4%. SG&A (which includes R&D expenses) rose by 585 JPY million to 6,425 JPY million. As a result, OP increased by 746 JPY million to 5,565 JPY million, ordinary profit by 840 JPY million to 5,607 JPY million and profit by 687 JPY million to 4,175 JPY million. Key figures highlighted by the company include ROE of 33.2%, an equity ratio of 77% and recurring GP coverage of SG&A of 86%.
| Item (JPY million) | FY7/26 | FY7/25 | Diff. | Change |
|---|---|---|---|---|
| Net sales | 20,889 | 19,294 | +1,594 | +8% |
| Gross profit (GP) | 11,991 | 10,659 | +1,332 | +12% |
| SG&A (incl. R&D expenses) | 6,425 | 5,840 | +585 | +10% |
| Operating profit (OP) | 5,565 | 4,818 | +746 | +15% |
| Ordinary profit | 5,607 | 4,767 | +840 | +18% |
| Profit | 4,175 | 3,488 | +687 | +20% |
In Q4 (three months) of FY7/26, net sales were 5,346 JPY million (+3% YoY) and GP was 3,086 JPY million (+7%), while OP was 1,324 JPY million (-2%) as higher SG&A, including year-end bonuses, relocation costs, higher R&D expenses and stronger recruitment activities, outweighed GP growth. The company notes that YoY growth appeared slower due to continued server delivery delays, and that the impact of the situation in the Middle East has not yet become apparent in either orders or sales.
On the cost side, total personnel expenses (COS + SG&A) rose by ¥715M (+9.0% YoY) and R&D expenses rose by ¥85M (+92.3% YoY). The company hired 61 new graduates and 29 experienced professionals during the fiscal year. As of July 31, 2026, total assets were 17,961 JPY million and total net assets were 13,863 JPY million, with the equity ratio at 77% (+6pp). Investing cash outflows rose sharply due to ¥2.2B in time deposits and office relocation costs.
Segment Results
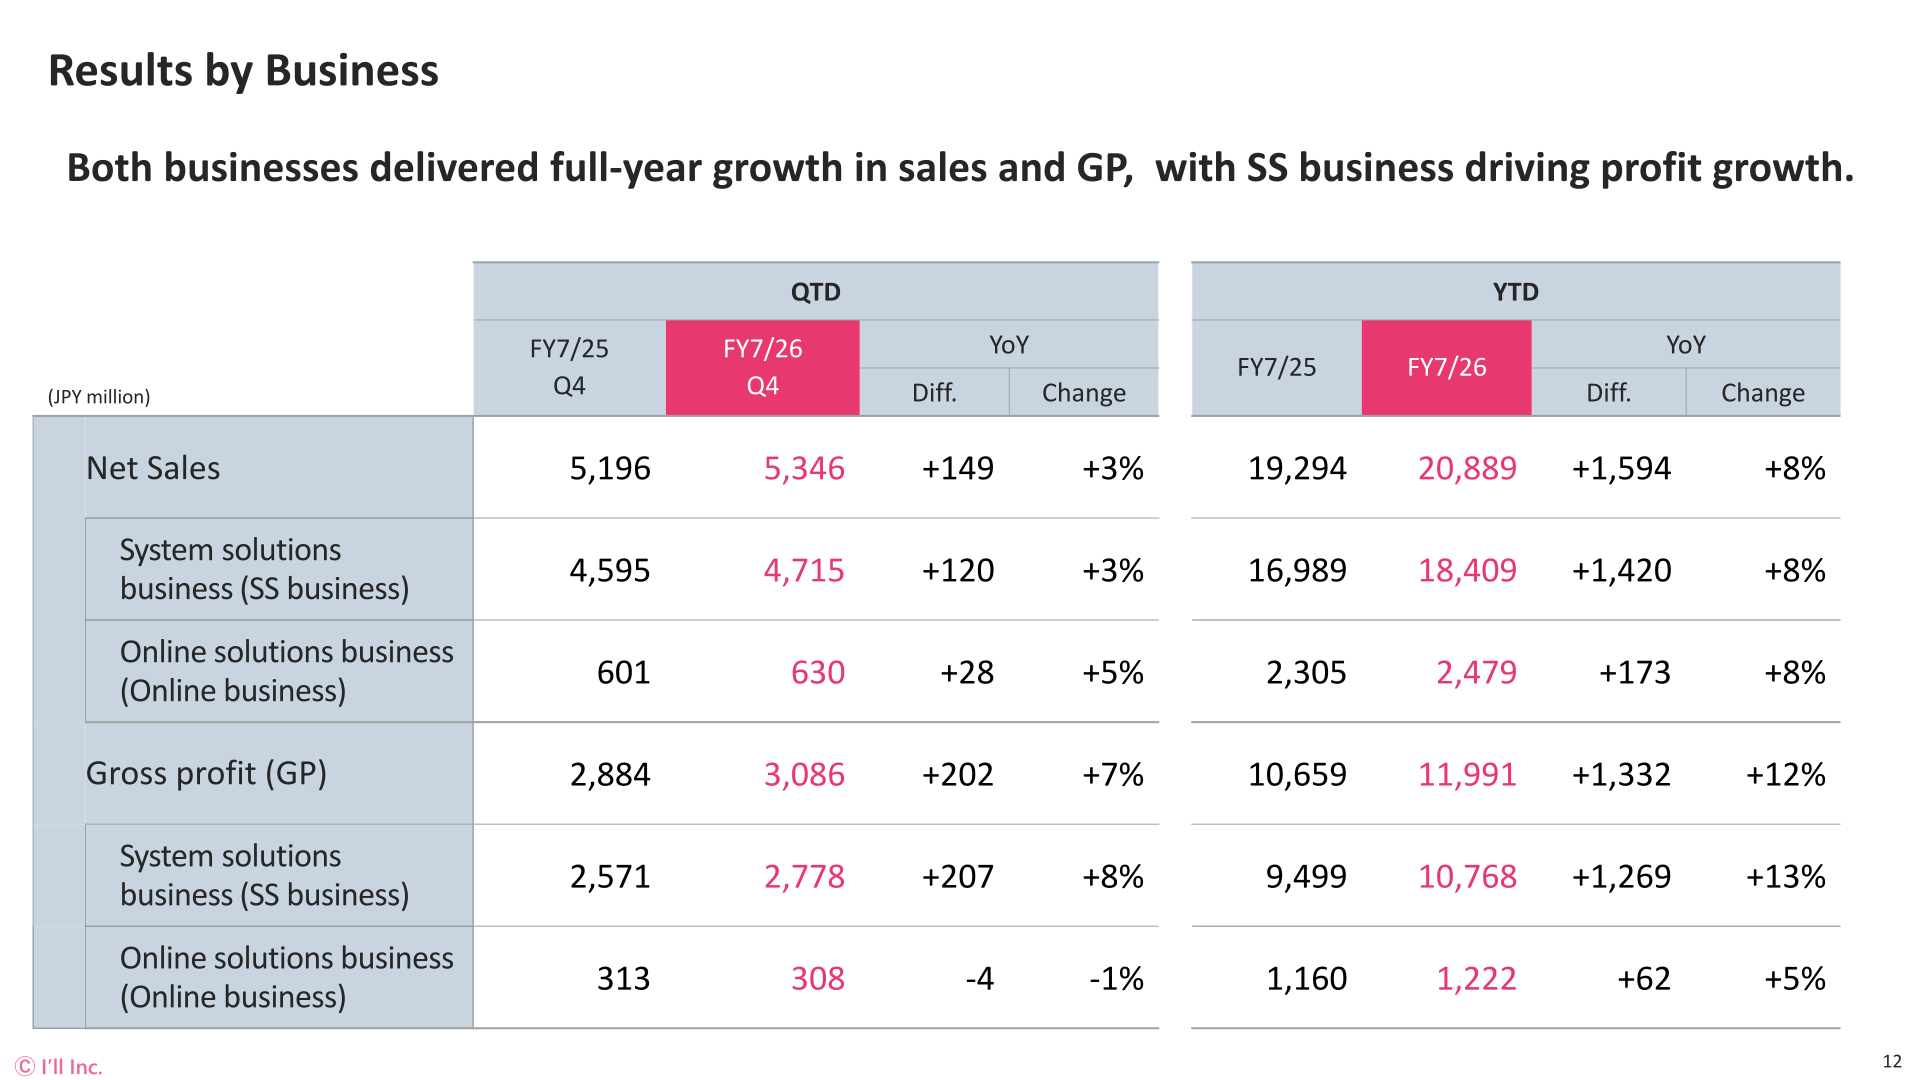
System Solutions Business (SS business): net sales were 18,409 JPY million (+8%) and GP was 10,768 JPY million (+13%), with GPM improving from 55.9% to 58.5%. Productivity gains and steady progress on large-scale projects drove growth, and recurring GPM exceeded expectations. Lower hardware sales due to server delivery delays were offset by software-related sales, and AI adoption in business operations is contributing to productivity improvements.
Online Solutions Business (Online business): net sales were 2,479 JPY million (+8%) and GP was 1,222 JPY million (+5%). Within this, CROSS business sales were 1,933 JPY million (FY7/25: 1,767 JPY million), with average selling price rising YoY driven by the strategic shift toward higher-end segments. CROSS business GPM declined from 56.5% to 54.5% due to upfront investment in BACKYARD, which the company positions as its next core growth pillar. CROSS MALL recurring revenue grew +11.3% YoY and CROSS POINT recurring revenue +8.0% YoY.
| Segment (JPY million) | Metric | FY7/26 | FY7/25 | Change |
|---|---|---|---|---|
| System Solutions Business | Net sales | 18,409 | 16,989 | +8% |
| System Solutions Business | Gross profit | 10,768 | 9,499 | +13% |
| Online Solutions Business | Net sales | 2,479 | 2,305 | +8% |
| Online Solutions Business | Gross profit | 1,222 | 1,160 | +5% |
| Total | Net sales | 20,889 | 19,294 | +8% |
| Total | Gross profit | 11,991 | 10,659 | +12% |
Recurring revenue reached 9,286 JPY million (FY7/25: 8,319 JPY million) and recurring GP 5,515 JPY million (FY7/25: 4,894 JPY million), covering 86% of SG&A. At fiscal year-end the number of customers was 5,379 in the SS business and 2,314 in the Online business. Under its CROSS-OVER strategy, the company cites a win rate against competitors of 89.9% (5-year total, FY7/22–26) and a repeat rate of 98.4% (FY7/26).
FY7/27 Plan and Three-year Rolling Plan (FY7/27–FY7/29)
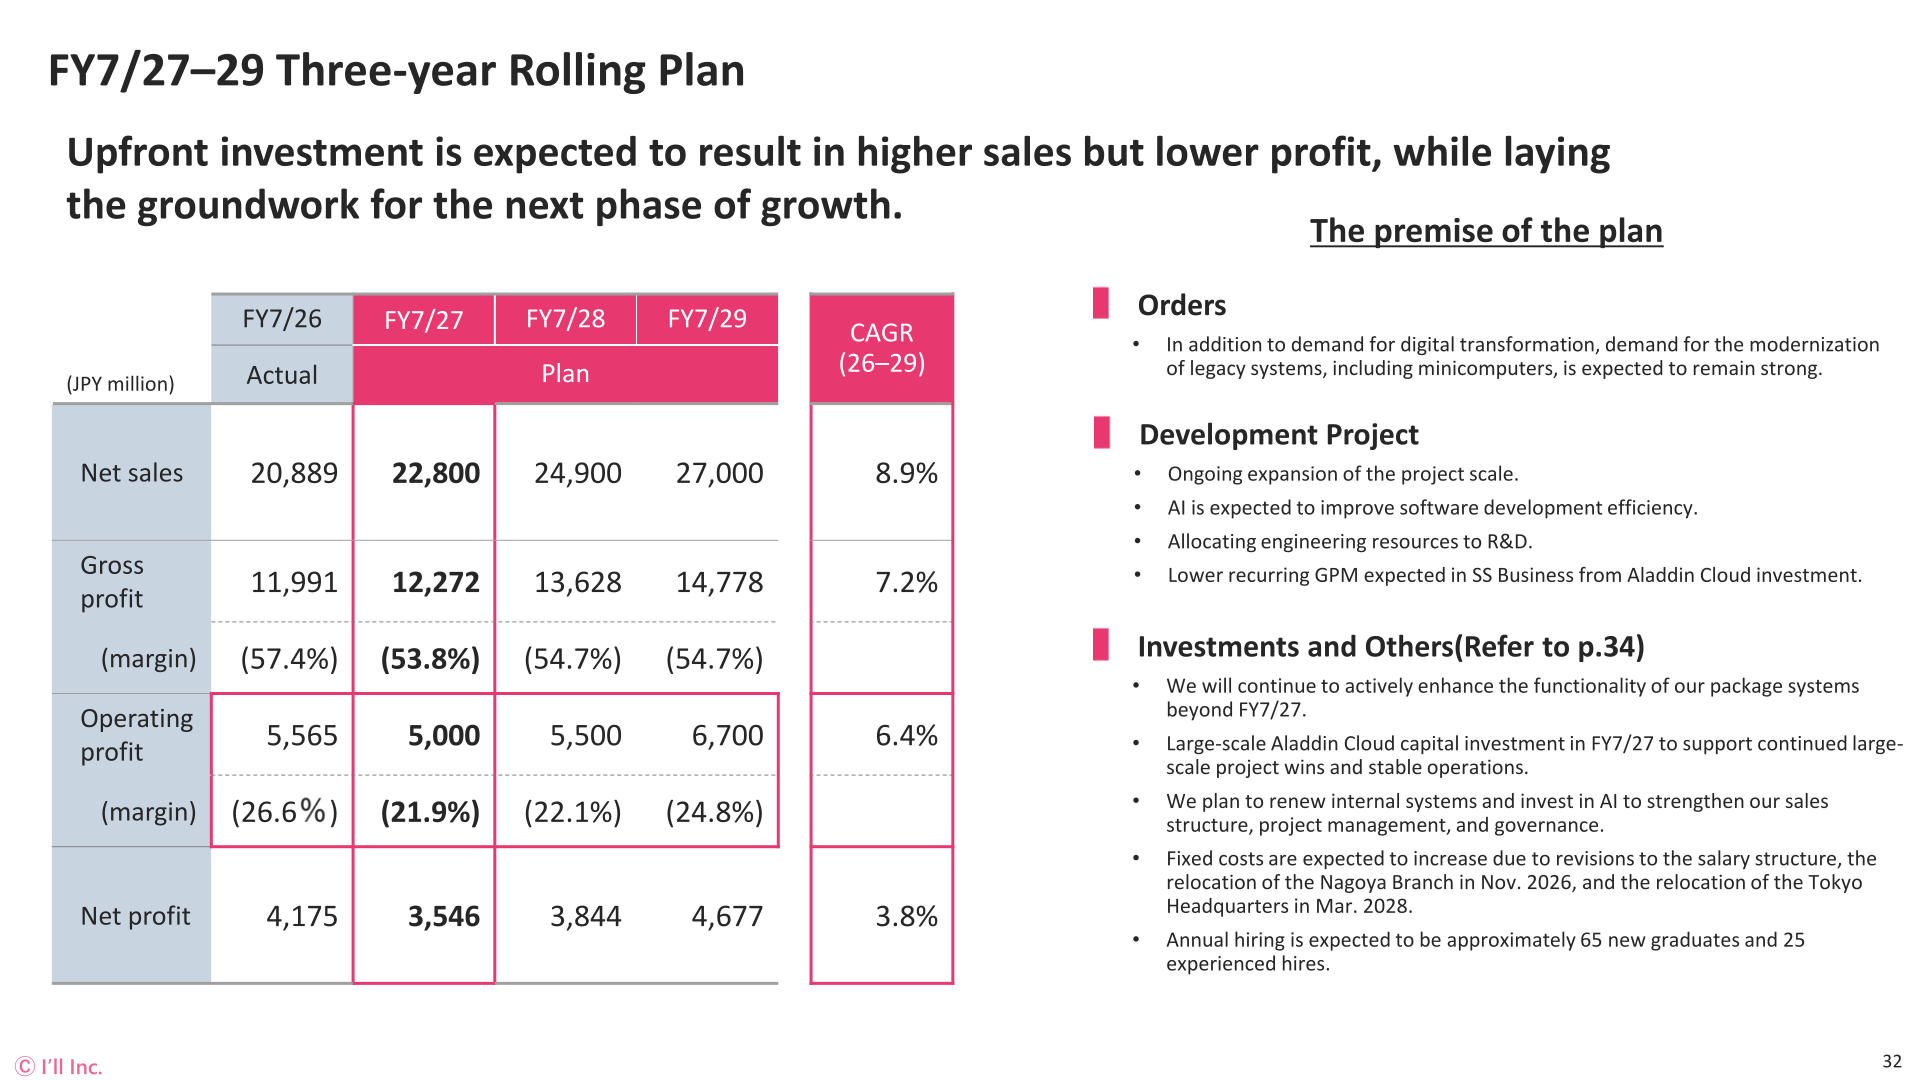
For FY7/27, the company plans net sales of 22,800 JPY million (+9.1%), OP of 5,000 JPY million (-10.2%) and net profit of 3,546 JPY million, with OPM of 21.9%. The illustrative OP bridge shows +1,100 JPY million from GP growth on higher net sales, offset by personnel costs (COS + SG&A) of -700, product enhancement investment of -500, office relocation costs of -300 and internal systems & other of -165. Versus the September 2025 plan, net sales are +¥364M and OP is -¥753M, reflecting growth investments. By half, the plan calls for net sales of 10,923 JPY million in 1H and 11,876 JPY million in 2H, and OP of 2,406 JPY million in 1H and 2,593 JPY million in 2H.
| Item (JPY million) | FY7/26 Actual | FY7/27 Plan | FY7/28 Plan | FY7/29 Plan | CAGR (26–29) |
|---|---|---|---|---|---|
| Net sales | 20,889 | 22,800 | 24,900 | 27,000 | 8.9% |
| Gross profit | 11,991 | 12,272 | 13,628 | 14,778 | 7.2% |
| (GP margin) | (57.4%) | (53.8%) | (54.7%) | (54.7%) | ― |
| Operating profit | 5,565 | 5,000 | 5,500 | 6,700 | 6.4% |
| (OP margin) | (26.6%) | (21.9%) | (22.1%) | (24.8%) | ― |
| Net profit | 4,175 | 3,546 | 3,844 | 4,677 | 3.8% |
The plan assumes continued demand for digital transformation and for the modernization of legacy systems, including minicomputers; large-scale Aladdin Cloud capital investment in FY7/27; renewal of internal systems and AI investment; and higher fixed costs from salary structure revisions, the relocation of the Nagoya Branch in Nov. 2026 and the relocation of the Tokyo Headquarters in Mar. 2028. Annual hiring is expected to be approximately 65 new graduates and 25 experienced hires. The company states that growth investments will temporarily pressure OPM, while it targets 30% over the medium to long term.
Shareholder Returns
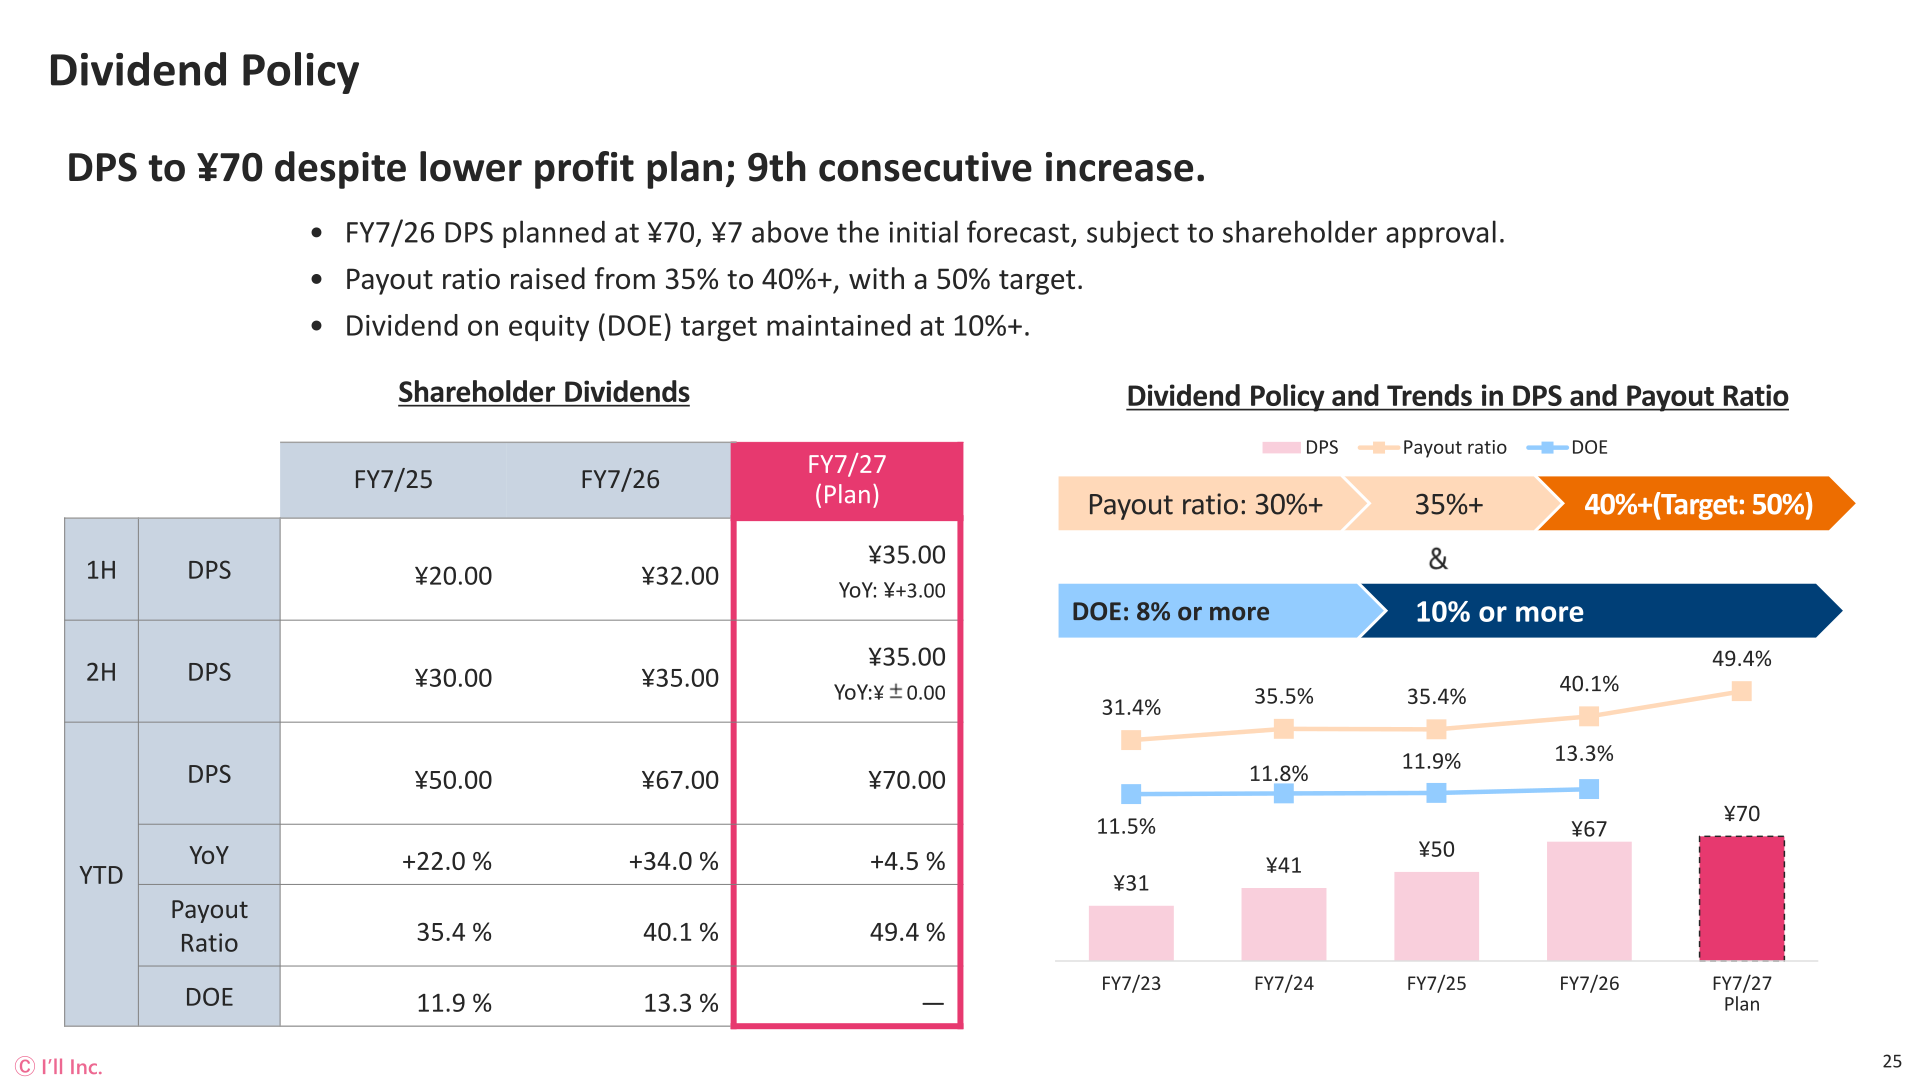
FY7/26 annual DPS was ¥67.00 (1H ¥32.00, 2H ¥35.00), up 34.0% from ¥50.00 in FY7/25, for a payout ratio of 40.1% and DOE of 13.3%. For FY7/27 the company plans DPS of ¥70.00 (1H ¥35.00, 2H ¥35.00, +4.5%), a 9th consecutive increase despite the lower profit plan, for a planned payout ratio of 49.4%. The payout ratio policy has been raised from 35% to 40%+, with a 50% target, and the DOE target of 10%+ is maintained.
| Item | FY7/25 | FY7/26 | FY7/27 (Plan) |
|---|---|---|---|
| 1H DPS | ¥20.00 | ¥32.00 | ¥35.00 |
| 2H DPS | ¥30.00 | ¥35.00 | ¥35.00 |
| Annual DPS | ¥50.00 | ¥67.00 | ¥70.00 |
| YoY | +22.0 % | +34.0 % | +4.5 % |
| Payout ratio | 35.4 % | 40.1 % | 49.4 % |
| DOE | 11.9 % | 13.3 % | — |
Medium-Term Vision and Topics
The company defines FY7/26–28 as the “Acceleration of Growth Investment” phase, during which it will build new foundations toward its vision of becoming an “Industrial Platform Provider” that drives supply chain transformation. It plans to establish a “Core system AI” business model leveraging its position in the core systems market, and to drive internal structural reform centered on human capital, R&D and internal systems. The company states that ROE consistently exceeds its cost of equity, with the cost of capital lowered from 9.2% to 7.5%, and that it has reset its immediate milestone to a 30% OPM.
This article is an analysis based on publicly available information and is not a recommendation to buy or sell any specific securities. Investment decisions are your own responsibility.
















