
This article is based on publicly available IR materials and is not a recommendation to buy or sell any specific securities.
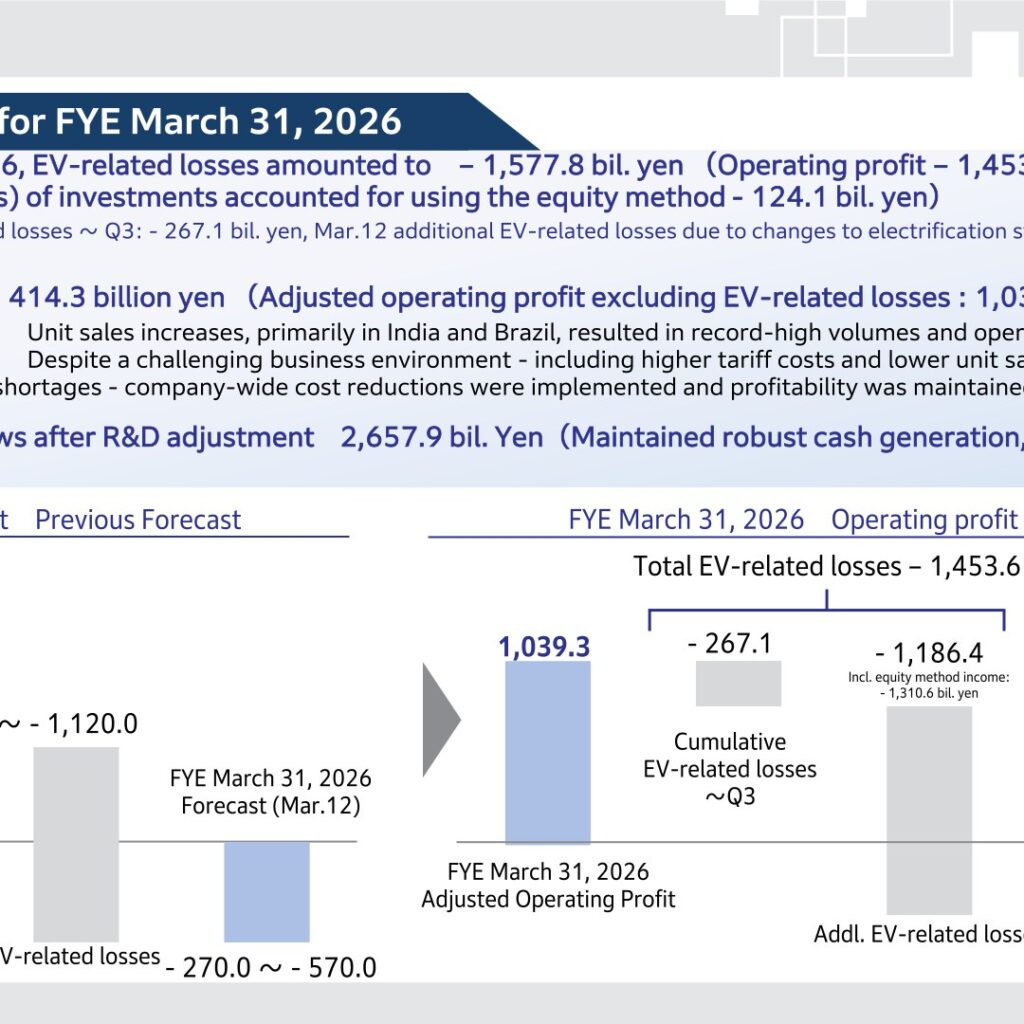
Honda Motor reported consolidated results for the fiscal year ended March 31, 2026 (FYE March 2026), with sales revenue up 0.5% year on year to 21,796.6 billion yen. However, the company recorded an operating loss of 414.3 billion yen (versus operating profit of 1,213.4 billion yen a year earlier), reflecting total EV-related losses of 1,577.8 billion yen tied to a review of its electrification strategy, including 1,310.6 billion yen of additional EV-related losses recognized following the March 12 strategy change. Excluding these one-time EV-related losses, adjusted operating profit was 1,039.3 billion yen (4.8% margin). Profit for the year attributable to owners of the parent turned negative at -423.9 billion yen, versus profit of 835.8 billion yen in the prior year, even as the Motorcycle business posted record-high unit sales and operating profit.
Consolidated Results (Full-Year Actual)
Sales revenue rose 107.8 billion yen (+0.5%) to 21,796.6 billion yen. Operating profit swung to a loss of 414.3 billion yen (operating margin -1.9%, down 7.5pt), a decline of 1,627.8 billion yen from the prior year’s 1,213.4 billion yen (5.6% margin). Share of profit (loss) of investments accounted for using the equity method was -162.0 billion yen (prior year: 0.9 billion yen). Profit before income taxes was -403.3 billion yen and profit for the year attributable to owners of the parent was -423.9 billion yen, versus 1,317.6 billion yen and 835.8 billion yen respectively in the prior year. Earnings per share were -106.06 yen (prior year: 178.93 yen). The market average USD rate was 151 yen, versus 153 yen a year earlier.
| Item | FYE Mar 2026 (Result) | FYE Mar 2025 (Result) | Change |
|---|---|---|---|
| Sales revenue (Yen bn) | 21,796.6 | 21,688.7 | +107.8 (+0.5%) |
| Operating profit (Yen bn) | -414.3 | 1,213.4 | -1,627.8 |
| Operating margin | -1.9% | 5.6% | -7.5pt |
| Adjusted operating profit excl. EV-related losses (Yen bn) | 1,039.3 (margin 4.8%) | ― | ― |
| Share of profit (loss) of investments accounted for using equity method (Yen bn) | -162.0 | 0.9 | -163.0 |
| Profit before income taxes (Yen bn) | -403.3 | 1,317.6 | -1,720.9 |
| Profit for the year attributable to owners of the parent (Yen bn) | -423.9 | 835.8 | -1,259.7 |
| EPS attributable to owners of the parent (Yen) | -106.06 | 178.93 | -284.99 |
| Market average rate, U.S. Dollar (Yen) | 151 | 153 | -2 |
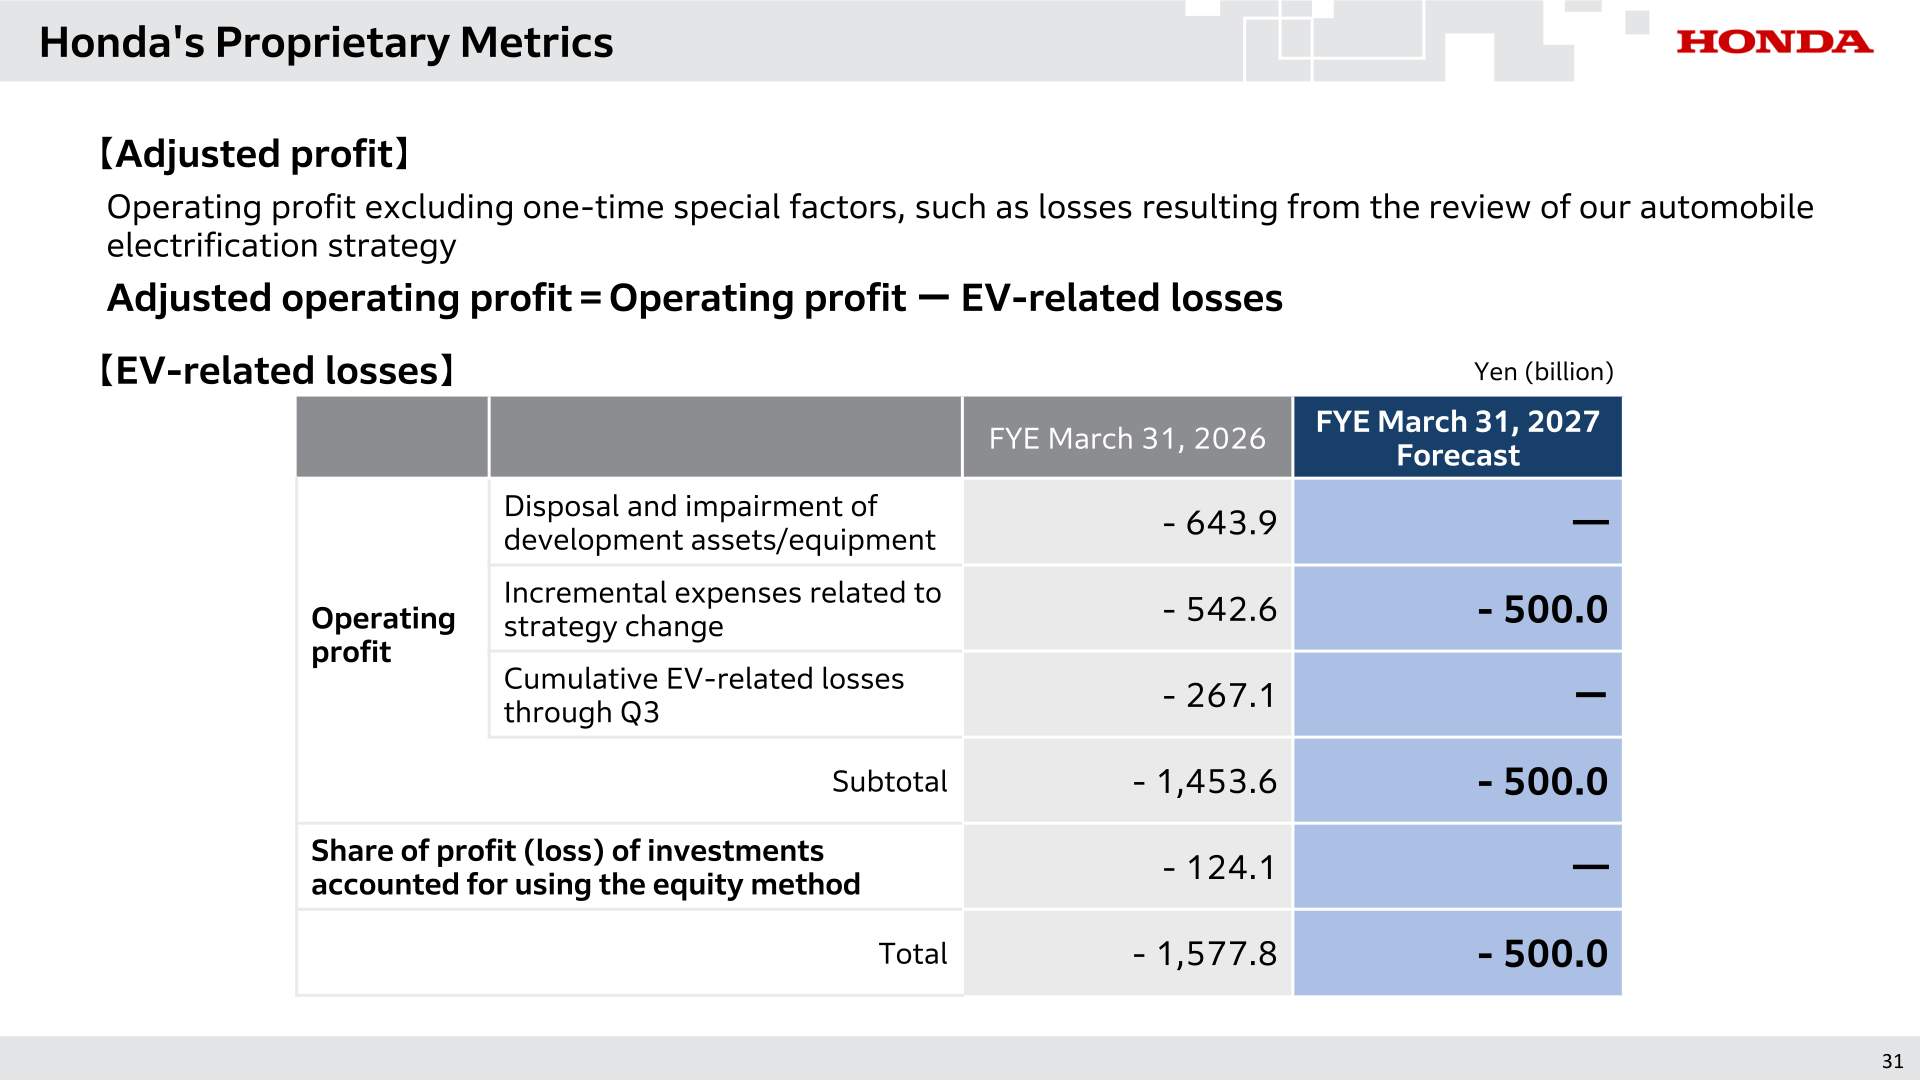
Per the Appendix breakdown of EV-related losses (FYE March 2026, operating profit basis): disposal and impairment of development assets/equipment -643.9 billion yen; incremental expenses related to the strategy change -542.6 billion yen; cumulative EV-related losses through Q3 -267.1 billion yen; subtotal -1,453.6 billion yen. Including the -124.1 billion yen impact on share of profit (loss) of investments accounted for using the equity method, total EV-related losses were -1,577.8 billion yen.
Segment Results
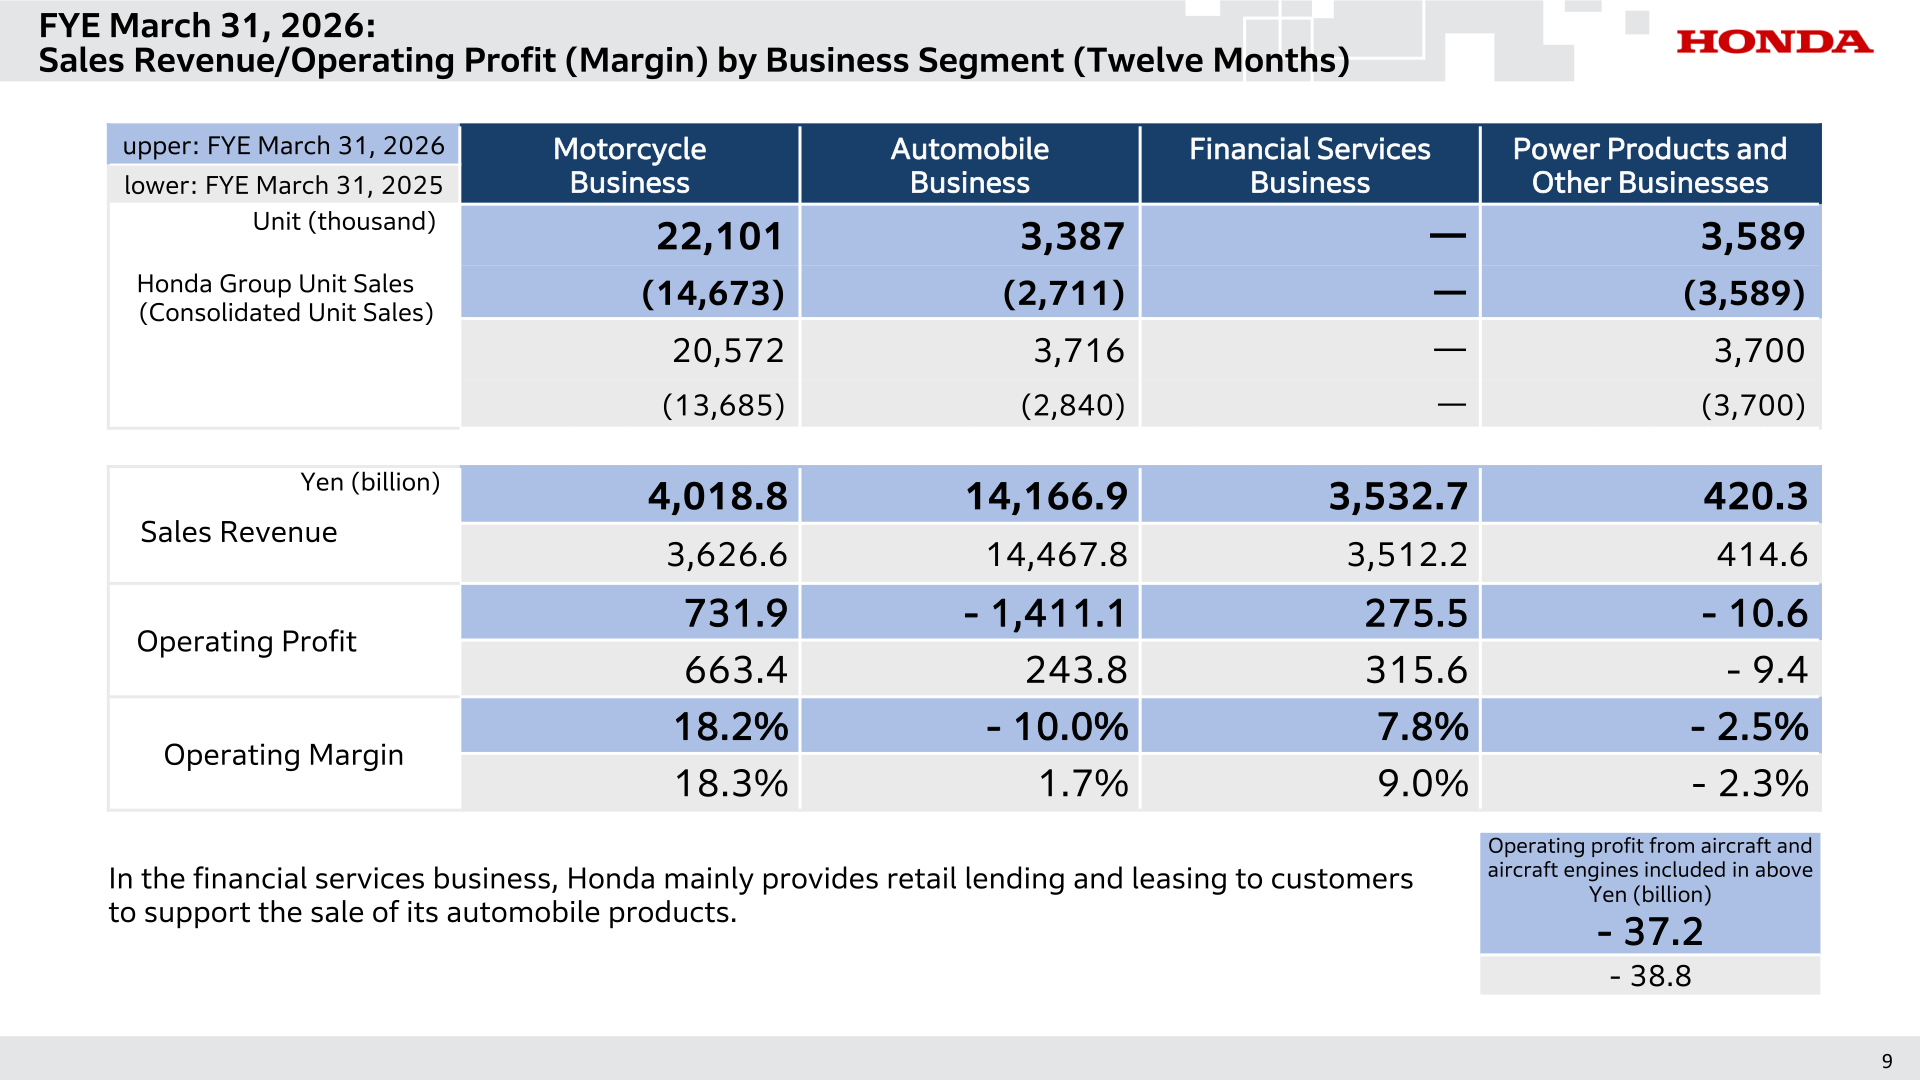
By business segment (twelve months ended March 31, 2026), the Motorcycle business achieved record results with sales revenue of 4,018.8 billion yen and operating profit of 731.9 billion yen (18.2% margin), up from 663.4 billion yen (18.3% margin) a year earlier, driven by higher unit sales primarily in Asia and South America. The Automobile business booked an operating loss of -1,411.1 billion yen (-10.0% margin) versus operating profit of 243.8 billion yen (1.7% margin) a year earlier, as EV-related losses of -1,453.6 billion yen offset price revisions and cost-reduction efforts; excluding EV-related losses, the Automobile business’ adjusted operating profit was 42.5 billion yen (0.3% margin). The Financial Services business posted operating profit of 275.5 billion yen (7.8% margin), down from 315.6 billion yen (9.0% margin). Power Products and Other Businesses posted an operating loss of -10.6 billion yen versus -9.4 billion yen a year earlier. Honda Group unit sales for the year were 22,101 thousand motorcycles (+7.4%), 3,387 thousand automobiles (-8.9%), and 3,589 thousand power products (-3.0%).
| Segment | Metric | FYE Mar 2026 | FYE Mar 2025 |
|---|---|---|---|
| Motorcycle Business | Sales Revenue (Yen bn) | 4,018.8 | 3,626.6 |
| Motorcycle Business | Operating Profit (Yen bn) | 731.9 | 663.4 |
| Motorcycle Business | Operating Margin | 18.2% | 18.3% |
| Automobile Business | Sales Revenue (Yen bn) | 14,166.9 | 14,467.8 |
| Automobile Business | Operating Profit (Yen bn) | -1,411.1 | 243.8 |
| Automobile Business | Operating Margin | -10.0% | 1.7% |
| Financial Services Business | Sales Revenue (Yen bn) | 3,532.7 | 3,512.2 |
| Financial Services Business | Operating Profit (Yen bn) | 275.5 | 315.6 |
| Financial Services Business | Operating Margin | 7.8% | 9.0% |
| Power Products and Other Businesses | Sales Revenue (Yen bn) | 420.3 | 414.6 |
| Power Products and Other Businesses | Operating Profit (Yen bn) | -10.6 | -9.4 |
| Power Products and Other Businesses | Operating Margin | -2.5% | -2.3% |
Forecast for FYE March 31, 2027
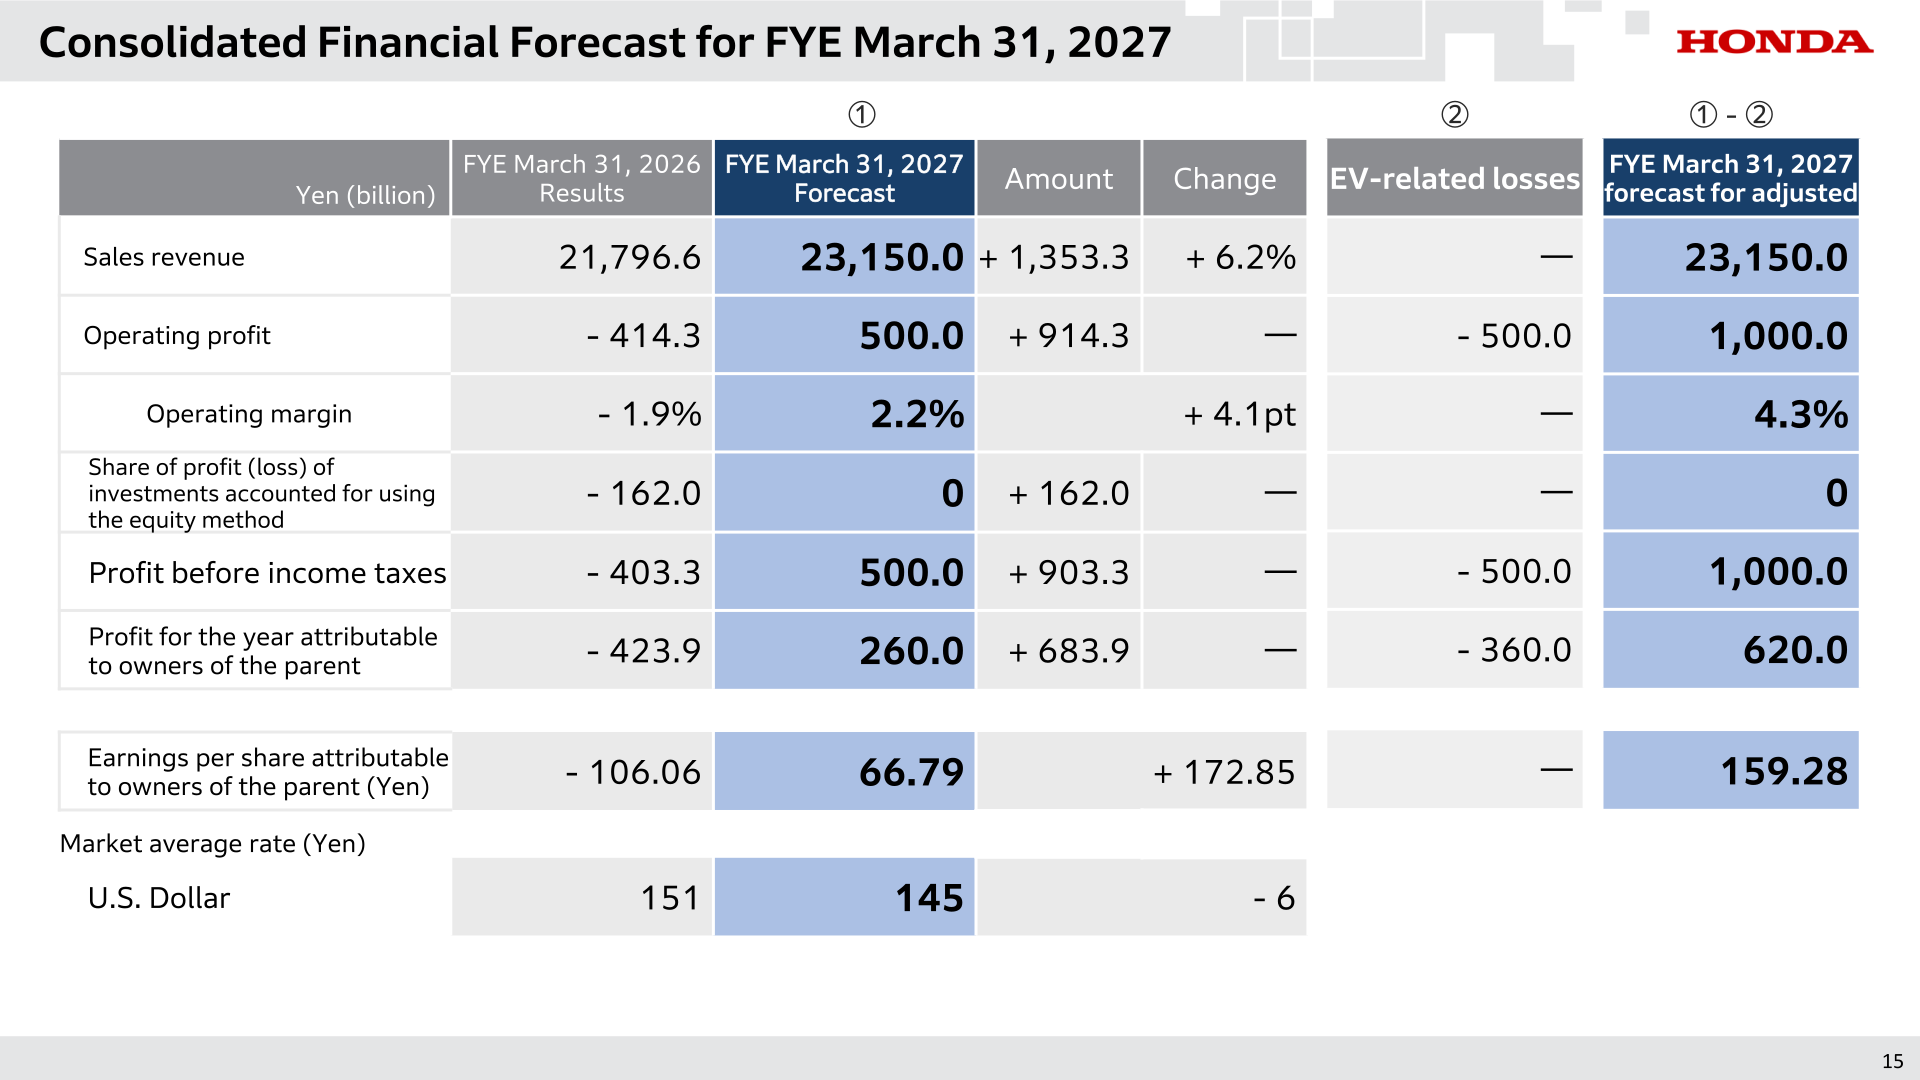
For FYE March 2027, Honda forecasts sales revenue of 23,150.0 billion yen (+6.2%) and a return to operating profit of 500.0 billion yen (2.2% margin), which includes an assumed 500.0 billion yen of further EV-related losses (incremental expenses related to the strategy change). Adjusted operating profit excluding EV-related losses is forecast at 1,000.0 billion yen (4.3% margin), down 39.3 billion yen (-3.8%) from FYE March 2026’s 1,039.3 billion yen. Profit before income taxes is forecast at 500.0 billion yen and profit for the year attributable to owners of the parent at 260.0 billion yen, with EPS of 66.79 yen. The forecast assumes a USD rate of 145 yen. Capital expenditures are forecast to rise to 1,250.0 billion yen (FYE March 2026 result: 751.3 billion yen), while R&D expenditures are forecast at 1,170.0 billion yen (FYE March 2026 result: 1,174.8 billion yen).
| Item | FYE Mar 2026 (Actual) | FYE Mar 2027 (Forecast) | Change |
|---|---|---|---|
| Sales revenue (Yen bn) | 21,796.6 | 23,150.0 | +1,353.3 (+6.2%) |
| Operating profit (Yen bn) | -414.3 | 500.0 | +914.3 |
| Operating margin | -1.9% | 2.2% | +4.1pt |
| Adjusted operating profit excl. EV-related losses (Yen bn) | 1,039.3 (margin 4.8%) | 1,000.0 (margin 4.3%) | -39.3 (-3.8%) |
| Share of profit (loss) of investments accounted for using equity method (Yen bn) | -162.0 | 0 | +162.0 |
| Profit before income taxes (Yen bn) | -403.3 | 500.0 | +903.3 |
| Profit for the year attributable to owners of the parent (Yen bn) | -423.9 | 260.0 | +683.9 |
| EPS attributable to owners of the parent (Yen) | -106.06 | 66.79 | +172.85 |
Shareholder Returns
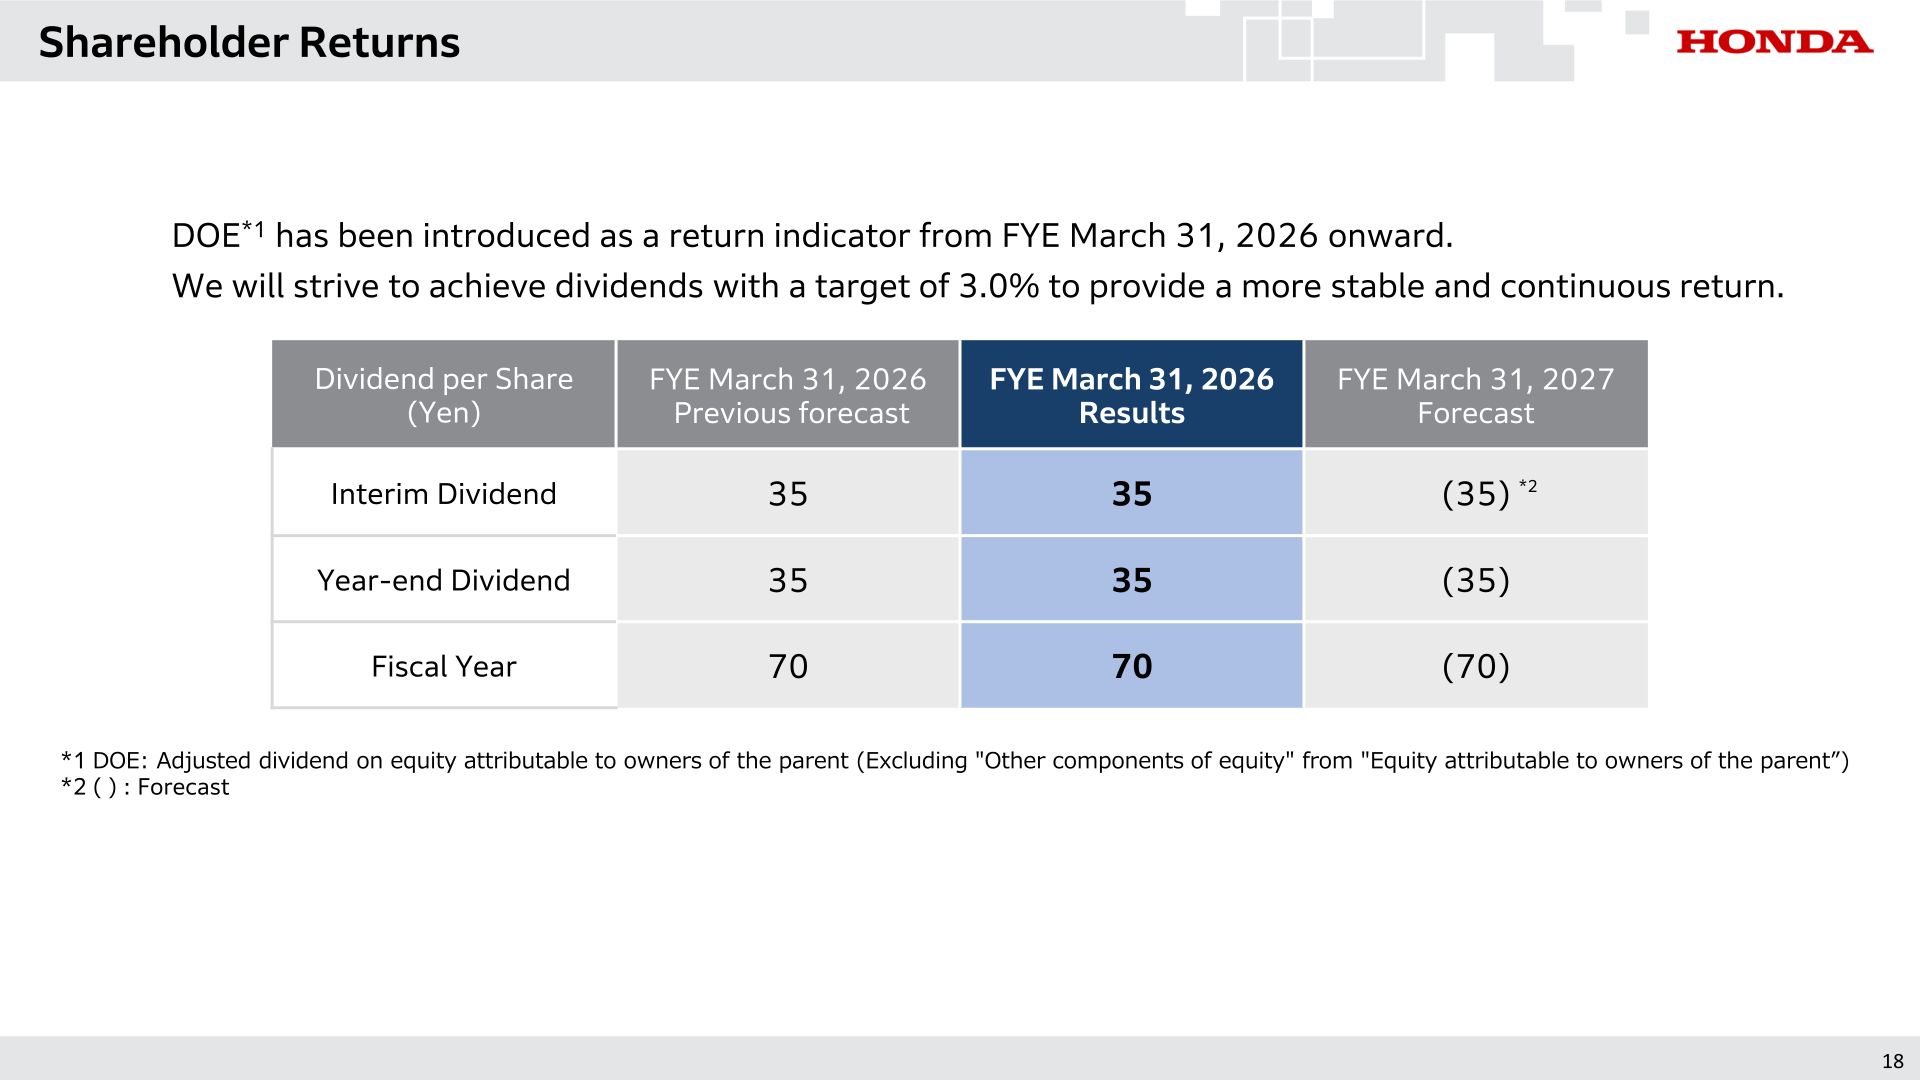
Honda introduced DOE (dividend on equity attributable to owners of the parent, excluding other components of equity) as a return indicator from FYE March 2026 onward, targeting 3.0% to provide a stable and continuous dividend. The annual dividend for FYE March 2026 was 70 yen per share (interim 35 yen, year-end 35 yen), unchanged from the previous forecast. For FYE March 2027, Honda forecasts an unchanged annual dividend of 70 yen per share (interim 35 yen, year-end 35 yen).
| Item | FYE Mar 2026 (Previous Forecast) | FYE Mar 2026 (Result) | FYE Mar 2027 (Forecast) |
|---|---|---|---|
| Interim Dividend (Yen) | 35 | 35 | 35 |
| Year-end Dividend (Yen) | 35 | 35 | 35 |
| Fiscal Year Total (Yen) | 70 | 70 | 70 |
Topics: Electrified Vehicle Retail Sales
Honda disclosed global electrified automobile retail sales for FYE March 2026 (twelve months): HEV 929 thousand units (+31 thousand year on year), PHEV 11 thousand units (-6 thousand), EV 73 thousand units (-4 thousand), and FCEV 0 thousand units. Excluding China, HEV retail sales were 870 thousand units (+62 thousand), PHEV 4 thousand units (+1 thousand), and EV 57 thousand units (-10 thousand).
This article is an analysis based on publicly available information and is not a recommendation to buy or sell any specific securities. Investment decisions are your own responsibility.
![[Obayashi] Investors’ Guide 2026 — The Complete 24-Article Breakdown](https://japan-equity.com/wp-content/uploads/2026/07/hub_cover-1024x1024.png)
![[Obayashi] IR & SR Policy — Feeding Dialogue Back into Management](https://japan-equity.com/wp-content/uploads/2026/07/p32_sq-1024x1024.jpg)
![[Obayashi] Real Estate Development — 18.7% Margin, ¥287.7bn Unrealized Gains](https://japan-equity.com/wp-content/uploads/2026/07/p20_sq-1024x1024.jpg)
![[Obayashi] Domestic Civil Engineering — Resilience Spending Supports 9.6% Margin](https://japan-equity.com/wp-content/uploads/2026/07/p11_sq-1024x1024.jpg)
![[Obayashi] Share Price & External Ratings — vs TOPIX, ESG Index Inclusion](https://japan-equity.com/wp-content/uploads/2026/07/p40_sq-1024x1024.jpg)
![[Construction] ¥75.5tn Investment, Shrinking Workforce — Big-5 Market Share](https://japan-equity.com/wp-content/uploads/2026/07/p12_sq-1024x1024.jpg)



![[Obayashi] Capital Policy & Shareholder Returns — ROE 10%+, DOE ~5%, ¥100bn Buyback](https://japan-equity.com/wp-content/uploads/2026/07/p27_sq-1024x1024.jpg)
![[Obayashi] Reducing Cross-Shareholdings — ¥285.2bn Sold in Five Years](https://japan-equity.com/wp-content/uploads/2026/07/p29_sq-1024x1024.jpg)
![[Obayashi] ¥750bn Investment Plan — ¥300bn to Development, ¥190bn to Tech/DX](https://japan-equity.com/wp-content/uploads/2026/07/p30_sq-1024x1024.jpg)
![[Obayashi] MTP2022 KPIs — Operating Profit ~2x Target, ROE 14.4%](https://japan-equity.com/wp-content/uploads/2026/07/p25_sq-1024x1024.jpg)
![[Obayashi] Cash Allocation — ¥420bn Investment CF Over Five Years](https://japan-equity.com/wp-content/uploads/2026/07/p26_sq-1024x1024.jpg)
![[Obayashi] Green Energy — 44 Plants, 344MW, and the Green Hydrogen Challenge](https://japan-equity.com/wp-content/uploads/2026/07/p21_sq-1024x1024.jpg)
![[Obayashi] Tackling the Labor Shortage — Robotics Construction®](https://japan-equity.com/wp-content/uploads/2026/07/p14_sq-1024x1024.jpg)
