
This article is based on publicly available IR materials and is not a recommendation to buy or sell any specific securities.
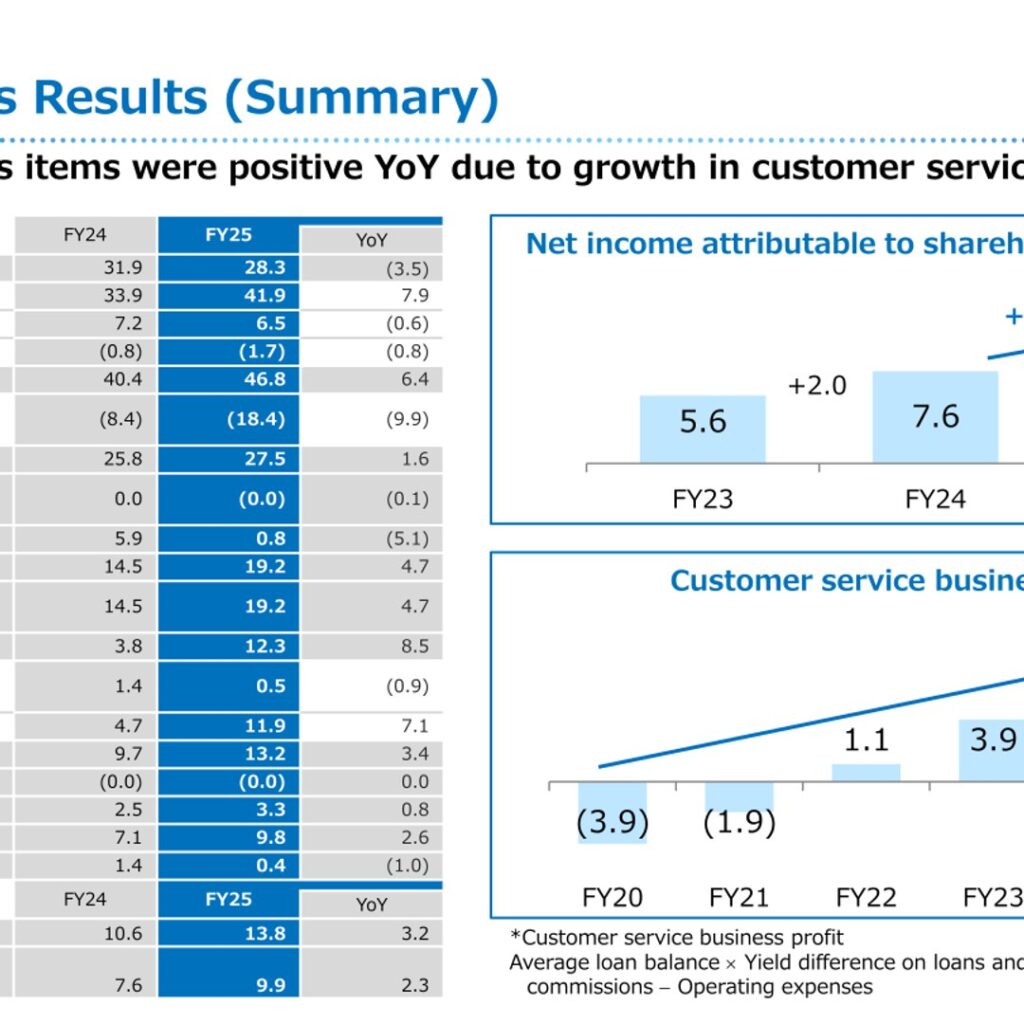
The Yamanashi Chuo Bank, Ltd. (Prime Market of the Tokyo Stock Exchange: 8360) presented its results for FY25 at its 50th Analyst Meeting held on May 27, 2026. In the Bank’s materials, “FY25” refers to the fiscal year ended March 31, 2026, shown here as FY2025 per site convention. Net income attributable to shareholders of the parent increased by 2.3 billion yen year on year to 9.9 billion yen, and loans (term-end balance) increased by 272.8 billion yen year on year to 3,032.8 billion yen as of March 31, 2026. The Bank also revised its Medium-Term Management Plan KPI targets upward and raised its annual dividend to 131 yen per share, up 55 yen from the previous fiscal year.
Consolidated Results (Full-Year Actual)
On a non-consolidated basis, core gross business profit rose 6.4 billion yen year on year to 46.8 billion yen, mainly on higher interest income, while the contribution from JGBs and other bond transactions was a larger negative of (18.4) billion yen. Core net business profit increased 4.7 billion yen to 19.2 billion yen. Non-operating gains (losses) rose 8.5 billion yen to 12.3 billion yen, helped by higher stock and other related income, and non-consolidated net income rose 2.6 billion yen to 9.8 billion yen. On a consolidated basis, consolidated ordinary profits rose 3.2 billion yen to 13.8 billion yen and net income attributable to shareholders of the parent rose 2.3 billion yen to 9.9 billion yen.
| Item (Non-Consolidated, ¥ billion) | FY2024 | FY2025 | YoY |
|---|---|---|---|
| Gross business profit | 31.9 | 28.3 | (3.5) |
| Interest Income | 33.9 | 41.9 | 7.9 |
| Fees and Commissions | 7.2 | 6.5 | (0.6) |
| Other operating income | (0.8) | (1.7) | (0.8) |
| Core gross business profit | 40.4 | 46.8 | 6.4 |
| JGBs and other bond transactions | (8.4) | (18.4) | (9.9) |
| Expenses | 25.8 | 27.5 | 1.6 |
| General provision to loan loss reserve | 0.0 | (0.0) | (0.1) |
| Net business profit | 5.9 | 0.8 | (5.1) |
| Core net business profit | 14.5 | 19.2 | 4.7 |
| Non-operating gains (losses) | 3.8 | 12.3 | 8.5 |
| Disposal of non-performing loans | 1.4 | 0.5 | (0.9) |
| Stock and other related income | 4.7 | 11.9 | 7.1 |
| Ordinary profits | 9.7 | 13.2 | 3.4 |
| Total corporate taxes, etc. | 2.5 | 3.3 | 0.8 |
| Net income | 7.1 | 9.8 | 2.6 |
| Credit-related costs | 1.4 | 0.4 | (1.0) |
| Item (Consolidated, ¥ billion) | FY2024 | FY2025 | YoY |
|---|---|---|---|
| Consolidated ordinary profits | 10.6 | 13.8 | 3.2 |
| Net income attributable to shareholders of the parent | 7.6 | 9.9 | 2.3 |
Deposits and Loans
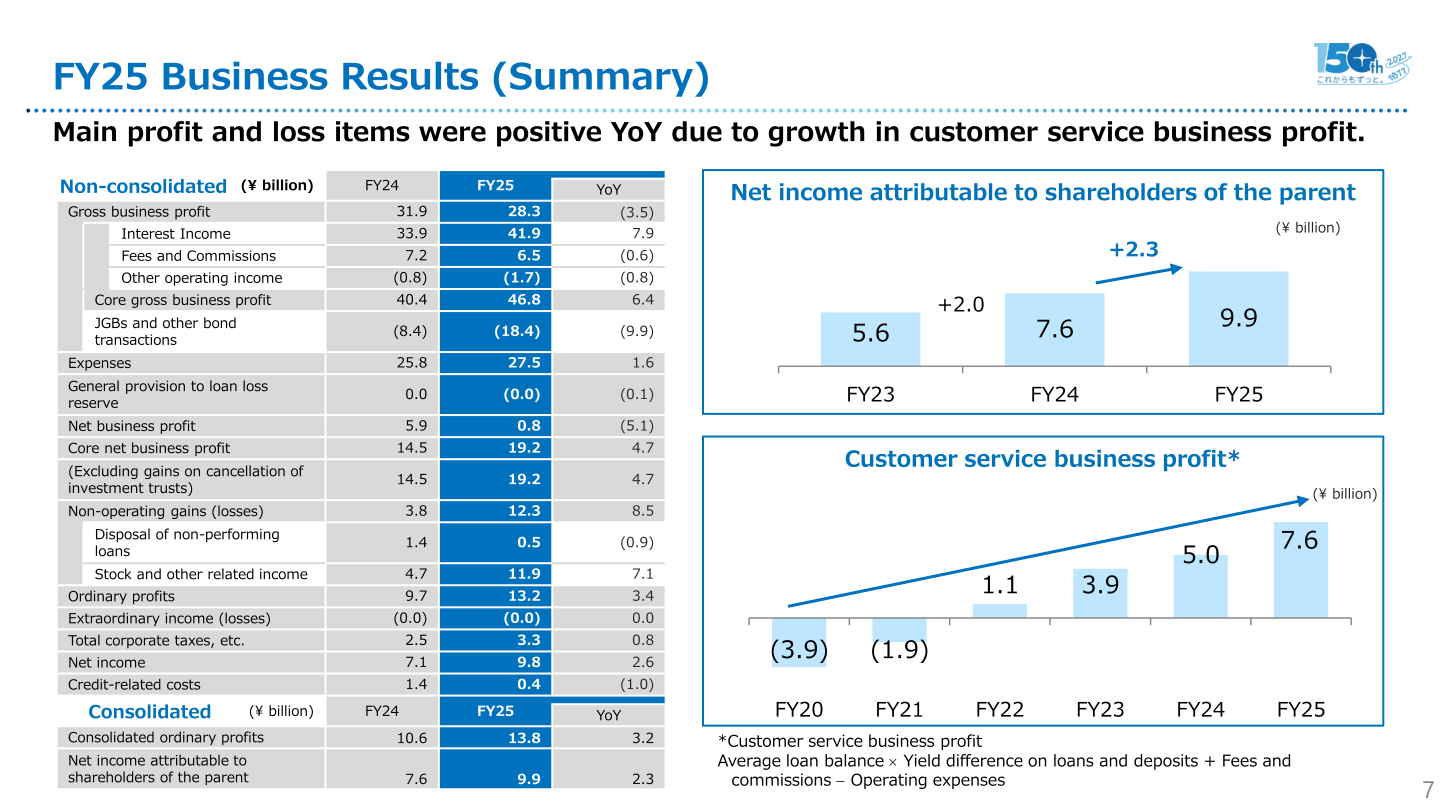
Full-year average deposits increased 144.9 billion yen (+3.9%) year on year to 3,798.7 billion yen, with deposits outside Yamanashi Prefecture up 20.8% to 519.7 billion yen; the Bank’s deposit share in Yamanashi Prefecture (term-end) rose 1.1 points to 52.8%. Full-year average loans increased 265.6 billion yen (+10.2%) to 2,863.4 billion yen, led by a 13.8% increase in loans outside Yamanashi Prefecture to 1,468.4 billion yen; the Bank’s loan share in Yamanashi Prefecture (term-end) rose 1.2 points to 52.7%.
| Deposits – Full-year average balance (¥ billion) | FY2024 | FY2025 | YoY (% change) |
|---|---|---|---|
| Deposits | 3,653.8 | 3,798.7 | +144.9 (+3.9%) |
| Yamanashi Pref. | 3,223.6 | 3,279.0 | +55.4 (+1.7%) |
| Outside Yamanashi Pref. | 430.2 | 519.7 | +89.5 (+20.8%) |
| Deposits share in Yamanashi Pref. (term-end) | 51.7% | 52.8% | +1.1 |
| Loans – Full-year average balance (¥ billion) | FY2024 | FY2025 | YoY (% change) |
|---|---|---|---|
| Loans | 2,597.8 | 2,863.4 | +265.6 (+10.2%) |
| Yamanashi Pref. | 1,105.1 | 1,167.9 | +62.8 (+5.6%) |
| Outside Yamanashi Pref. | 1,289.7 | 1,468.4 | +178.7 (+13.8%) |
| Loan assets under the control of the head office | 202.8 | 227.0 | +24.2 (+11.9%) |
| Share of loans in Yamanashi Pref. (term-end) | 51.5% | 52.7% | +1.2 |
Expenses, OHR and Credit-Related Costs
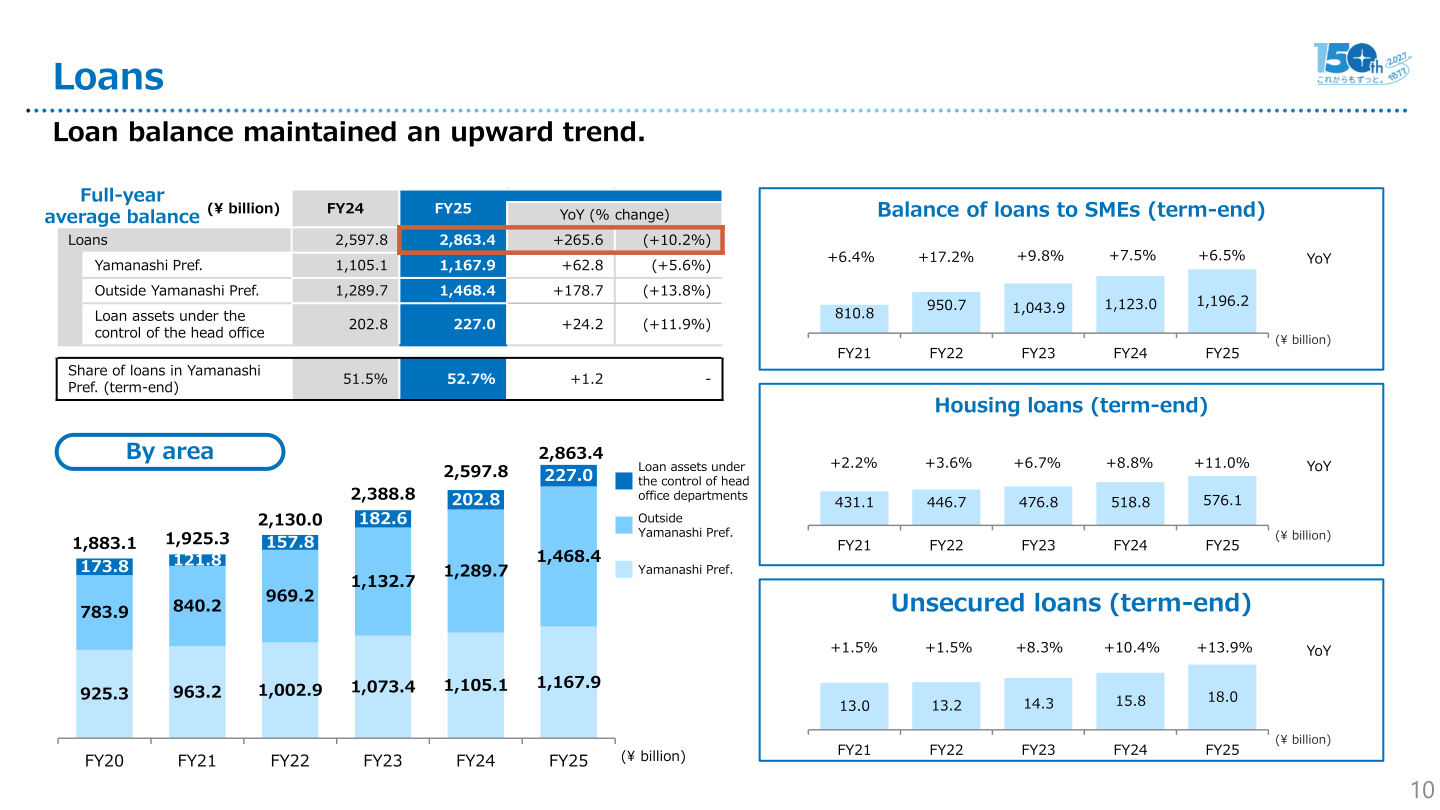
Expenses increased 1.6 billion yen year on year to 27.5 billion yen, reflecting a 0.7 billion yen increase in personnel costs (wage increases) and a 0.7 billion yen increase in premises and equipment costs (IT investments). OHR (Operating Expenses/Core Gross Business Profit) improved by (5.19) points to 58.83%. Credit-related costs decreased 1.0 billion yen year on year to 0.4 billion yen, and the credit cost ratio fell to 1.52bp from 5.62bp.
| Item (¥ billion) | FY2024 | FY2025 | YoY |
|---|---|---|---|
| Expenses | 25.8 | 27.5 | 1.6 |
| Personnel | 14.6 | 15.4 | 0.7 |
| Premises and equipment | 9.7 | 10.5 | 0.7 |
| Tax | 1.4 | 1.5 | 0.1 |
| OHR | 64.03% | 58.83% | (5.19)P |
| Credit-Related Costs | 1.4 | 0.4 | (1.0) |
| Credit cost ratio | 5.62bp | 1.52bp | (4.10)bp |
FY2026 Forecast
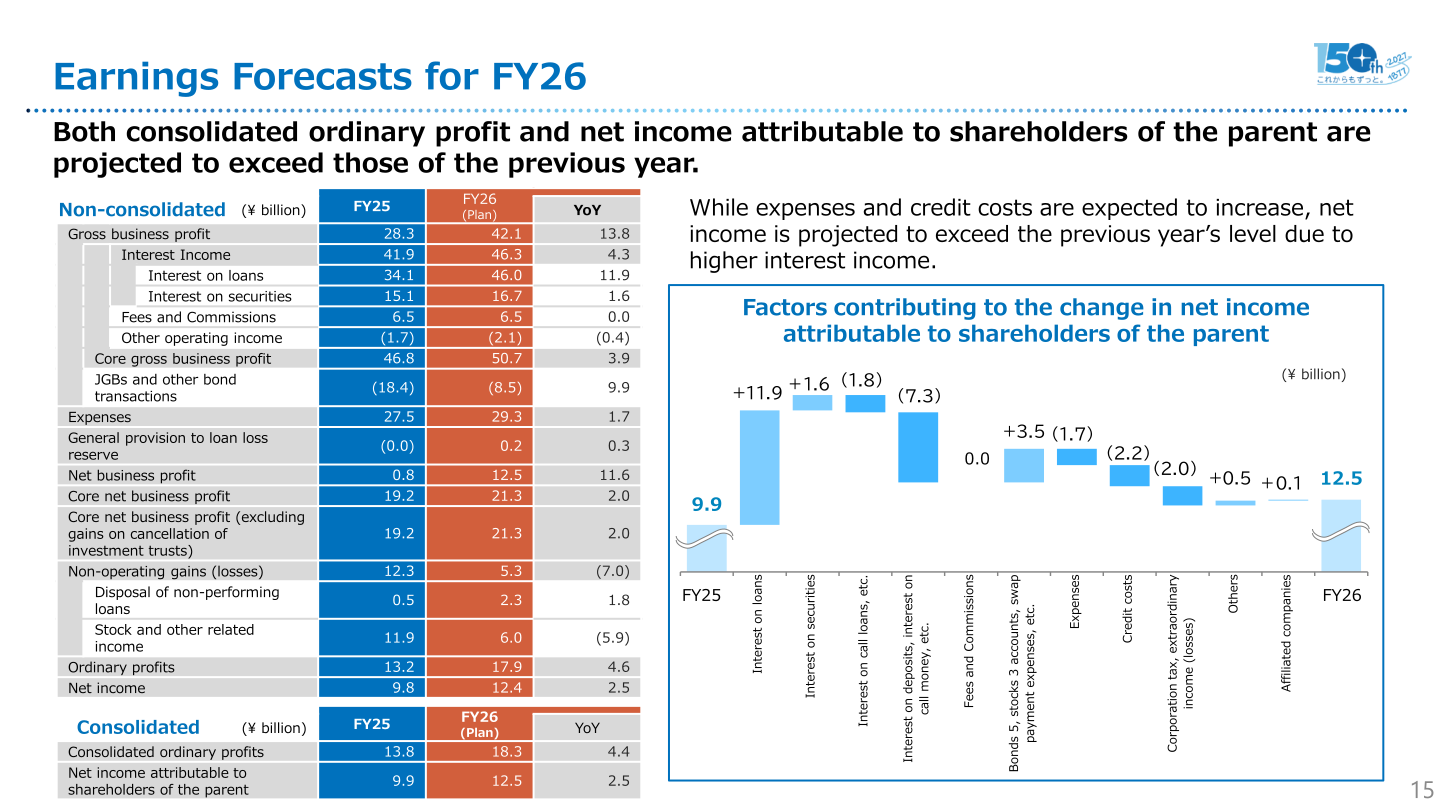
For FY2026, the Bank forecasts non-consolidated gross business profit of 42.1 billion yen, up 13.8 billion yen year on year, driven mainly by higher interest on loans. Core net business profit is forecast at 21.3 billion yen and ordinary profits at 17.9 billion yen. Non-consolidated net income is forecast to rise 2.5 billion yen to 12.4 billion yen, while consolidated net income attributable to shareholders of the parent is forecast at 12.5 billion yen and consolidated ordinary profits at 18.3 billion yen. The Bank’s disclosed factors behind the projected change in net income attributable to shareholders of the parent include +11.9 billion yen from interest on loans, +1.6 billion yen from interest on securities, and (7.3) billion yen from interest on deposits, interest on call money, etc.
| Item (Non-Consolidated, ¥ billion) | FY2025 | FY2026 (Plan) | YoY |
|---|---|---|---|
| Gross business profit | 28.3 | 42.1 | 13.8 |
| Interest Income | 41.9 | 46.3 | 4.3 |
| Interest on loans | 34.1 | 46.0 | 11.9 |
| Interest on securities | 15.1 | 16.7 | 1.6 |
| Fees and Commissions | 6.5 | 6.5 | 0.0 |
| Other operating income | (1.7) | (2.1) | (0.4) |
| Core gross business profit | 46.8 | 50.7 | 3.9 |
| JGBs and other bond transactions | (18.4) | (8.5) | 9.9 |
| Expenses | 27.5 | 29.3 | 1.7 |
| General provision to loan loss reserve | (0.0) | 0.2 | 0.3 |
| Net business profit | 0.8 | 12.5 | 11.6 |
| Core net business profit | 19.2 | 21.3 | 2.0 |
| Non-operating gains (losses) | 12.3 | 5.3 | (7.0) |
| Disposal of non-performing loans | 0.5 | 2.3 | 1.8 |
| Stock and other related income | 11.9 | 6.0 | (5.9) |
| Ordinary profits | 13.2 | 17.9 | 4.6 |
| Net income | 9.8 | 12.4 | 2.5 |
| Item (Consolidated, ¥ billion) | FY2025 | FY2026 (Plan) | YoY |
|---|---|---|---|
| Consolidated ordinary profits | 13.8 | 18.3 | 4.4 |
| Net income attributable to shareholders of the parent | 9.9 | 12.5 | 2.5 |
Medium-Term Management Plan “Value Creation Company: 1st Stage”
The Bank revised its FY2027 KPI targets upward under the Medium-Term Management Plan “Value Creation Company: 1st Stage.” According to the materials, the FY2025 results for consolidated ROE, net income attributable to shareholders of the parent, and OHR already achieved and exceeded the (revised) FY2027 targets. The Bank also moved forward the milestone in its long-term vision: it now targets a consolidated ROE of 8% or higher and net income attributable to shareholders of the parent of 20.0 billion yen or more by FY2030 (moved forward from FY2033), with an ROE of 10% or higher targeted for FY2033.
| Item | FY2025 (Results) | FY2027 (Target) | Note |
|---|---|---|---|
| Consolidated ROE | 4.48% | 5.8% or more | Revised upward |
| Net income attributable to shareholders of the parent | 9.9 billion yen | 14.0 billion yen or more | Revised upward |
| OHR | 58.83% | 58% or less | Revised upward |
| Consolidated regulatory capital ratio | 9.84% | 9% level |
Shareholder Returns
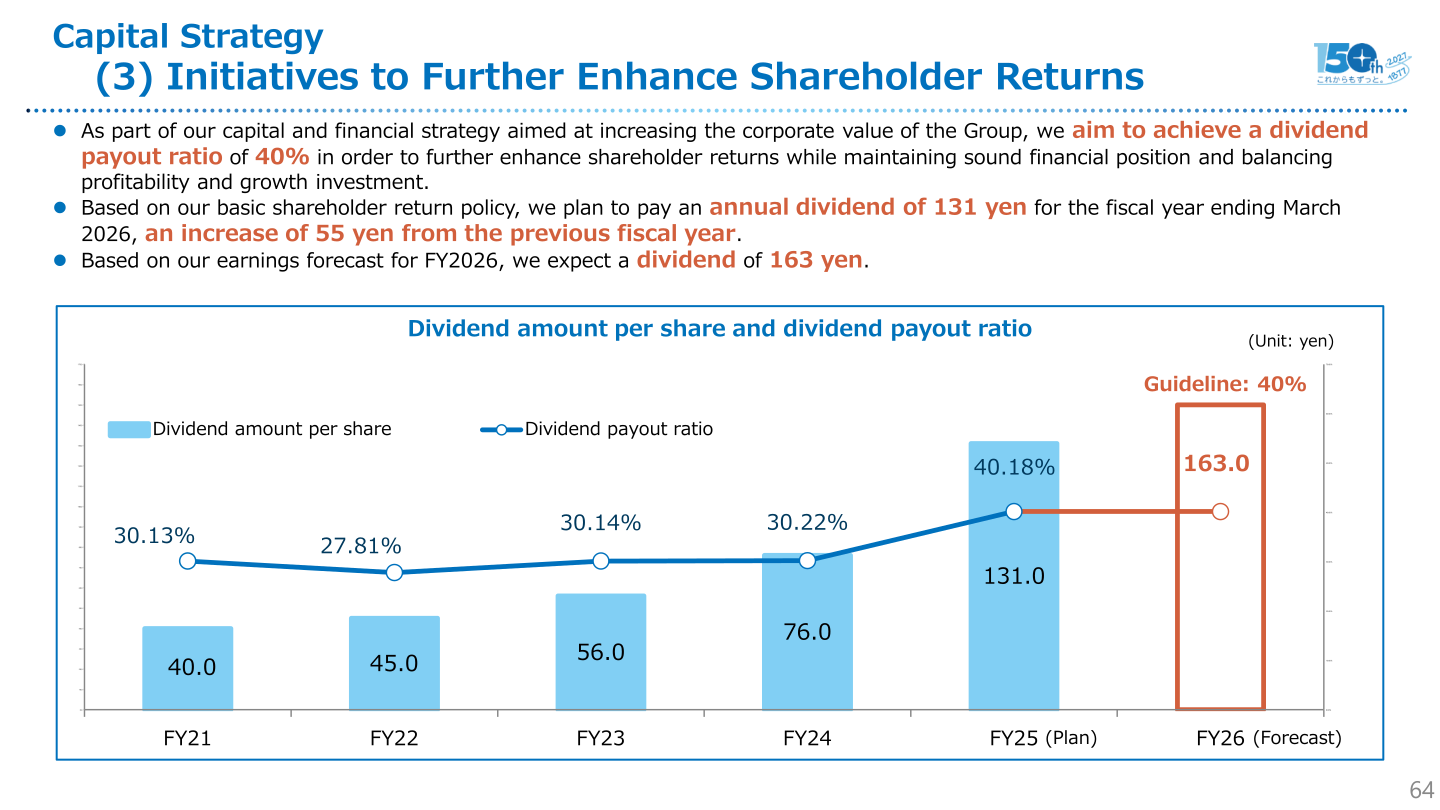
As part of its capital and financial strategy aimed at increasing the corporate value of the Group, the Bank aims to achieve a dividend payout ratio of 40%, and aims to maintain dividends at approximately 40% of net income attributable to shareholders of the parent. Based on its basic shareholder return policy, the Bank plans to pay an annual dividend of 131 yen for the fiscal year ending March 2026, an increase of 55 yen from the previous fiscal year, equivalent to a dividend payout ratio of 40.18%. Based on its earnings forecast for FY2026, the Bank expects a dividend of 163 yen. The Bank also stated that it will take a flexible and agile approach to the acquisition of its own shares.
| Item | FY2023 | FY2024 | FY2025 (Plan) | FY2026 (Forecast) |
|---|---|---|---|---|
| Dividend amount per share (yen) | 56.0 | 76.0 | 131.0 | 163.0 |
| Dividend payout ratio | 30.14% | 30.22% | 40.18% | — |
This article is an analysis based on publicly available information and is not a recommendation to buy or sell any specific securities. Investment decisions are your own responsibility.
















