
This article is based on publicly available IR materials and is not a recommendation to buy or sell any specific securities.
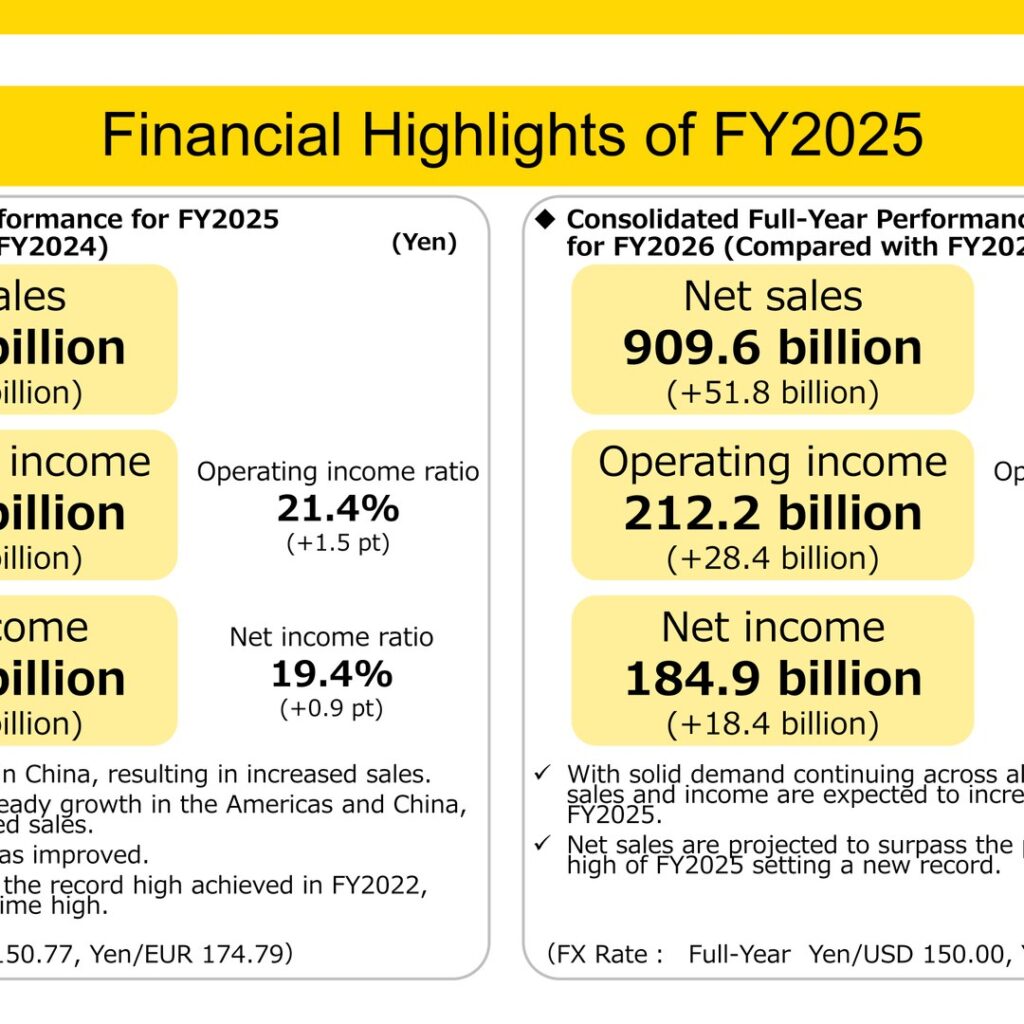
FANUC CORPORATION reported consolidated results for the fiscal year ended March 31, 2026 (FY2025), with net sales of ¥857.8 billion (+¥60.7 billion year on year), operating income of ¥183.8 billion (+¥24.9 billion), and net income of ¥166.5 billion (+¥19.0 billion). Net sales exceeded the previous all-time high recorded in FY2022, setting a new record. The company cited increased FA sales in China, steady growth in Robot sales in the Americas and China, and improved factory operation as the main drivers.
Consolidated Results (Full-Year Actual)
Operating income ratio was 21.4% (+1.5 pt year on year) and net income ratio was 19.4% (+0.9 pt). Results also exceeded the company’s previous forecast, with net sales +2.0%, operating income +6.3%, and net income +5.4% above the prior guidance. The average FX rate for FY2025 was ¥150.77/USD and ¥174.79/EUR. In the breakdown of the operating income change from FY2024 (¥158.8 billion) to FY2025 (¥183.8 billion), the change in revenue contributed +¥25.8 billion and the change in cost variance contributed +¥13.2 billion, while the effects of unrealized profit (-¥5.7 billion), the change in SG&A expenses (-¥6.3 billion), and other factors (-¥2.0 billion) were negative.
| Item | FY2024 Actual | FY2025 Actual | Change from FY2024 |
|---|---|---|---|
| Net sales | 797.1 billion yen (100.0%) | 857.8 billion yen (100.0%) | +7.6% |
| Cost of sales | 502.2 billion yen (63.0%) | 529.4 billion yen (61.7%) | +5.4% |
| Operating income | 158.8 billion yen (19.9%) | 183.8 billion yen (21.4%) | +15.7% |
| Ordinary income | 196.7 billion yen (24.7%) | 227.5 billion yen (26.5%) | +15.6% |
| Net income | 147.6 billion yen (18.5%) | 166.5 billion yen (19.4%) | +12.9% |
Segment Results
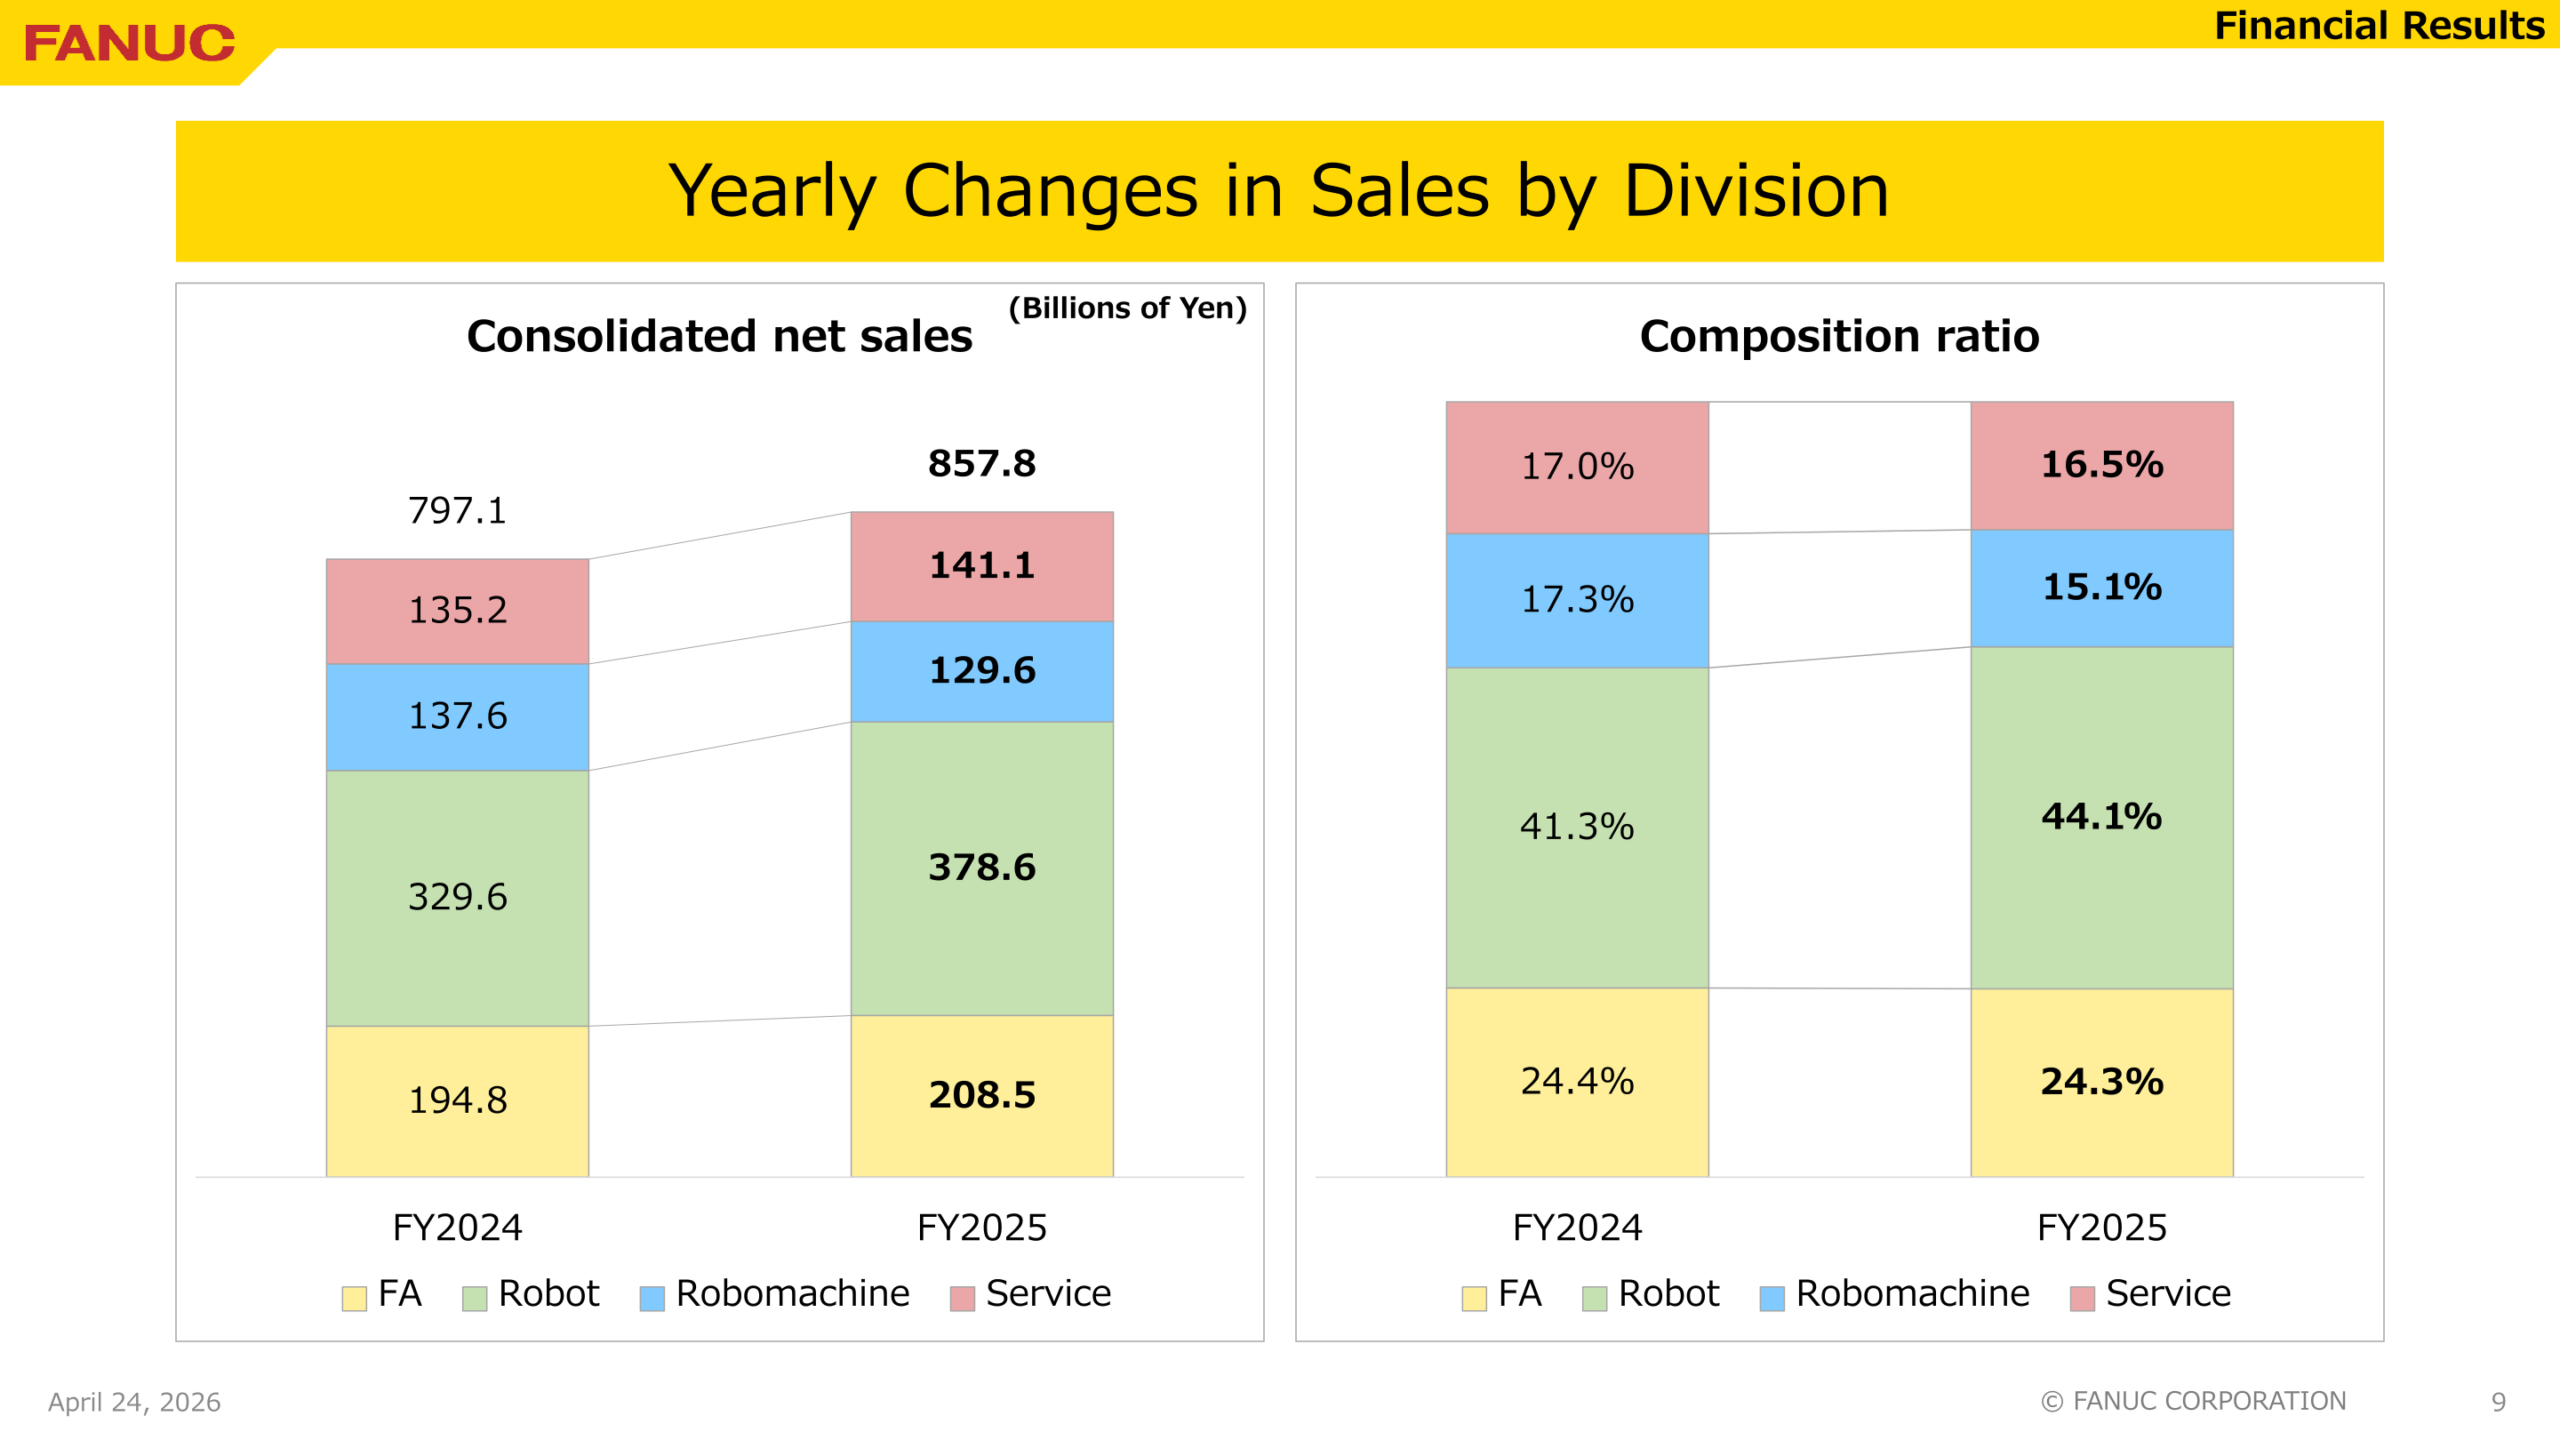
By division, Robot net sales rose from ¥329.6 billion to ¥378.6 billion, driven by steady growth in the Americas and China, and accounted for 44.1% of FY2025 net sales. FA net sales increased from ¥194.8 billion to ¥208.5 billion (24.3% of net sales), supported by growth in China. Service net sales grew from ¥135.2 billion to ¥141.1 billion (16.5%), while Robomachine net sales declined from ¥137.6 billion to ¥129.6 billion (15.1%). By region, net sales in China increased from ¥186.6 billion to ¥228.4 billion and in the Americas from ¥214.3 billion to ¥232.2 billion; Europe grew from ¥142.7 billion to ¥152.4 billion and Japan from ¥109.2 billion to ¥110.8 billion, while sales in Asia (excluding China) declined from ¥135.1 billion to ¥124.2 billion.
| Segment | FY2024 Net Sales | FY2025 Net Sales | FY2025 Composition Ratio |
|---|---|---|---|
| FA | 194.8 billion yen | 208.5 billion yen | 24.3% |
| Robot | 329.6 billion yen | 378.6 billion yen | 44.1% |
| Robomachine | 137.6 billion yen | 129.6 billion yen | 15.1% |
| Service | 135.2 billion yen | 141.1 billion yen | 16.5% |
| Total | 797.1 billion yen | 857.8 billion yen | 100.0% |
FY2026 Forecast
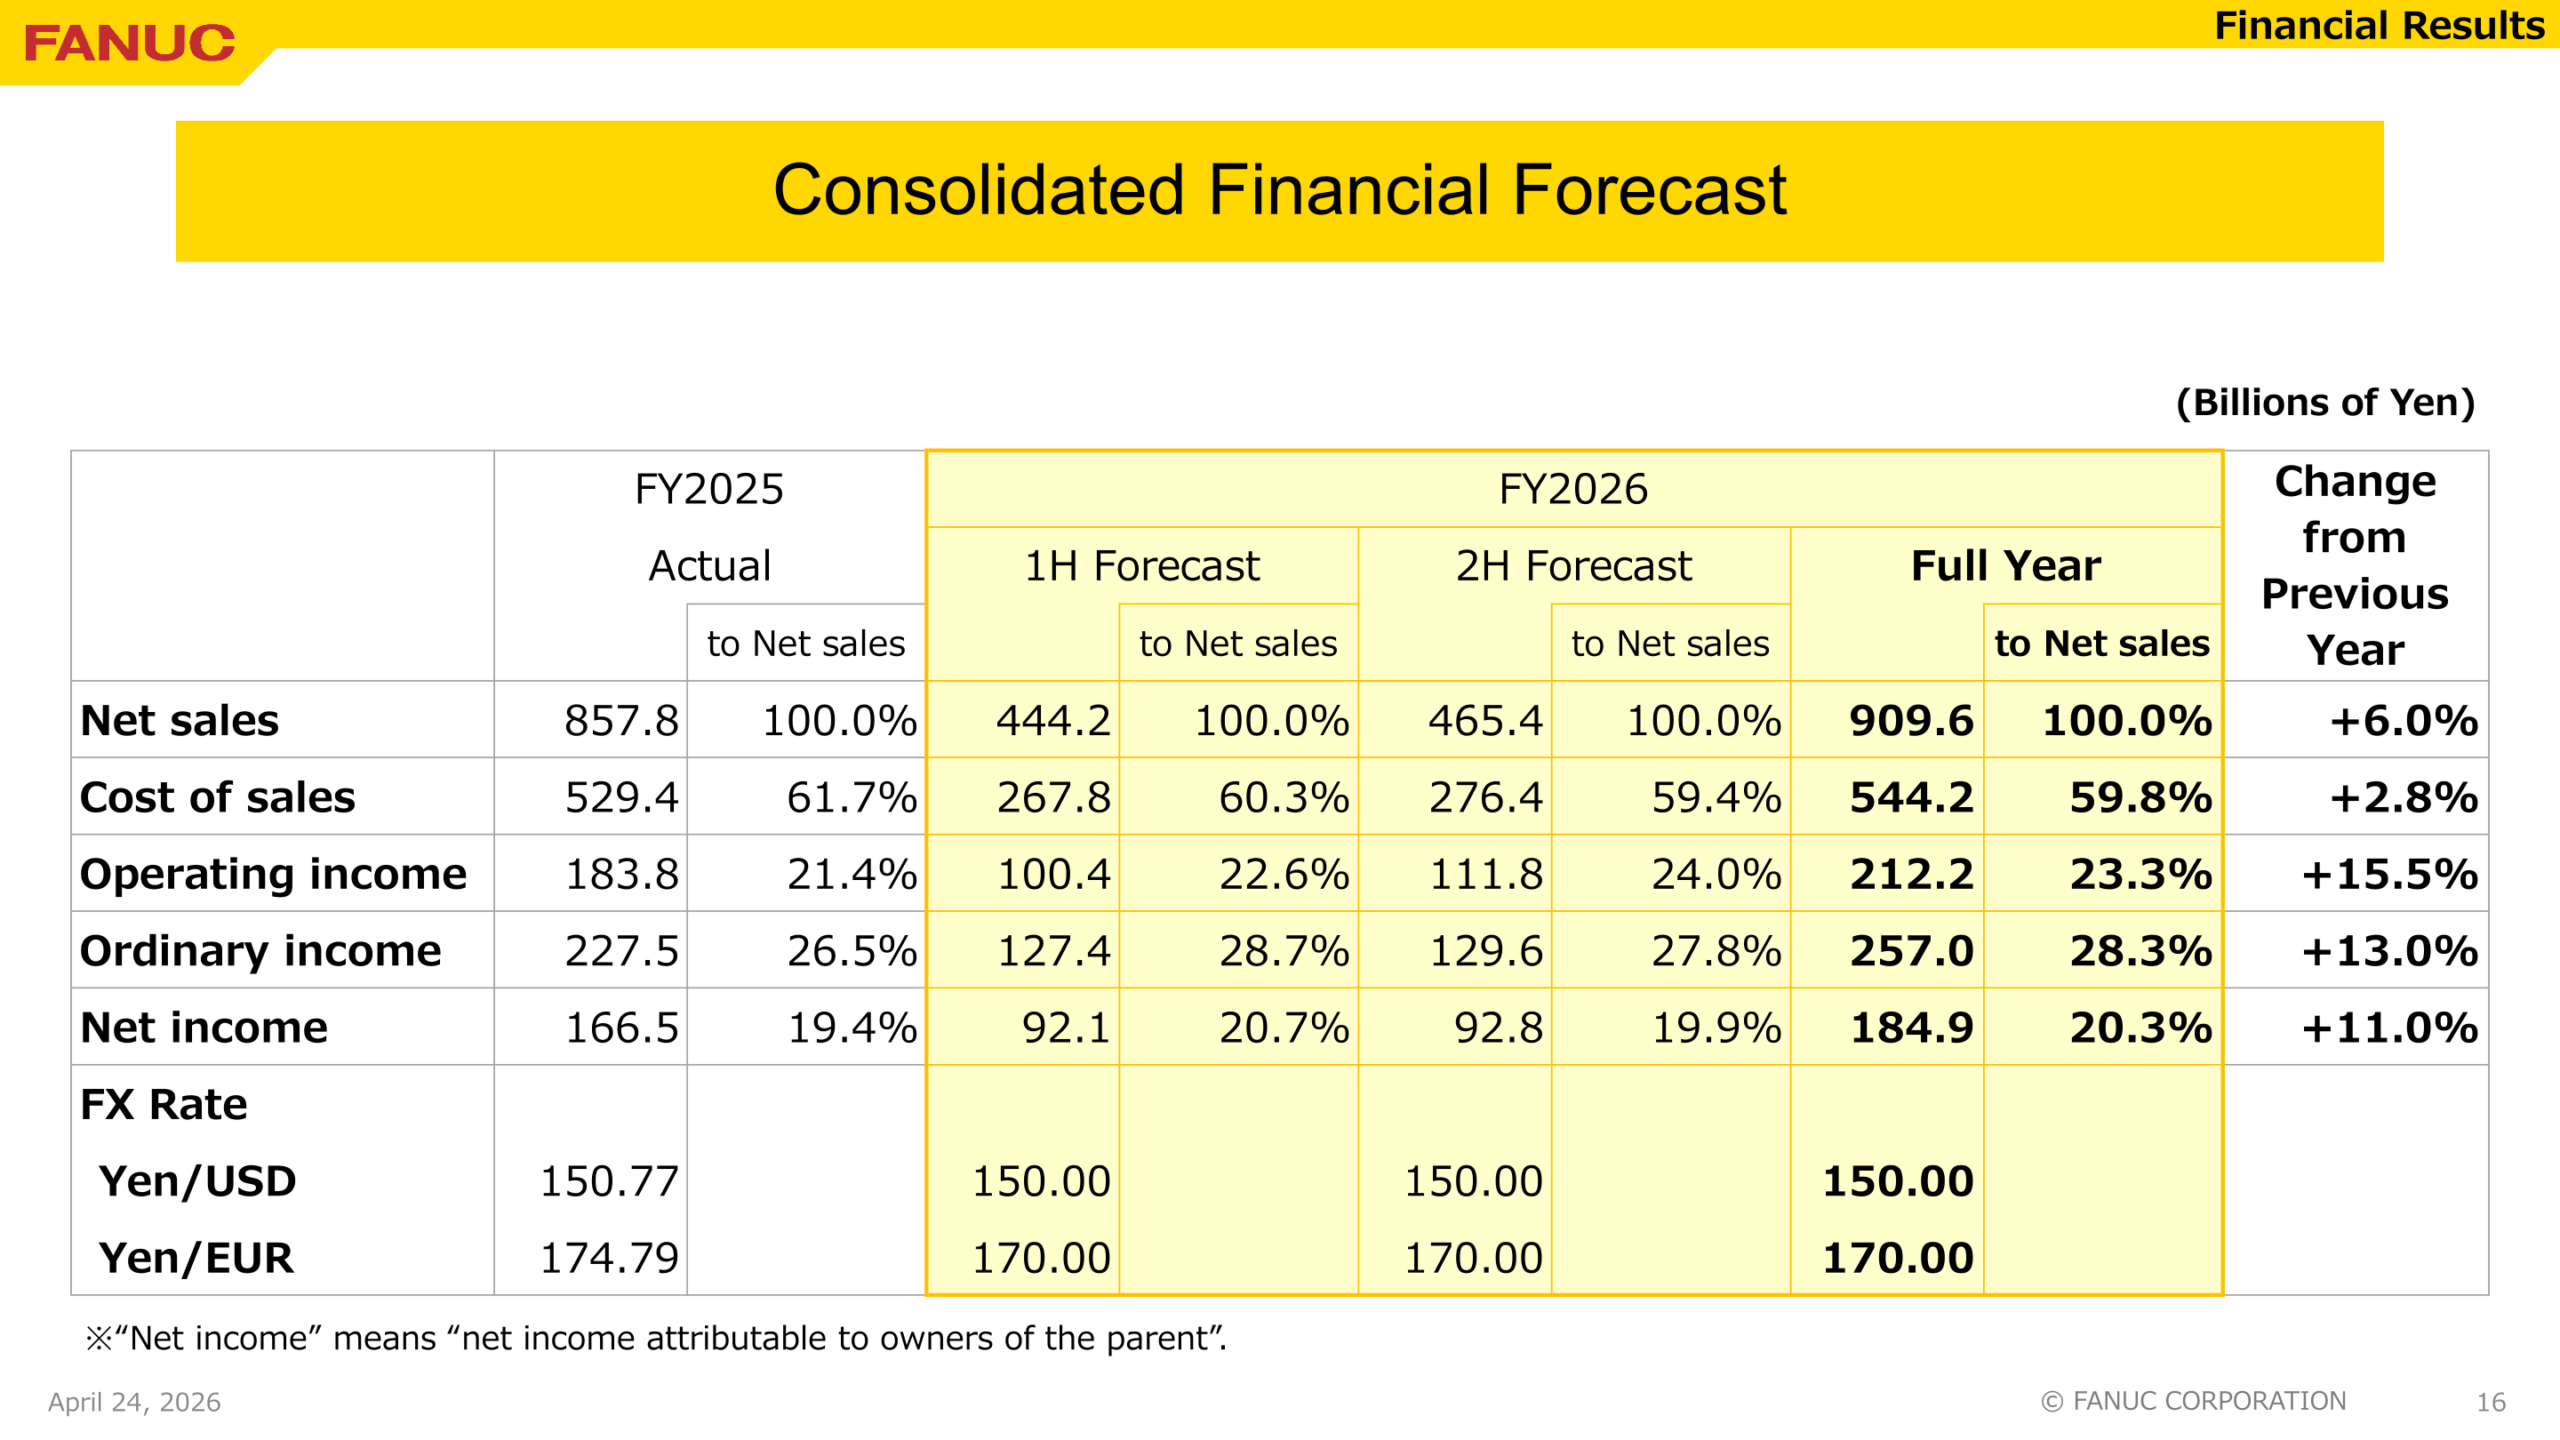
For FY2026, FANUC forecasts net sales of ¥909.6 billion (+6.0% year on year), operating income of ¥212.2 billion (+15.5%), ordinary income of ¥257.0 billion (+13.0%), and net income of ¥184.9 billion (+11.0%), with operating income ratio of 23.3% (+1.9 pt) and net income ratio of 20.3% (+0.9 pt). By half, 1H forecast is net sales of ¥444.2 billion and operating income of ¥100.4 billion, and 2H forecast is net sales of ¥465.4 billion and operating income of ¥111.8 billion. The forecast assumes FX rates of ¥150.00/USD and ¥170.00/EUR for the full year. With solid demand continuing across all product lines, the company expects both sales and income to increase, and projects net sales to surpass the FY2025 record and set a new all-time high.
| Item | FY2025 Actual | FY2026 Full-Year Forecast | Change from Previous Year |
|---|---|---|---|
| Net sales | 857.8 billion yen (100.0%) | 909.6 billion yen (100.0%) | +6.0% |
| Cost of sales | 529.4 billion yen (61.7%) | 544.2 billion yen (59.8%) | +2.8% |
| Operating income | 183.8 billion yen (21.4%) | 212.2 billion yen (23.3%) | +15.5% |
| Ordinary income | 227.5 billion yen (26.5%) | 257.0 billion yen (28.3%) | +13.0% |
| Net income | 166.5 billion yen (19.4%) | 184.9 billion yen (20.3%) | +11.0% |
Shareholder Returns
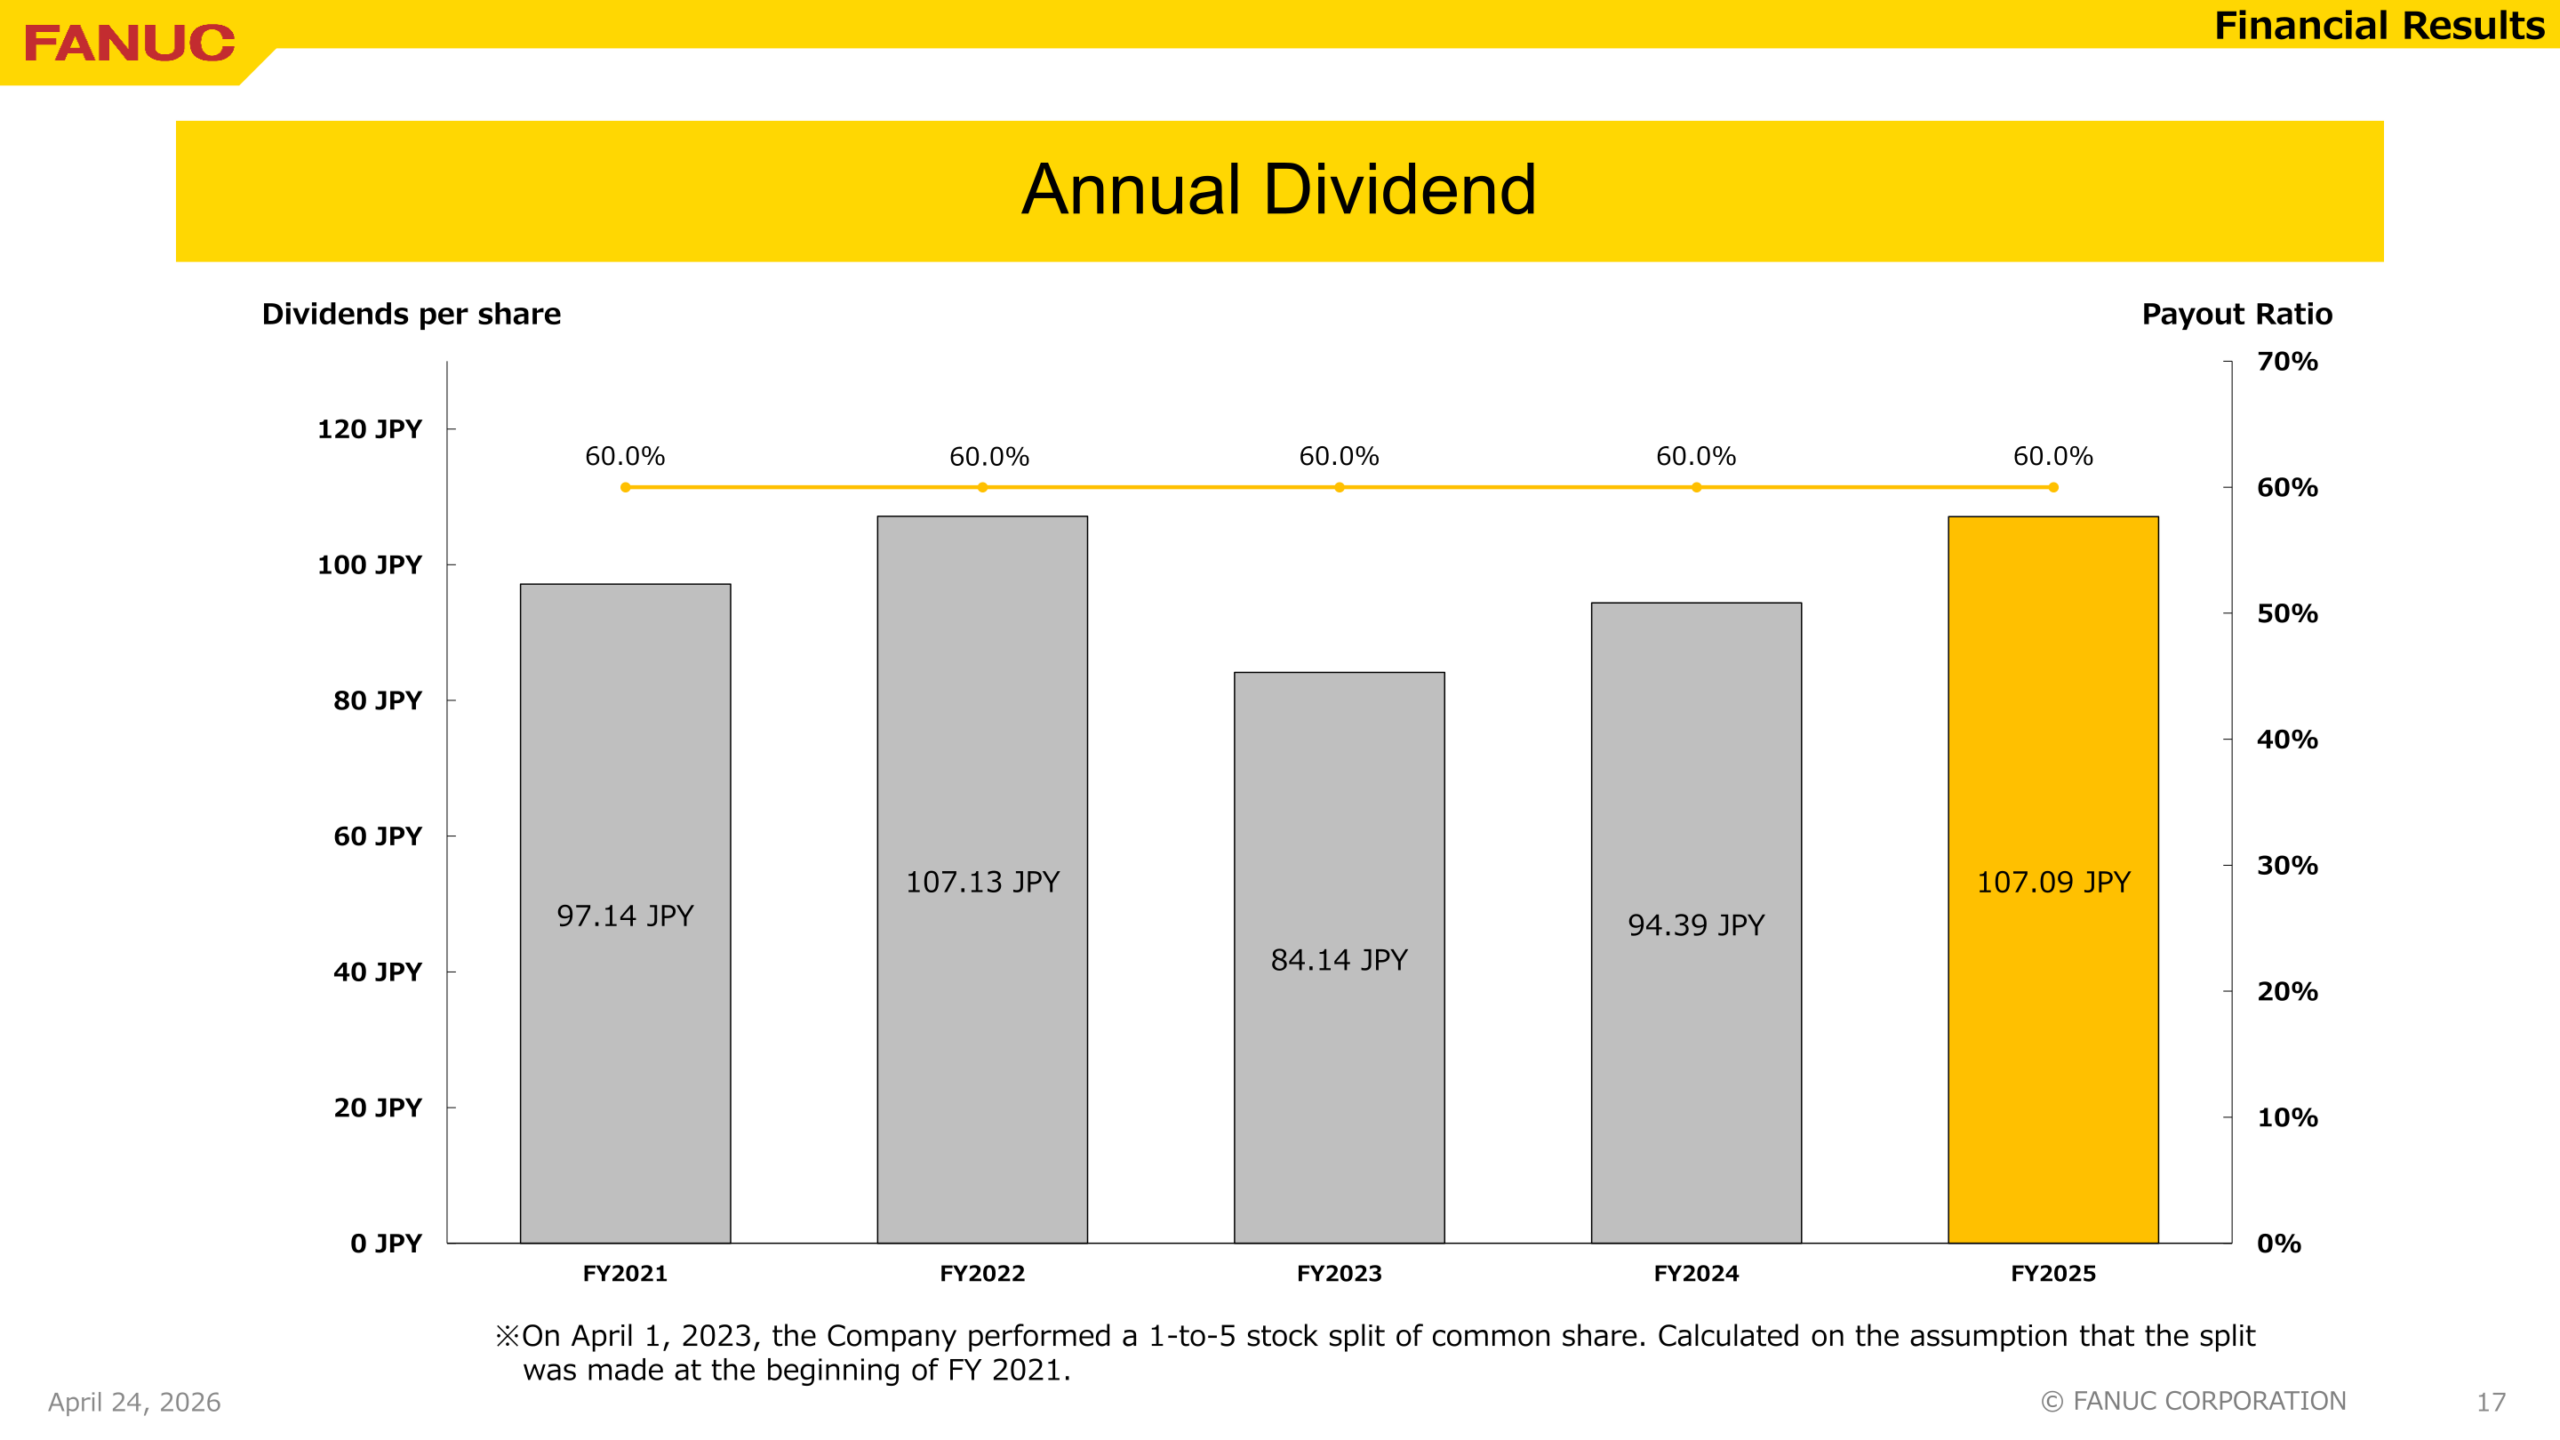
FANUC’s FY2025 annual dividend per share was ¥107.09, with a payout ratio of 60.0%, up from ¥94.39 per share (60.0% payout ratio) in FY2024. The payout ratio has been maintained at 60.0% in each of the past five fiscal years (FY2021–FY2025). Dividend-per-share figures are calculated on the assumption that the 1-for-5 stock split of common shares performed on April 1, 2023 had been made at the beginning of FY2021.
| Item | FY2021 | FY2022 | FY2023 | FY2024 | FY2025 |
|---|---|---|---|---|---|
| Dividend per share | 97.14 JPY | 107.13 JPY | 84.14 JPY | 94.39 JPY | 107.09 JPY |
| Payout ratio | 60.0% | 60.0% | 60.0% | 60.0% | 60.0% |
Topics
FANUC participated in two major trade shows in early FY2026: TMTS 2026 in Taiwan (March 25–28, 2026; 407 exhibitors versus 631 in 2024; approximately 72,000 visitors), where it exhibited ROBODRILL and ROBOCUT with automation packages, and SIMTOS 2026 in Seoul (April 13–17, 2026; 1,315 exhibitors), where it showcased its open platform Physical AI, the CRX-3iA collaborative welding robot, and the 500i-A and αi-D servo, along with digital twin and AI-based manufacturing technologies.
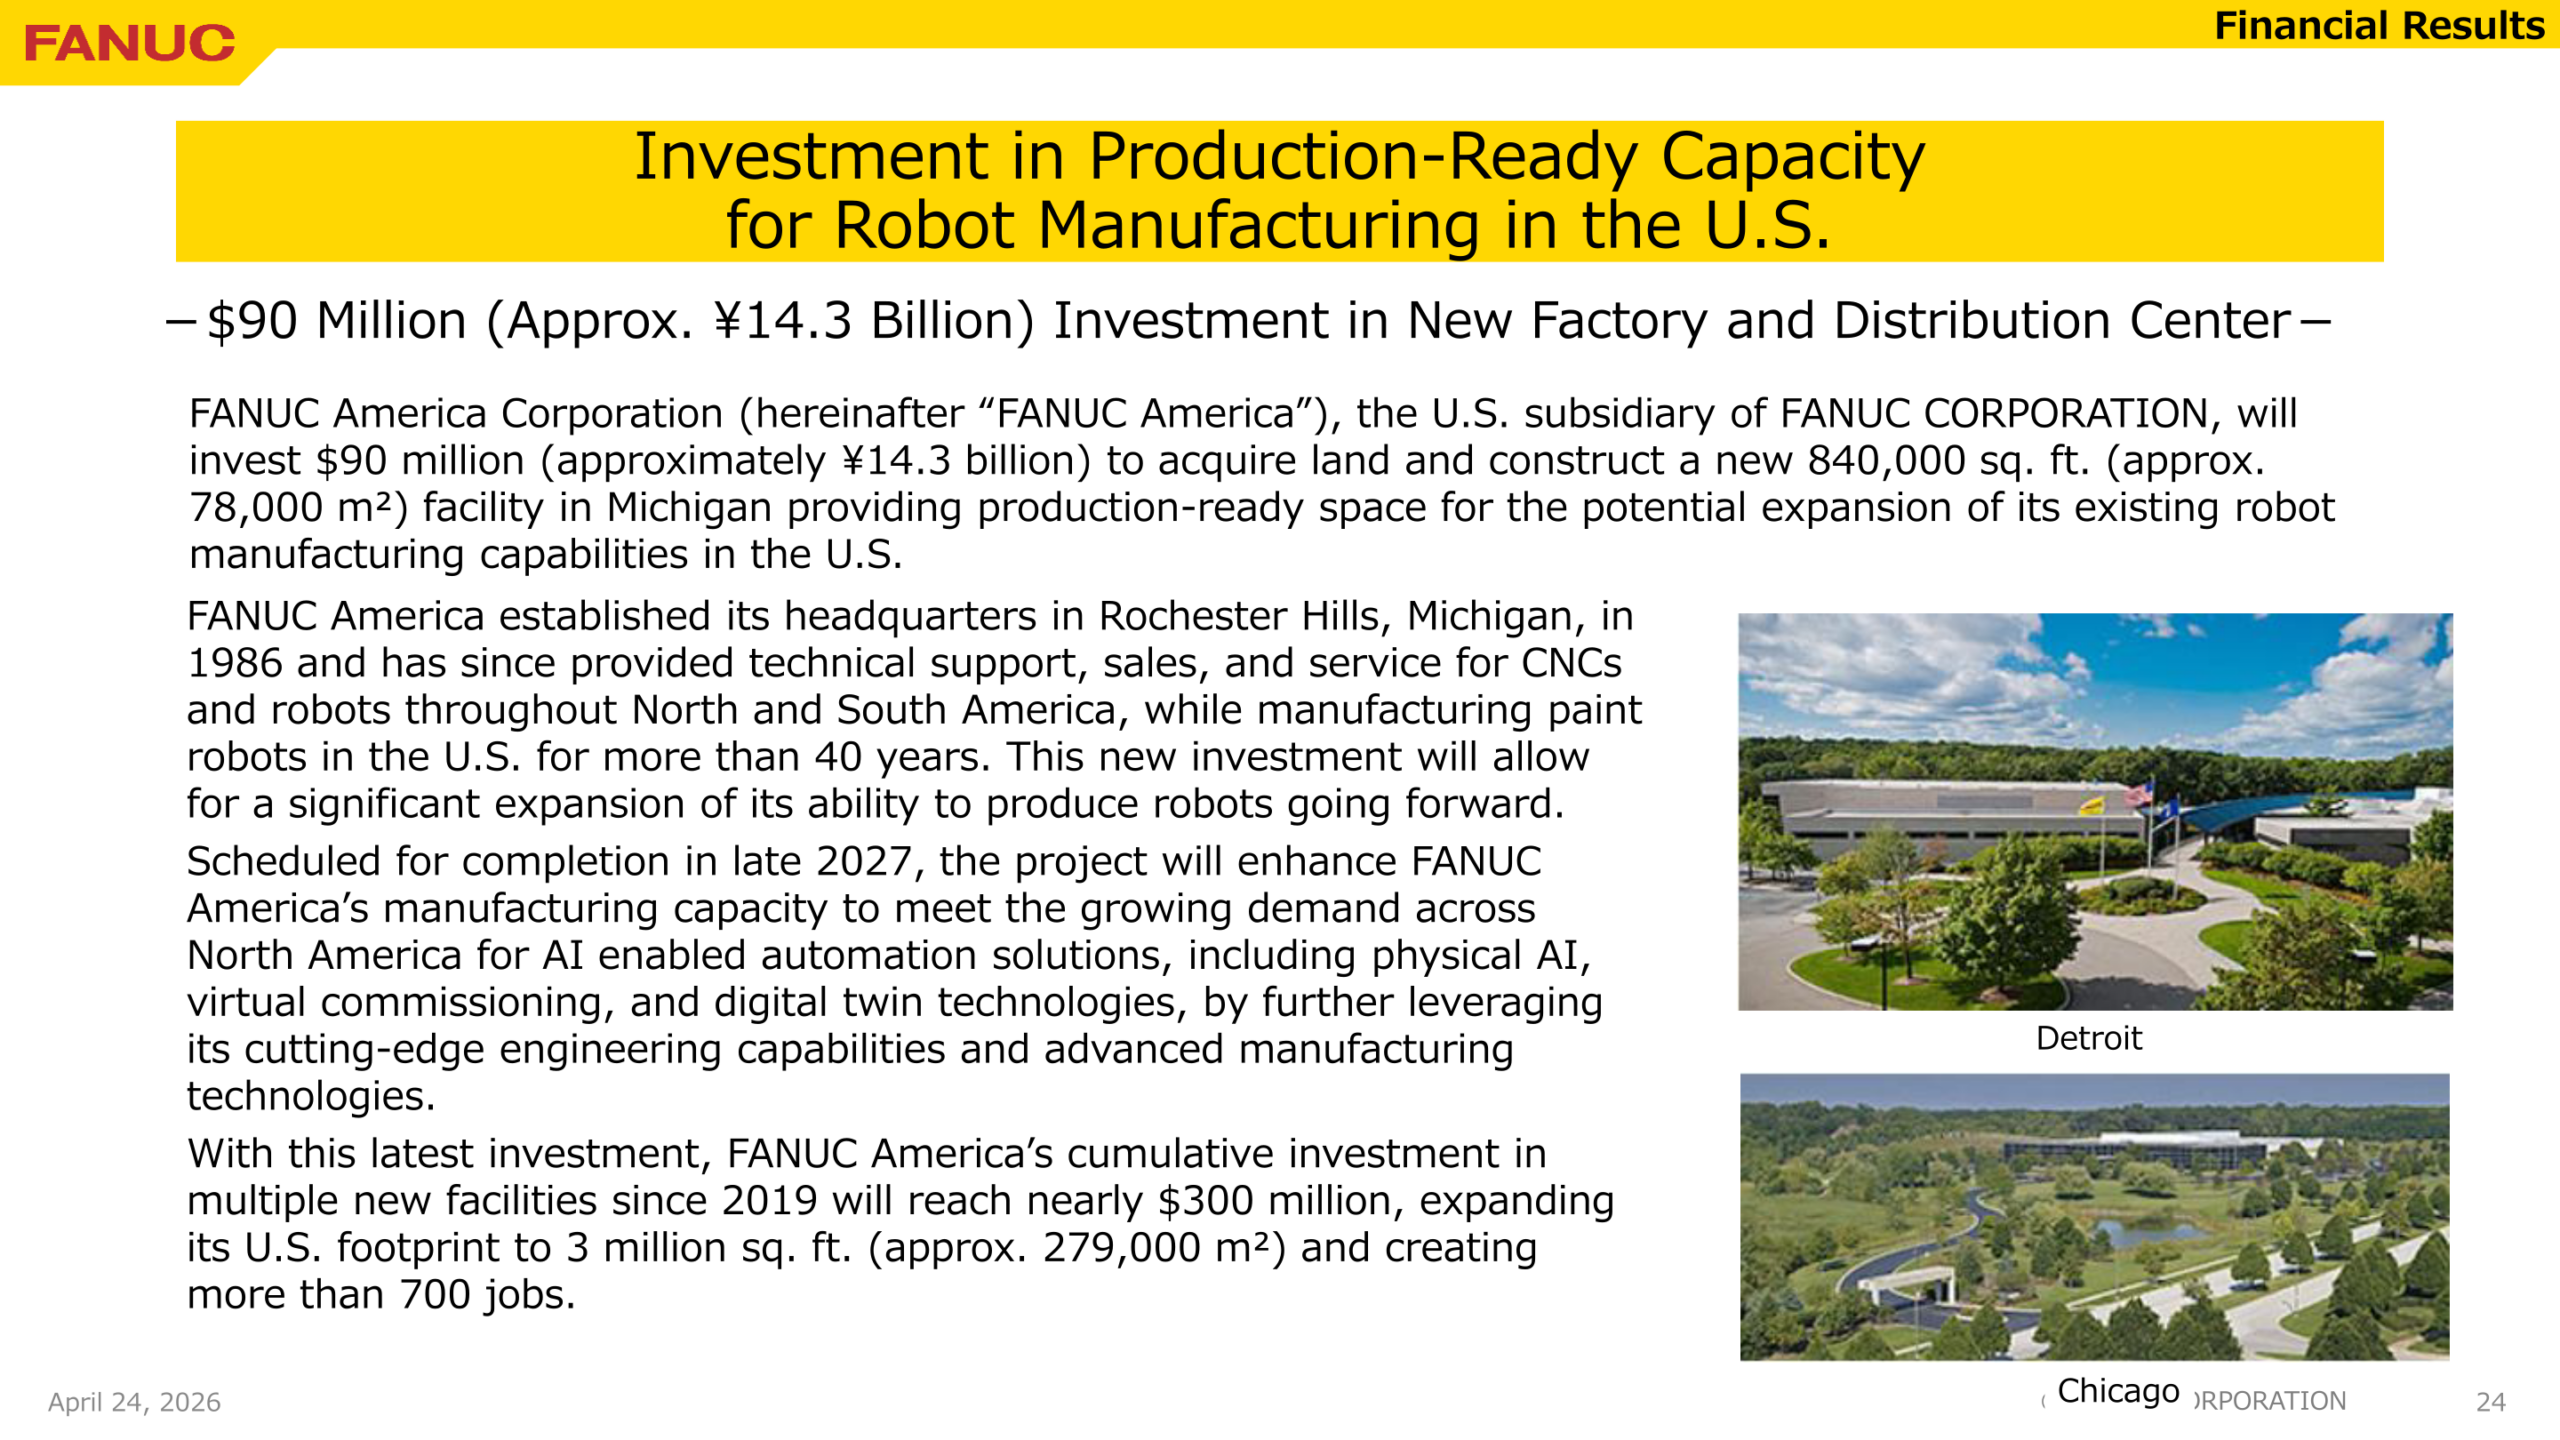
On the facilities side, FANUC completed the Central Technical Center at its headquarters, renewing the guest area including a new office building for customer demonstrations and testing. FANUC India completed a new 5,000 m² service building in Bangalore in March 2026, supporting more than 320,000 cumulatively installed units through 23 service locations and 5 repair centers. FANUC America will invest $90 million (approximately ¥14.3 billion) to acquire land and build a new 840,000 sq. ft. (approx. 78,000 m²) facility in Michigan for production-ready robot manufacturing capacity, scheduled for completion in late 2027; including this investment, FANUC America’s cumulative investment in new U.S. facilities since 2019 will reach nearly $300 million, expanding its U.S. footprint to 3 million sq. ft. (approx. 279,000 m²) and creating more than 700 jobs.
This article is an analysis based on publicly available information and is not a recommendation to buy or sell any specific securities. Investment decisions are your own responsibility.
![[Obayashi] Investors’ Guide 2026 — The Complete 24-Article Breakdown](https://japan-equity.com/wp-content/uploads/2026/07/hub_cover-1024x1024.png)
![[Obayashi] IR & SR Policy — Feeding Dialogue Back into Management](https://japan-equity.com/wp-content/uploads/2026/07/p32_sq-1024x1024.jpg)
![[Obayashi] Real Estate Development — 18.7% Margin, ¥287.7bn Unrealized Gains](https://japan-equity.com/wp-content/uploads/2026/07/p20_sq-1024x1024.jpg)
![[Obayashi] Domestic Civil Engineering — Resilience Spending Supports 9.6% Margin](https://japan-equity.com/wp-content/uploads/2026/07/p11_sq-1024x1024.jpg)
![[Obayashi] Share Price & External Ratings — vs TOPIX, ESG Index Inclusion](https://japan-equity.com/wp-content/uploads/2026/07/p40_sq-1024x1024.jpg)
![[Construction] ¥75.5tn Investment, Shrinking Workforce — Big-5 Market Share](https://japan-equity.com/wp-content/uploads/2026/07/p12_sq-1024x1024.jpg)



![[Obayashi] Capital Policy & Shareholder Returns — ROE 10%+, DOE ~5%, ¥100bn Buyback](https://japan-equity.com/wp-content/uploads/2026/07/p27_sq-1024x1024.jpg)
![[Obayashi] Reducing Cross-Shareholdings — ¥285.2bn Sold in Five Years](https://japan-equity.com/wp-content/uploads/2026/07/p29_sq-1024x1024.jpg)
![[Obayashi] ¥750bn Investment Plan — ¥300bn to Development, ¥190bn to Tech/DX](https://japan-equity.com/wp-content/uploads/2026/07/p30_sq-1024x1024.jpg)
![[Obayashi] MTP2022 KPIs — Operating Profit ~2x Target, ROE 14.4%](https://japan-equity.com/wp-content/uploads/2026/07/p25_sq-1024x1024.jpg)
![[Obayashi] Cash Allocation — ¥420bn Investment CF Over Five Years](https://japan-equity.com/wp-content/uploads/2026/07/p26_sq-1024x1024.jpg)
![[Obayashi] Green Energy — 44 Plants, 344MW, and the Green Hydrogen Challenge](https://japan-equity.com/wp-content/uploads/2026/07/p21_sq-1024x1024.jpg)
![[Obayashi] Tackling the Labor Shortage — Robotics Construction®](https://japan-equity.com/wp-content/uploads/2026/07/p14_sq-1024x1024.jpg)
