
This article is based on publicly available IR materials and is not a recommendation to buy or sell any specific securities.
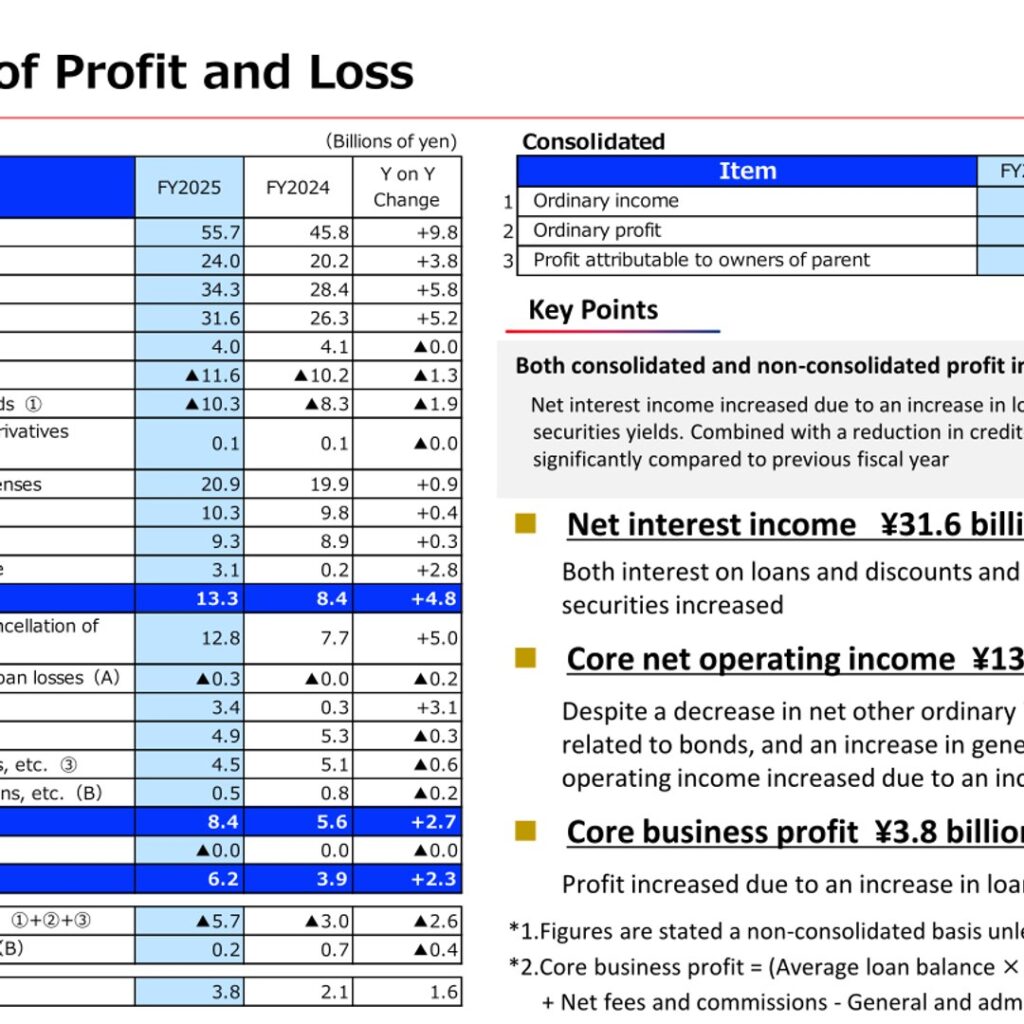
The Yamagata Bank, Ltd. reported a sharp increase in profit for the fiscal year ended March 31, 2026 (FY2025), driven by higher net interest income and lower credit-related expenses. On a non-consolidated basis, profit rose to ¥6.2 billion (+¥2.3 billion), while on a consolidated basis profit attributable to owners of parent increased to ¥6.5 billion (+¥2.1 billion). Core net operating income increased to ¥13.3 billion (+¥4.8 billion), and core business profit rose to ¥3.8 billion (+¥1.6 billion). For FY2026, the Bank forecasts further increases in ordinary income and profit on both a non-consolidated and consolidated basis.
Consolidated Results (Full-Year Actual)
Both consolidated and non-consolidated profit increased significantly compared to the previous fiscal year. Net interest income increased due to an increase in loan balances and improvement in securities yields. Combined with a reduction in credit-related expenses, profit increased significantly compared to the previous fiscal year. On a consolidated basis, ordinary income was ¥63.3 billion (+¥10.4 billion), ordinary profit was ¥9.0 billion (+¥2.5 billion), and profit attributable to owners of parent was ¥6.5 billion (+¥2.1 billion).
| Item | FY2025 | FY2024 | Y on Y Change |
|---|---|---|---|
| Ordinary income | 55.7 | 45.8 | +9.8 |
| Gross operating income | 24.0 | 20.2 | +3.8 |
| Core gross operating income | 34.3 | 28.4 | +5.8 |
| Net interest income | 31.6 | 26.3 | +5.2 |
| Net fees and commissions | 4.0 | 4.1 | ▲0.0 |
| Net other ordinary income | ▲11.6 | ▲10.2 | ▲1.3 |
| General and administrative expenses | 20.9 | 19.9 | +0.9 |
| Substantial net operating income | 3.1 | 0.2 | +2.8 |
| Core net operating income | 13.3 | 8.4 | +4.8 |
| Excluding gains (losses) on cancellation of investment trusts | 12.8 | 7.7 | +5.0 |
| Net operating income | 3.4 | 0.3 | +3.1 |
| Ordinary profit | 8.4 | 5.6 | +2.7 |
| Profit | 6.2 | 3.9 | +2.3 |
| Credit-related expenses (A)+(B) | 0.2 | 0.7 | ▲0.4 |
| Core business profit | 3.8 | 2.1 | 1.6 |
Segment Results
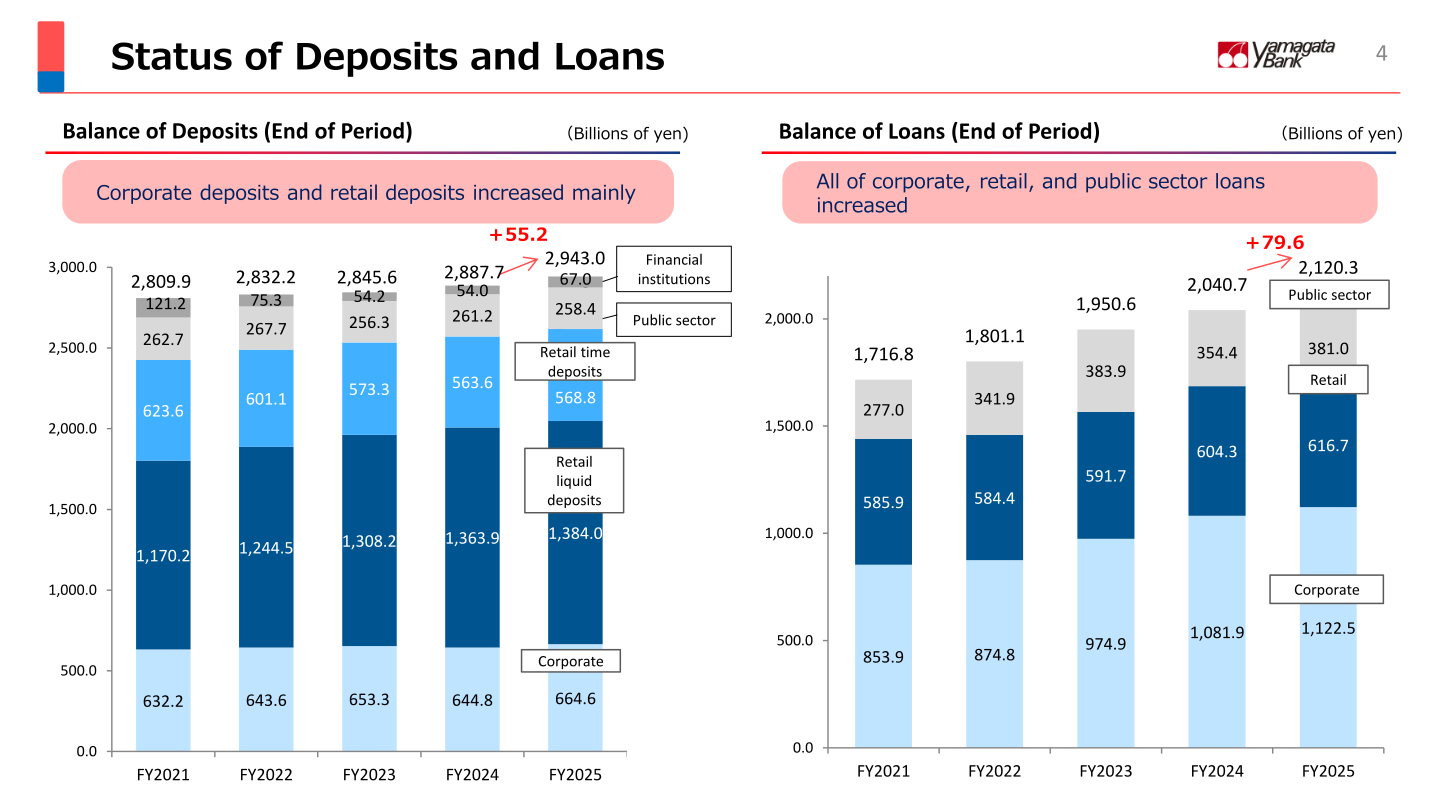
Loan balances increased across corporate, retail, and public-sector categories, while corporate deposits and retail deposits increased mainly. Total loans reached ¥2,120.3 billion (+¥79.6 billion) and total deposits reached ¥2,943.0 billion (+¥55.2 billion) at the end of FY2025.
| Category | FY2025 (Billions of yen) | FY2024 (Billions of yen) |
|---|---|---|
| Loans – Corporate | 1,122.5 | 1,081.9 |
| Loans – Retail | 616.7 | 604.3 |
| Loans – Public sector | 381.0 | 354.4 |
| Loans – Total | 2,120.3 | 2,040.7 |
| Deposits – Corporate | 664.6 | 644.8 |
| Deposits – Retail liquid deposits | 1,384.0 | 1,363.9 |
| Deposits – Retail time deposits | 568.8 | 563.6 |
| Deposits – Public sector | 258.4 | 261.2 |
| Deposits – Financial institutions | 67.0 | 54.0 |
| Deposits – Total | 2,943.0 | 2,887.7 |
FY2026 Forecast
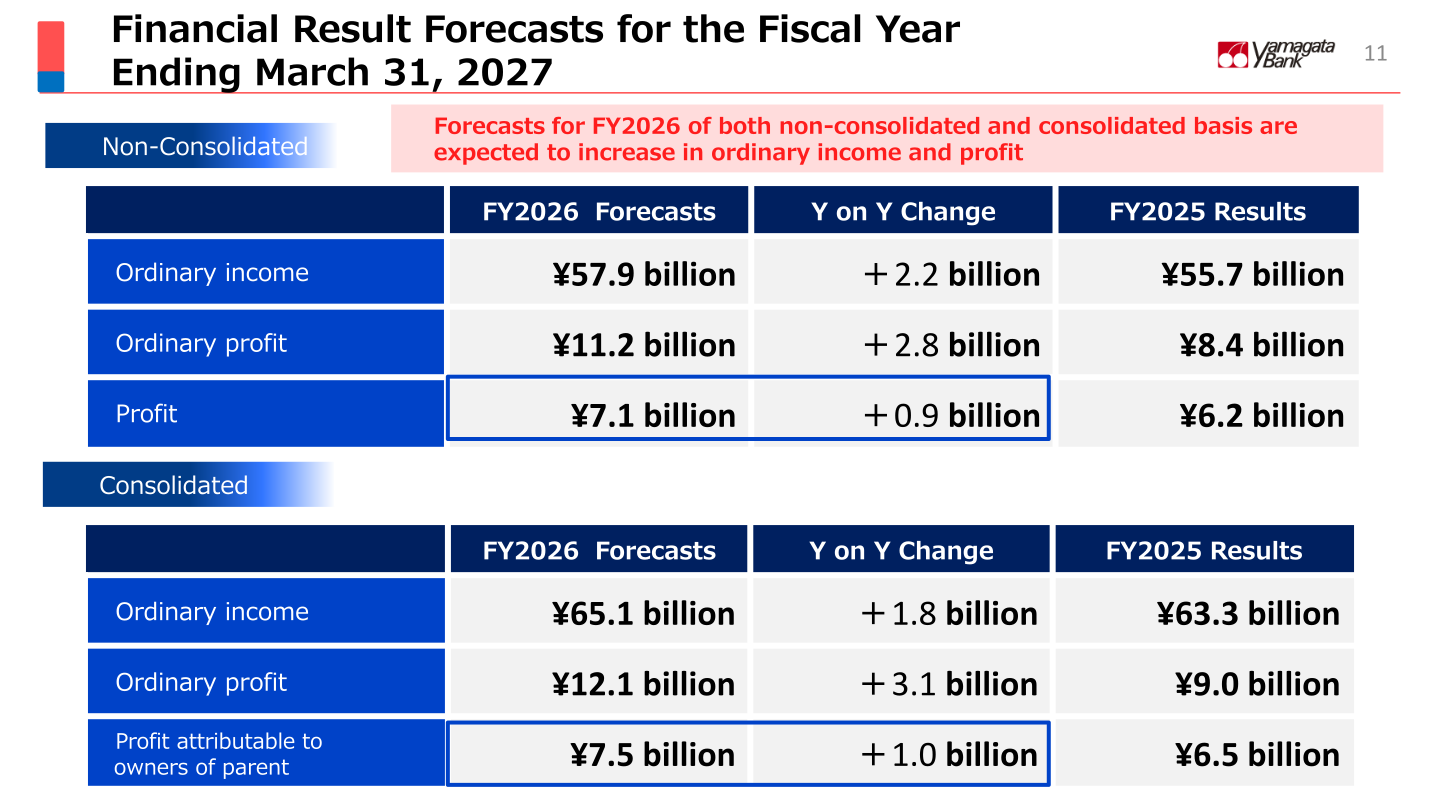
Forecasts for FY2026 on both a non-consolidated and consolidated basis are expected to show increases in ordinary income and profit.
| Basis | Item | FY2026 Forecast | Y on Y Change | FY2025 Results |
|---|---|---|---|---|
| Non-Consolidated | Ordinary income | ¥57.9 billion | +¥2.2 billion | ¥55.7 billion |
| Non-Consolidated | Ordinary profit | ¥11.2 billion | +¥2.8 billion | ¥8.4 billion |
| Non-Consolidated | Profit | ¥7.1 billion | +¥0.9 billion | ¥6.2 billion |
| Consolidated | Ordinary income | ¥65.1 billion | +¥1.8 billion | ¥63.3 billion |
| Consolidated | Ordinary profit | ¥12.1 billion | +¥3.1 billion | ¥9.0 billion |
| Consolidated | Profit attributable to owners of parent | ¥7.5 billion | +¥1.0 billion | ¥6.5 billion |
Shareholder Returns
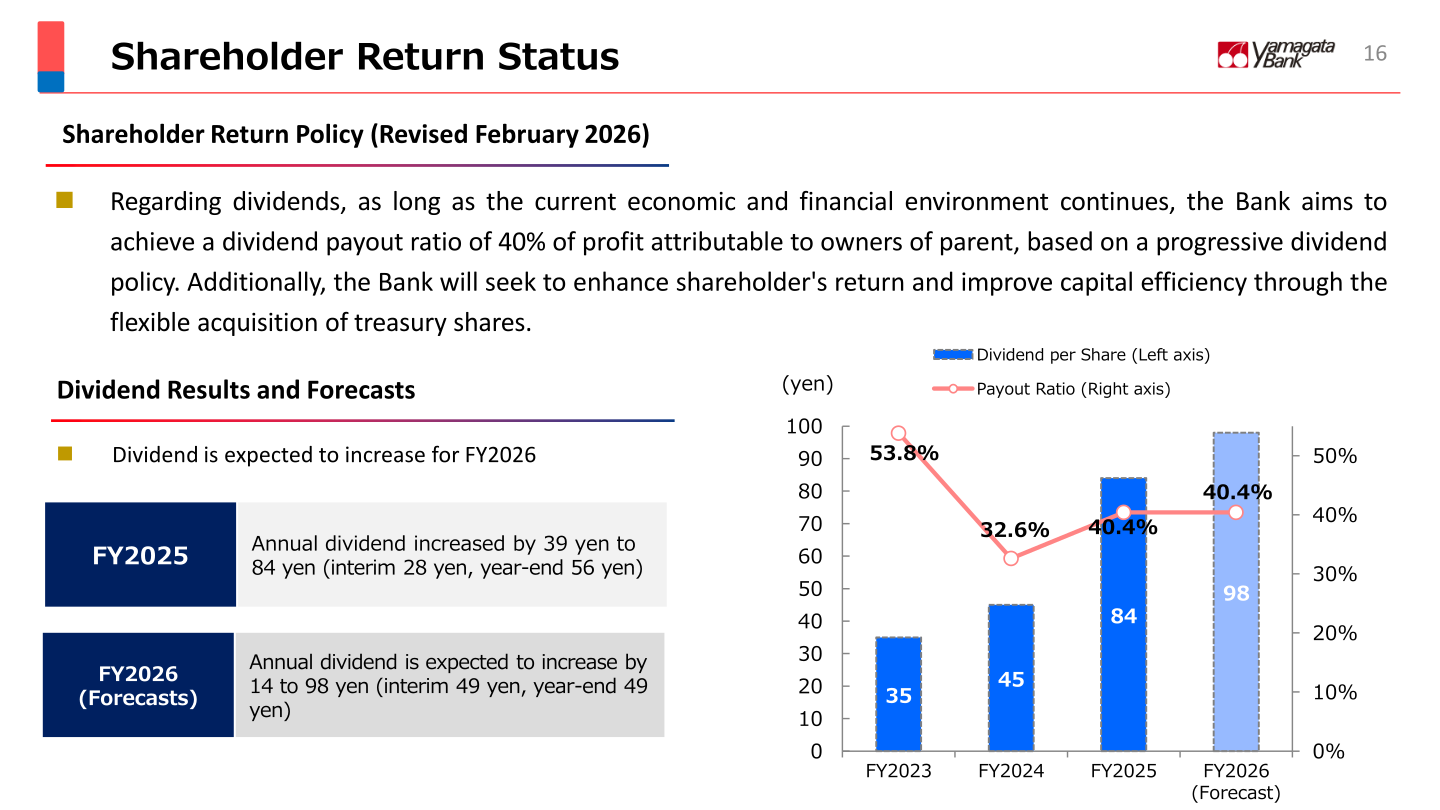
Under its shareholder return policy revised in February 2026, the Bank stated that, as long as the current economic and financial environment continues, it aims to achieve a dividend payout ratio of 40% of profit attributable to owners of parent, based on a progressive dividend policy. Additionally, the Bank will seek to enhance shareholder returns and improve capital efficiency through the flexible acquisition of treasury shares. The annual dividend for FY2025 increased by 39 yen to 84 yen (interim 28 yen, year-end 56 yen). For FY2026, the annual dividend is expected to increase by 14 yen to 98 yen (interim 49 yen, year-end 49 yen).
| Fiscal Year | Dividend per Share (yen) | Payout Ratio |
|---|---|---|
| FY2023 | 35 | 53.8% |
| FY2024 | 45 | 32.6% |
| FY2025 | 84 | 40.4% |
| FY2026 (Forecast) | 98 | 40.4% |
Capital Adequacy and Asset Quality
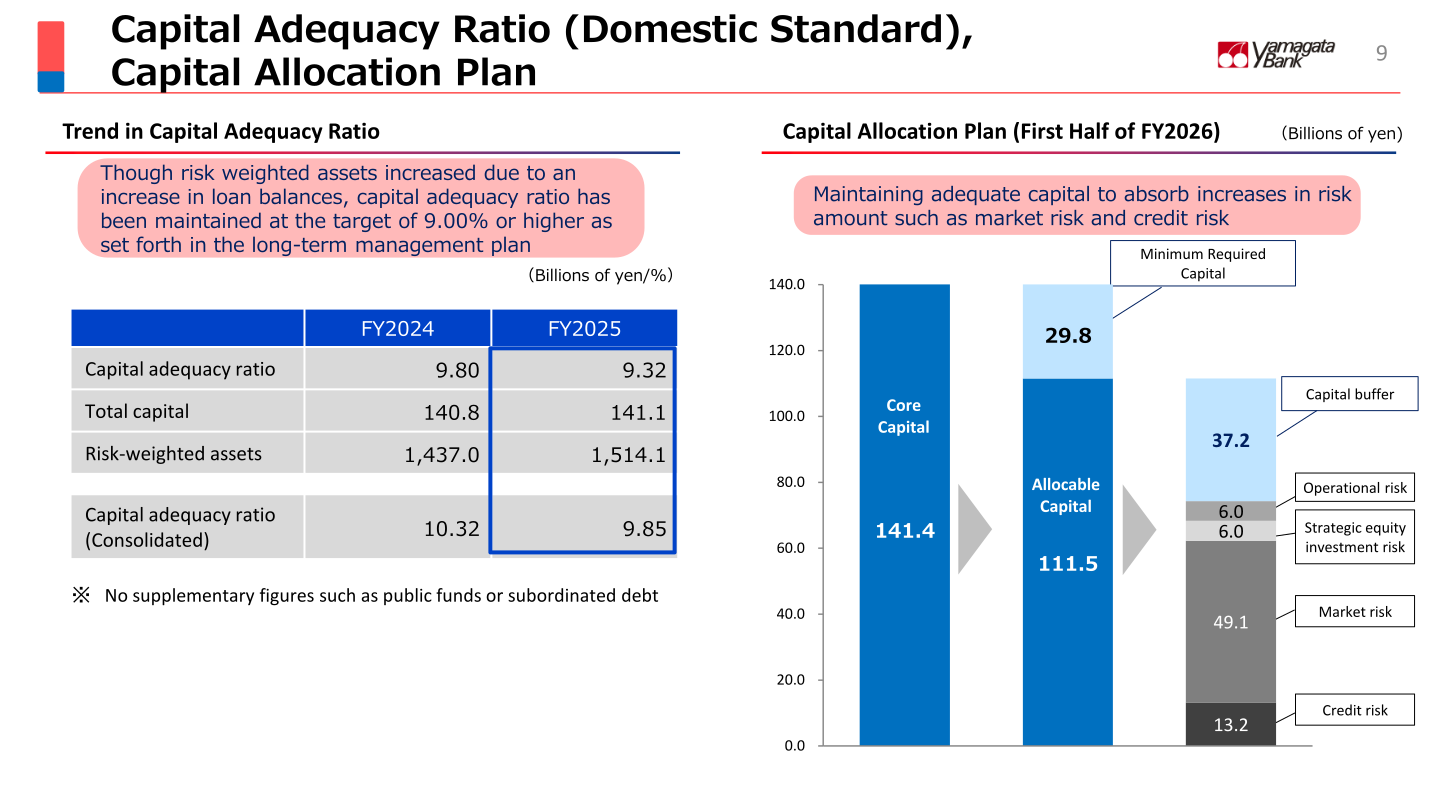
Although risk-weighted assets increased due to an increase in loan balances, the capital adequacy ratio was maintained at the target of 9.00% or higher as set forth in the long-term management plan. Both disposal of non-performing loans and provision of general reserve for loan losses decreased, and the non-performing loan ratio was maintained at a favorable level. Credit-related expenses ((1)+(2)-(3)) were ¥225 million in FY2025, compared with ¥724 million in FY2024 and ¥154 million in FY2023. The non-performing loan ratio was 0.95% in FY2025, versus 0.98% in FY2024, compared with a regional bank average of 1.76%.
| Item | FY2025 | FY2024 |
|---|---|---|
| Capital adequacy ratio (%) | 9.32 | 9.80 |
| Total capital (Billions of yen) | 141.1 | 140.8 |
| Risk-weighted assets (Billions of yen) | 1,514.1 | 1,437.0 |
| Capital adequacy ratio, Consolidated (%) | 9.85 | 10.32 |
This article is an analysis based on publicly available information and is not a recommendation to buy or sell any specific securities. Investment decisions are your own responsibility.
















