
This article is based on publicly available IR materials and is not a recommendation to buy or sell any specific securities.
Note: Forval Corporation does not publish an English results presentation; this article is an English translation of the Japanese-language article on our sister site Investalk, which is based on the company’s Japanese-language IR materials, with figures transcribed as reported. The source materials label the period as the fiscal year ended March 31, 2026 (FY3/2026); on this site the most recently completed fiscal year is classified as FY2025, while the body text, tables and segment data below retain the company’s own FY3/20XX period labels.
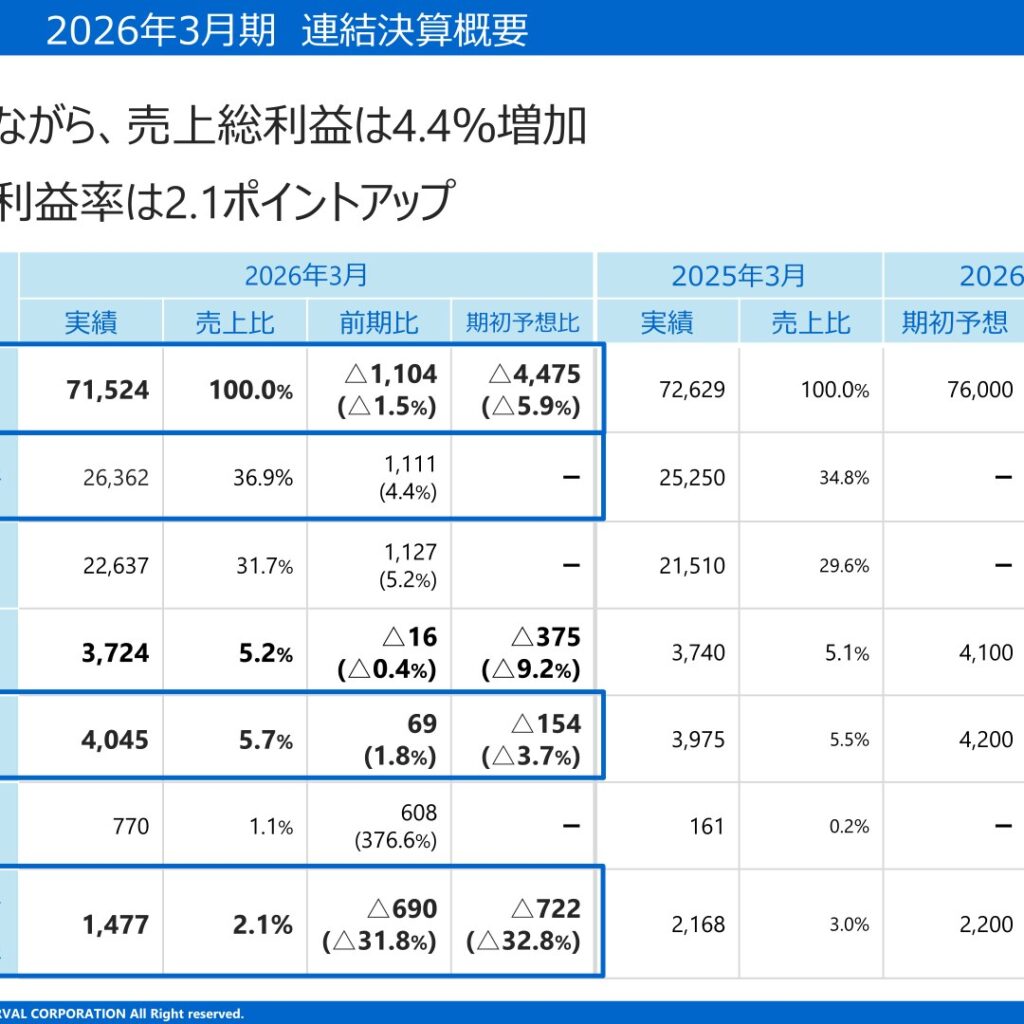
Forval Corporation announced its consolidated results for the fiscal year ended March 2026 (2026年3月期). Revenue declined 1.5% year on year due to lower sales at Elcom and Appletree, but gross profit rose 4.4%, and ordinary profit renewed its all-time high for the third consecutive year. On the other hand, profit attributable to owners of parent fell 31.8% year on year, mainly due to a valuation loss on investment securities of 740 million yen recorded as an extraordinary loss. The dividend was raised for the fourth consecutive year.
Consolidated Results (FY3/2026 Actual)
Revenue was 71,524 million yen (down 1.5% year on year, down 5.9% versus the initial forecast), gross profit was 26,362 million yen (up 4.4% year on year), operating profit was 3,724 million yen (down 0.4% year on year, down 9.2% versus the initial forecast), ordinary profit was 4,045 million yen (up 1.8% year on year, down 3.7% versus the initial forecast), and profit attributable to owners of parent was 1,477 million yen (down 31.8% year on year, down 32.8% versus the initial forecast). The gross profit margin rose 2.1 points year on year. (Figures in millions of yen.)
| Item | FY3/2026 (Actual) | FY3/2025 (Actual) | Change from Previous Year | Initial Forecast |
|---|---|---|---|---|
| Revenue | 71,524 | 72,629 | △1,104(△1.5%) | 76,000 |
| Gross profit | 26,362 | 25,250 | 1,111(4.4%) | ― |
| SG&A expenses | 22,637 | 21,510 | 1,127(5.2%) | ― |
| Operating profit | 3,724 | 3,740 | △16(△0.4%) | 4,100 |
| Ordinary profit | 4,045 | 3,975 | 69(1.8%) | 4,200 |
| Extraordinary losses | 770 | 161 | 608(376.6%) | ― |
| Profit attributable to owners of parent | 1,477 | 2,168 | △690(△31.8%) | 2,200 |
The main factors behind the shortfall versus the initial revenue forecast were four companies: Elcom, Daiichi Kogeisha, Forval Telecom, and Appletree. The company recorded a valuation loss on investment securities of 740 million yen as an extraordinary loss. SG&A expenses increased across the board: personnel expenses rose from 14,189 million yen to 14,839 million yen (+649 million yen, +4.6%, reflecting an increase in employees and newly consolidated subsidiaries, among other factors), other expenses rose from 6,533 million yen to 6,929 million yen (+396 million yen, +6.1%, reflecting increases in travel expenses, information-processing costs, rent, and other items), and selling expenses rose from 787 million yen to 868 million yen (+81 million yen, +10.4%, reflecting an increase in advertising expenses, among other factors). Separately, the company entered into a business alliance with Infometis (in which it holds a 12.94% equity stake) in December 2024 for the joint development of power visualization services and other offerings.
Segment Results
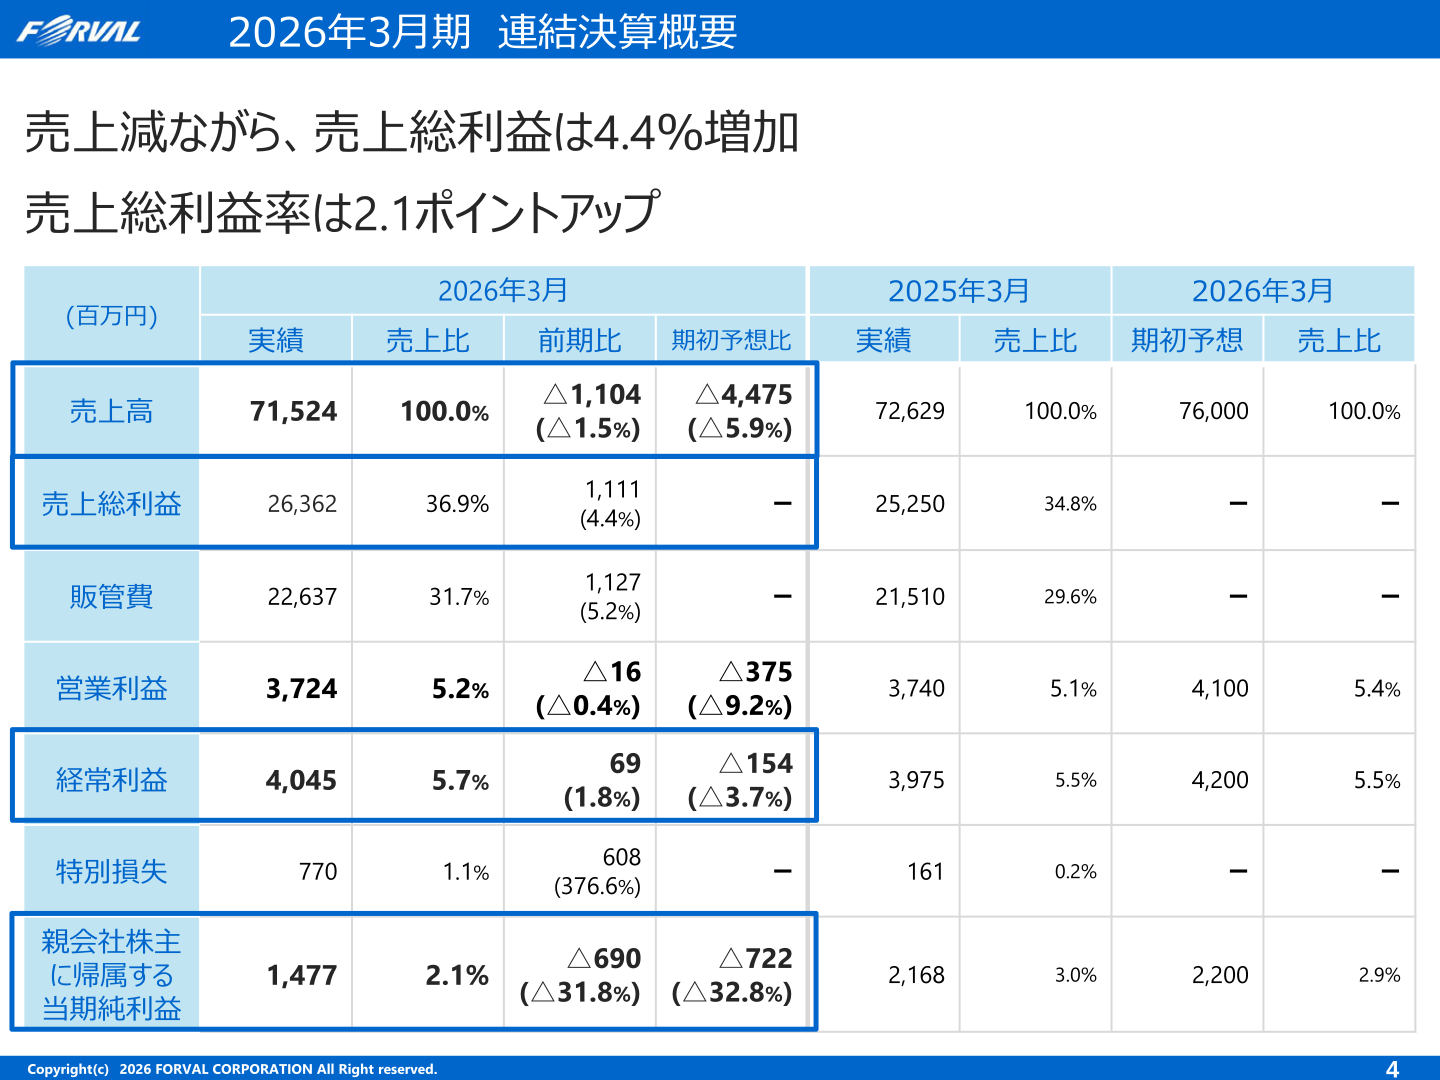
The Forval Business Group saw steady progress in its Kigyo Doctor (Corporate Doctor) visualization and hands-on management support services, but posted lower revenue and profit due to the impact of Elcom and Daiichi Kogeisha. The Forval Telecom Business Group’s revenue was roughly flat year on year due to lower selling prices in the retail electricity business, but profit increased on growth in the number of contracts for electricity and telecommunications services. The Comprehensive Environmental Consulting Business Group posted lower revenue and a segment loss as solar power systems declined, affected by constrained supply of solar panels and higher procurement costs. Human Capital Management posted higher revenue and profit, helped by contributions from its education business, including seminars, and from group companies newly consolidated during the previous fiscal year. Revenue from visualization and hands-on support was 49,710 million yen (up 3.8% year on year), of which the number of external partners increased to 34,569 (up 2.5%).
| Segment | Revenue (FY3/2026) | Revenue (FY3/2025) | Segment Profit (FY3/2026) | Segment Profit (FY3/2025) |
|---|---|---|---|---|
| Forval Business Group | 39,455 | 39,636 | 2,581 | 2,634 |
| Forval Telecom Business Group | 23,453 | 23,436 | 1,253 | 1,150 |
| Comprehensive Environmental Consulting Business Group | 5,125 | 6,346 | △27 | 73 |
| Human Capital Management | 3,490 | 3,209 | 333 | 284 |
Financial Position
Free cash flow has remained positive, with cumulative FCF of 11,232 million yen over the five fiscal years from FY3/2022 through FY3/2026, financing cash flow of negative 10,359 million yen, and a combined total of positive 873 million yen. Interest-bearing debt decreased 13.7% year on year to 2,353 million yen, and the equity ratio rose to 45.2% (up 3.6 points year on year), strengthening the company’s financial position.
Full-Year Forecast
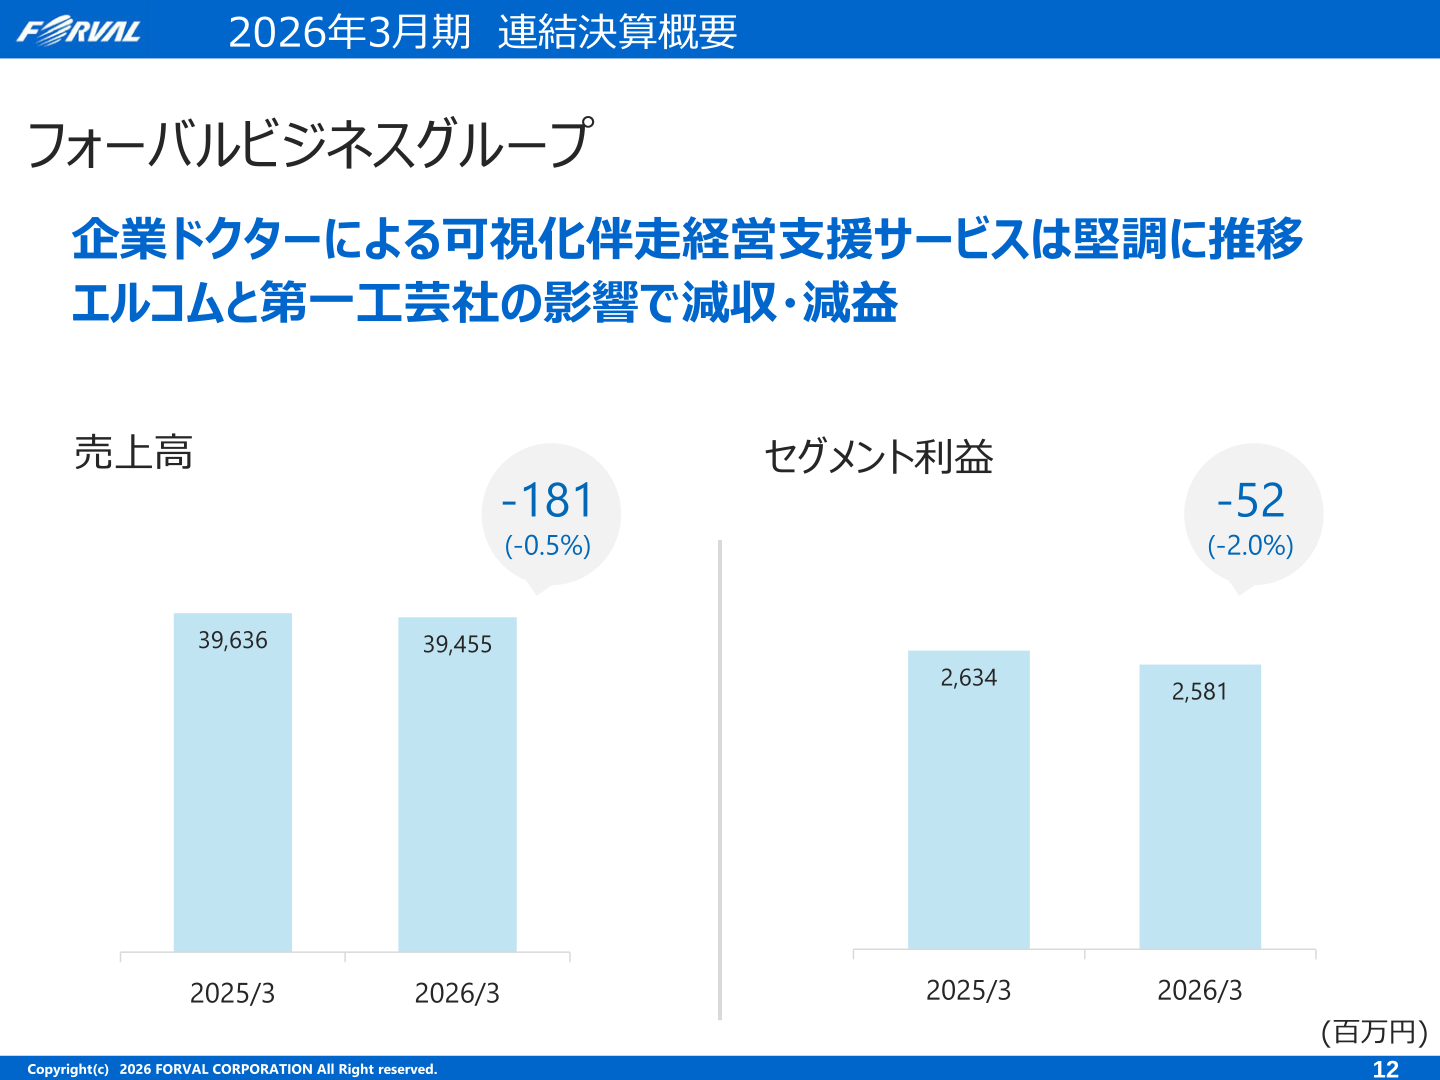
For the fiscal year ending March 2027 (FY3/2027), the company forecasts consolidated revenue of 77,000 million yen (up 7.7% year on year), operating profit of 4,100 million yen (up 10.1%), ordinary profit of 4,300 million yen (up 6.3%), and profit attributable to owners of parent of 2,200 million yen (up 48.9%). Earnings per share is expected to be 84.25 yen (versus 56.64 yen in FY3/2026 actual results). From FY3/2027, the company plans to change its segment classification to two new categories: the Kigyo Doctor (Corporate Doctor) Group and the Business Solutions Group.
| Item | FY3/2027 (Forecast) | FY3/2026 (Actual) | Change from Previous Year |
|---|---|---|---|
| Revenue | 77,000 | 71,524 | +5,475(+7.7%) |
| Operating profit | 4,100 | 3,724 | +375(+10.1%) |
| Ordinary profit | 4,300 | 4,045 | +254(+6.3%) |
| Profit attributable to owners of parent | 2,200 | 1,477 | +722(+48.9%) |
Shareholder Returns
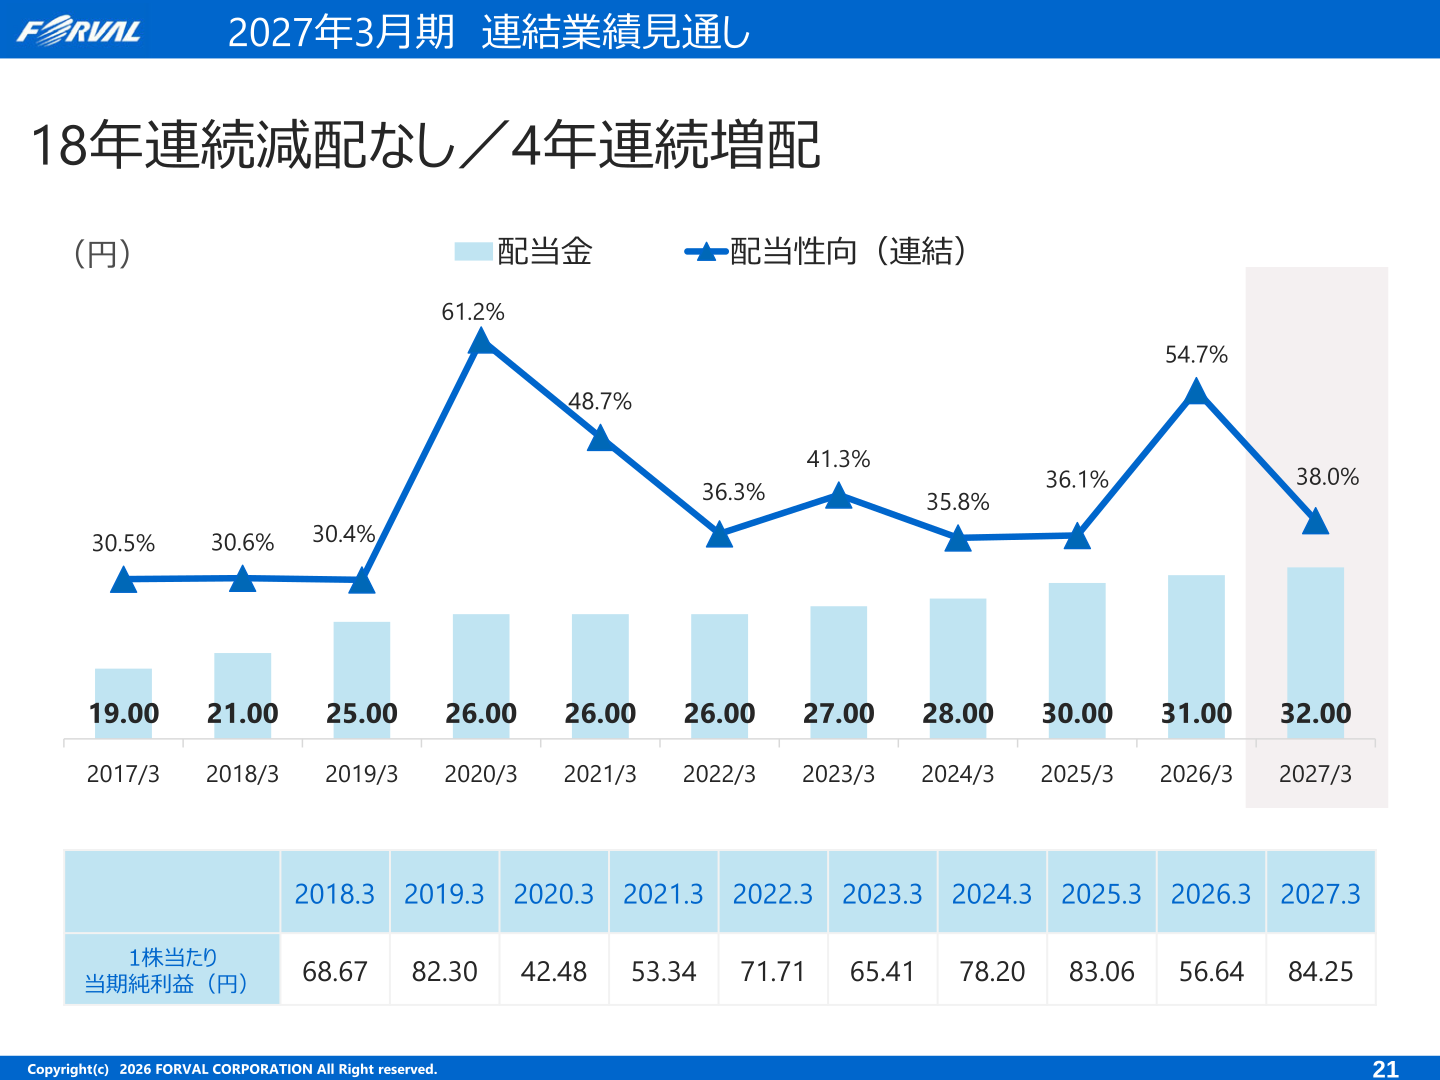
The dividend per share was 28.00 yen for FY3/2024, 30.00 yen for FY3/2025, and 31.00 yen for FY3/2026. The materials state “no dividend cut for 18 consecutive years / dividend increases for 4 consecutive years.” As a shareholder benefit program, the company plans to award an electronic money gift (one EJOICA Select Gift Card, worth 2,000 points) to shareholders holding one unit (100 shares) or more as of the end of September 2026, marking the fifth consecutive fiscal year the program has been carried out. The company plans a dividend of 32.00 yen for FY3/2027.
| Fiscal Year | Annual Dividend per Share (yen) |
|---|---|
| FY3/2017 | 19.00 |
| FY3/2018 | 21.00 |
| FY3/2019 | 25.00 |
| FY3/2020 | 26.00 |
| FY3/2021 | 26.00 |
| FY3/2022 | 26.00 |
| FY3/2023 | 27.00 |
| FY3/2024 | 28.00 |
| FY3/2025 | 30.00 |
| FY3/2026 | 31.00 |
| FY3/2027 (Forecast) | 32.00 |
Growth Strategy
As its growth strategy, the company has set a target of increasing the number of Kigyo Doctors (Corporate Doctors) from the current 2,030 to 10,000 by FY3/2031, and ultimately to 260,000. It aims to increase the number of client companies served from the current 49,710 to 76,923 by FY3/2031, and ultimately to 2,000,000.
This article is an analysis based on publicly available information and is not a recommendation to buy or sell any specific securities. Investment decisions are your own responsibility.
















