
This article is based on publicly available IR materials and is not a recommendation to buy or sell any specific securities.
Mitsubishi Research Institute, Inc. (MRI) announced its FY2025 consolidated financial results and FY2026 full-year forecasts on October 30, 2025. Net sales rose 5.3% year on year to 121,458 million yen, operating profit rose 13.5% to 8,010 million yen, ordinary profit rose 19.5% to 9,734 million yen, and profit attributable to owners of parent rose 27.6% to 6,386 million yen. The company described the year as its first revenue increase in two years and first profit increase in three years, with record-high operating and ordinary profits in Think Tank & Consulting Services (TTC) and record-high revenue in IT Services (ITS). For FY2026, which the company positions as a year for rebuilding business, it forecasts net sales of 122,000 million yen and lower profits, while keeping the annual dividend at 165 yen.
Consolidated Results (Full-Year Actual)
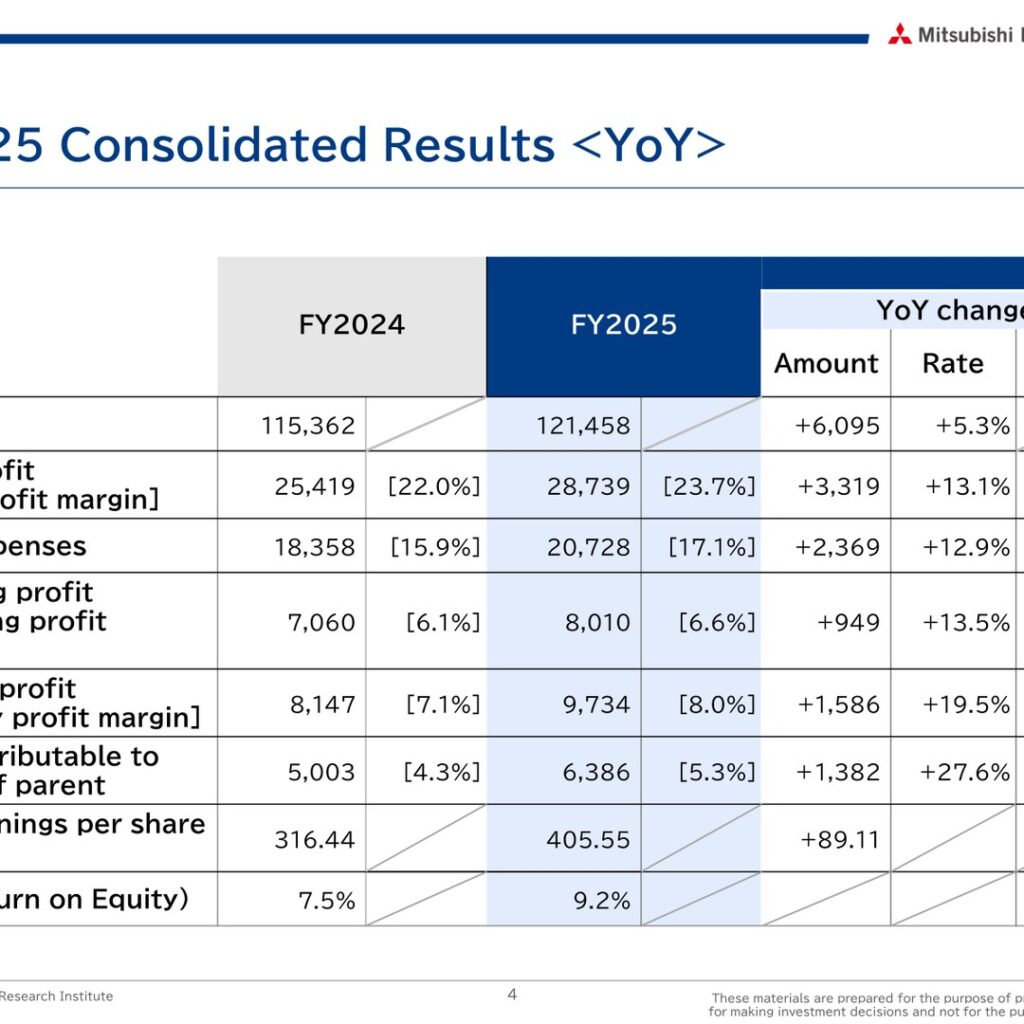
Net sales were 121,458 million yen (+6,095 million yen, +5.3%). Gross profit rose 13.1% to 28,739 million yen, lifting the gross profit margin to 23.7% (+1.7P). SG&A expenses increased 12.9% to 20,728 million yen. Operating profit reached 8,010 million yen (margin 6.6%), and ordinary profit reached 9,734 million yen (margin 8.0%). Profit attributable to owners of parent rose to 6,386 million yen, which the materials attribute in part to the partial sale of shares in an equity-method affiliated company. Basic earnings per share were 405.55 yen (+89.11 yen) and ROE improved to 9.2% from 7.5%.
| Item (million yen) | FY2024 | FY2025 | YoY Change | Rate |
|---|---|---|---|---|
| Net sales | 115,362 | 121,458 | +6,095 | +5.3% |
| Gross profit [margin] | 25,419 [22.0%] | 28,739 [23.7%] | +3,319 | +13.1% |
| SG&A expenses [ratio] | 18,358 [15.9%] | 20,728 [17.1%] | +2,369 | +12.9% |
| Operating profit [margin] | 7,060 [6.1%] | 8,010 [6.6%] | +949 | +13.5% |
| Ordinary profit [margin] | 8,147 [7.1%] | 9,734 [8.0%] | +1,586 | +19.5% |
| Profit attributable to owners of parent [margin] | 5,003 [4.3%] | 6,386 [5.3%] | +1,382 | +27.6% |
| Basic earnings per share (yen) | 316.44 | 405.55 | +89.11 | — |
| ROE | 7.5% | 9.2% | +1.7P | — |
Segment Results
Think Tank & Consulting Services (TTC): Net sales rose 3.7% to 47,090 million yen. The materials state that revenue grew mainly due to the effect of personnel reassignment, strong orders and an increased billable utilization rate in 2H, with growth in information and telecommunications projects and cyber security business for government and public offices more than offsetting the absence of the previous year’s large-scale government projects. Operating profit rose 27.7% to 4,344 million yen (margin 9.2%) and ordinary profit rose 34.9% to 5,715 million yen, helped by cost-cutting measures and higher equity-method investment profit. Orders received rose 19.4% to 51,506 million yen and the order backlog rose 17.1% to 30,217 million yen, driven by projects such as AI and automated driving projects for government and public offices and DX-related projects.
IT Services (ITS): Net sales rose 6.3% to 74,367 million yen, driven by public sector systems projects, payment-domain projects in the financial and credit card field, and general industry projects. Operating profit was 3,683 million yen (+0.7%, margin 5.0%) and ordinary profit was 4,037 million yen (+3.3%). Head office relocation expenses (-0.5 billion yen) and the impact of unprofitable projects in 1H were offset by higher profit in 2H, the windup of unprofitable projects and actuarial differences (+0.4 billion yen). Orders received rose 3.8% to 75,077 million yen and the order backlog rose 1.4% to 50,315 million yen.
| Segment | Metric (million yen) | FY2024 | FY2025 | YoY Change |
|---|---|---|---|---|
| TTC | Net sales | 45,419 | 47,090 | +1,671 (+3.7%) |
| TTC | Operating profit | 3,402 | 4,344 | +941 (+27.7%) |
| TTC | Ordinary profit | 4,237 | 5,715 | +1,478 (+34.9%) |
| TTC | Orders received | 43,133 | 51,506 | +8,373 (+19.4%) |
| TTC | Order backlog | 25,801 | 30,217 | +4,415 (+17.1%) |
| ITS | Net sales | 69,942 | 74,367 | +4,424 (+6.3%) |
| ITS | Operating profit | 3,657 | 3,683 | +25 (+0.7%) |
| ITS | Ordinary profit | 3,909 | 4,037 | +127 (+3.3%) |
| ITS | Orders received | 72,322 | 75,077 | +2,754 (+3.8%) |
| ITS | Order backlog | 49,605 | 50,315 | +709 (+1.4%) |
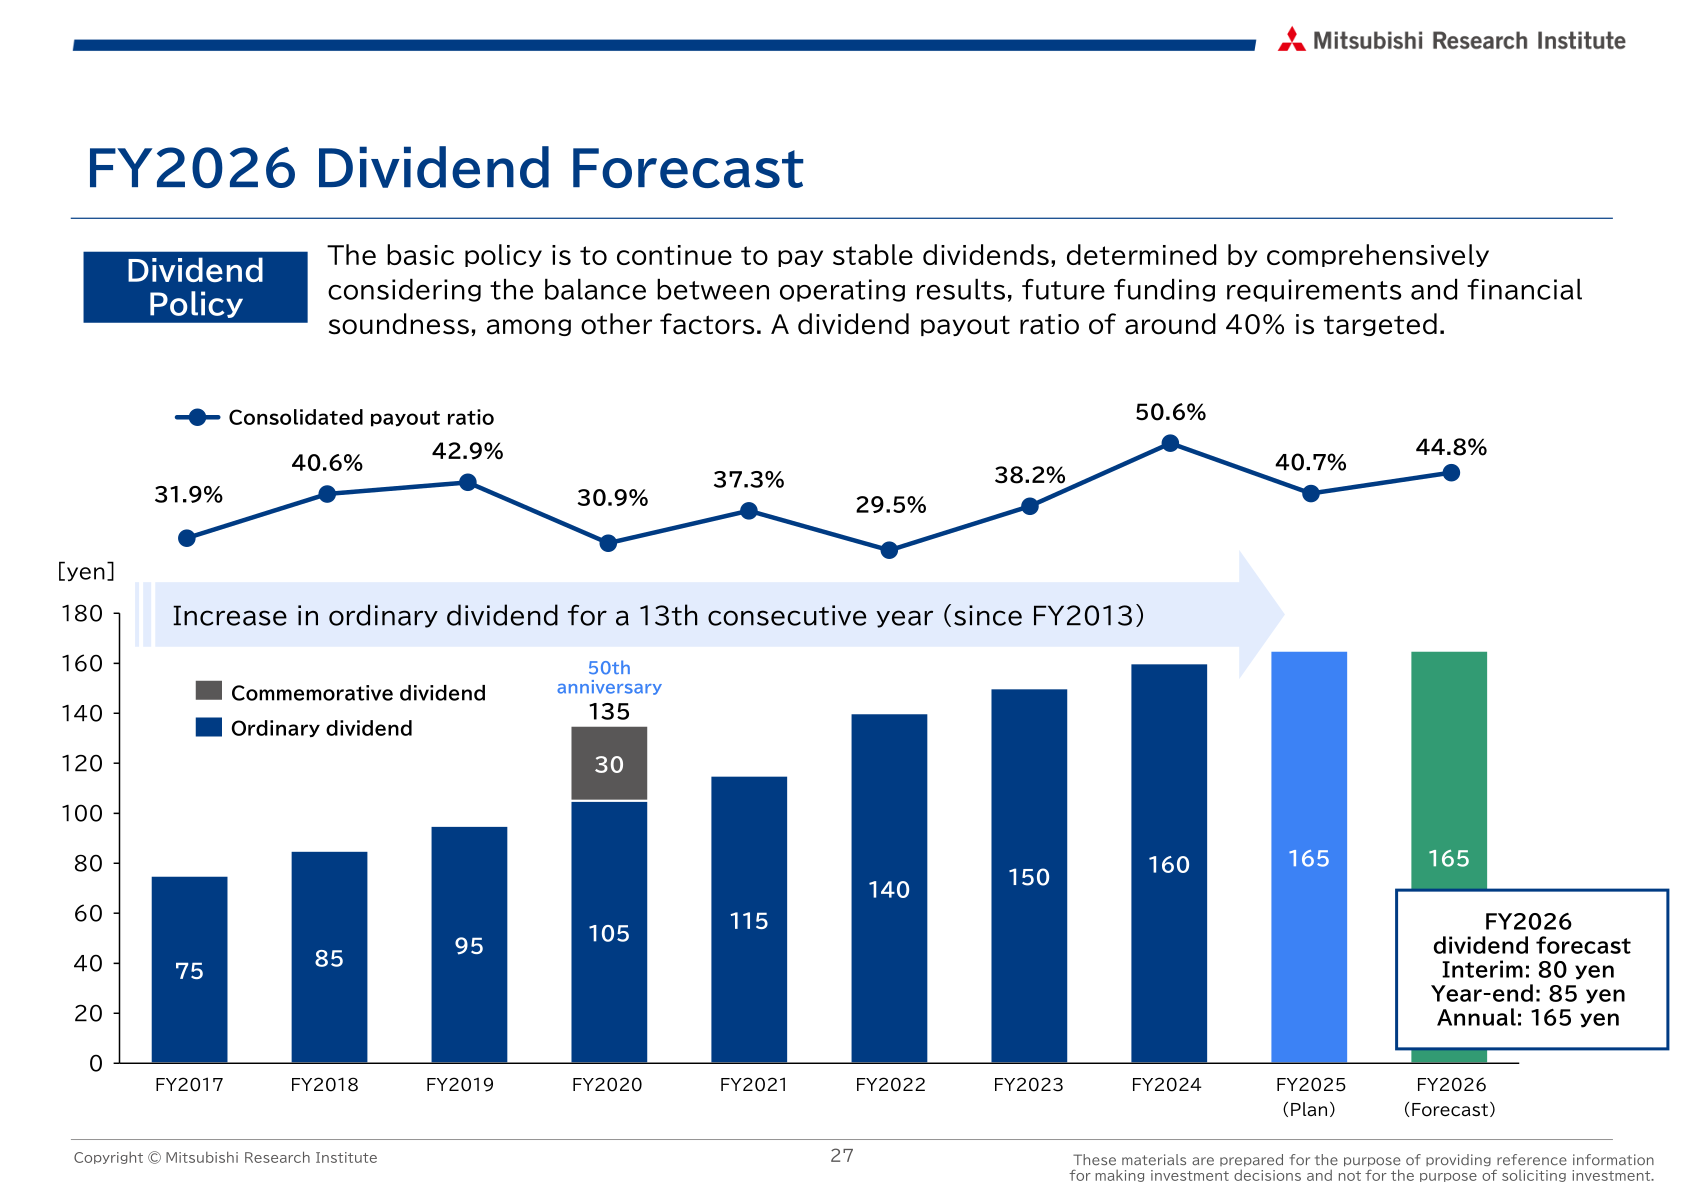
By customer industry sector, revenue increased in all three sectors: government and public offices (32,318 million yen, +2,716 million yen, +8.5%), finance/credit card (54,329 million yen, +2,049 million yen, +3.9%) and general industries (34,810 million yen, +1,328 million yen, +4.3%). The combined order backlog carried forward from the end of FY2025 was 80,532 million yen, up 5,125 million yen (+6.8%).
FY2026 Forecast
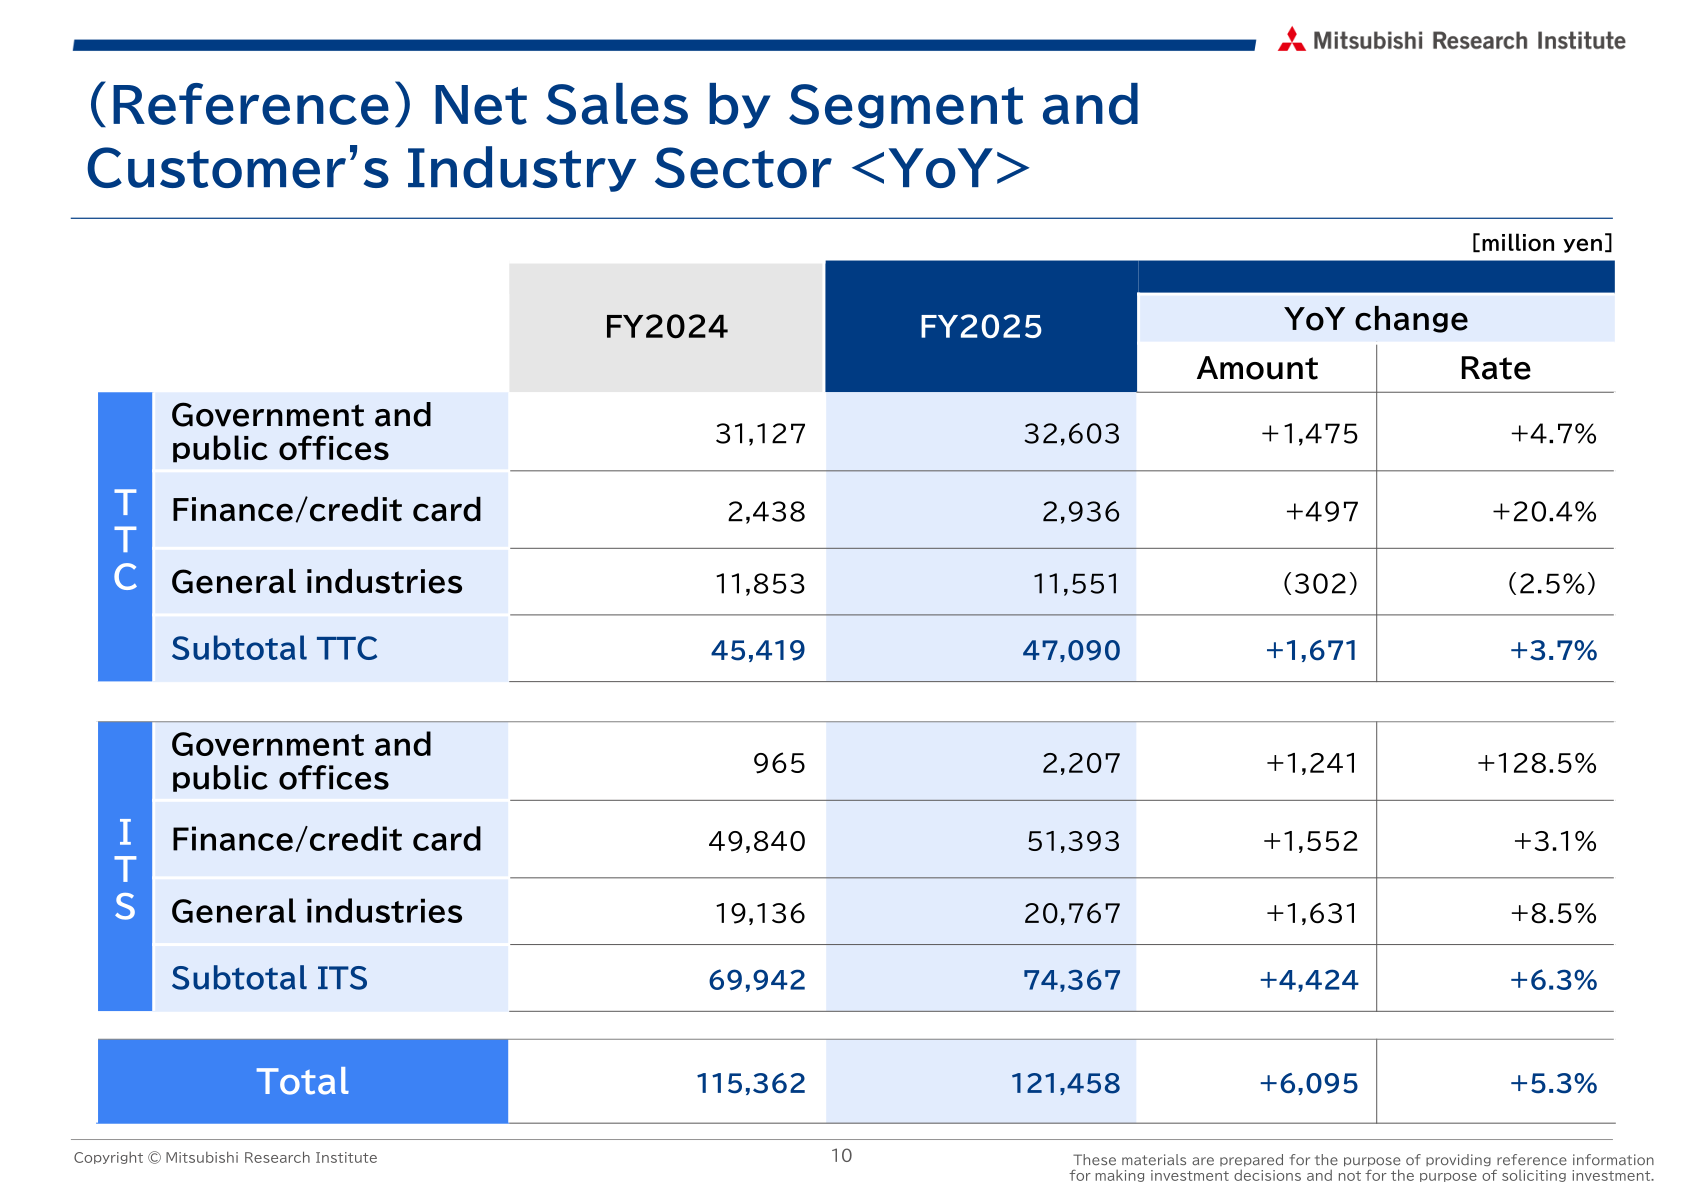
For FY2026, MRI forecasts net sales of 122,000 million yen (+0.4%), operating profit of 7,500 million yen (-6.4%), ordinary profit of 9,000 million yen (-7.5%) and profit attributable to owners of parent of 5,800 million yen (-9.2%), with ROE of 8.0%. The company plans increased investment for the next stage of growth, including business efficiency improvements through AI, investment in human resources and expansion of service-type new businesses. In TTC, ordinary profit is projected to fall by 0.4 billion yen as an effective increase in revenue is more than offset by investment in people, AI and R&D and lower non-operating income. In ITS, ordinary profit is projected to fall by 0.3 billion yen as business growth is offset by the absence of one-time factors and large-scale projects and higher expenses for measures and infrastructure. The order backlog brought forward covers 62.3% (+7.5P) of the TTC revenue forecast and 68.5% (+1.8P) of the ITS revenue forecast.
| Item (million yen) | FY2025 Result | FY2026 Forecast | YoY Change |
|---|---|---|---|
| Net sales | 121,458 | 122,000 | +541 (+0.4%) |
| TTC net sales | 47,090 | 48,500 | +1,409 (+3.0%) |
| ITS net sales | 74,367 | 73,500 | (867) (1.2%) |
| Operating profit | 8,010 | 7,500 | (510) (6.4%) |
| Operating profit margin | 6.6% | 6.1% | (0.5P) |
| Ordinary profit | 9,734 | 9,000 | (734) (7.5%) |
| TTC ordinary profit | 5,715 | 5,300 | (415) (7.3%) |
| ITS ordinary profit | 4,037 | 3,700 | (337) (8.3%) |
| Profit attributable to owners of parent | 6,386 | 5,800 | (586) (9.2%) |
| Basic earnings per share (yen) | 405.55 | 368.26 | (37.29) (9.2%) |
| ROE | 9.2% | 8.0% | (1.2P) |
Shareholder Returns
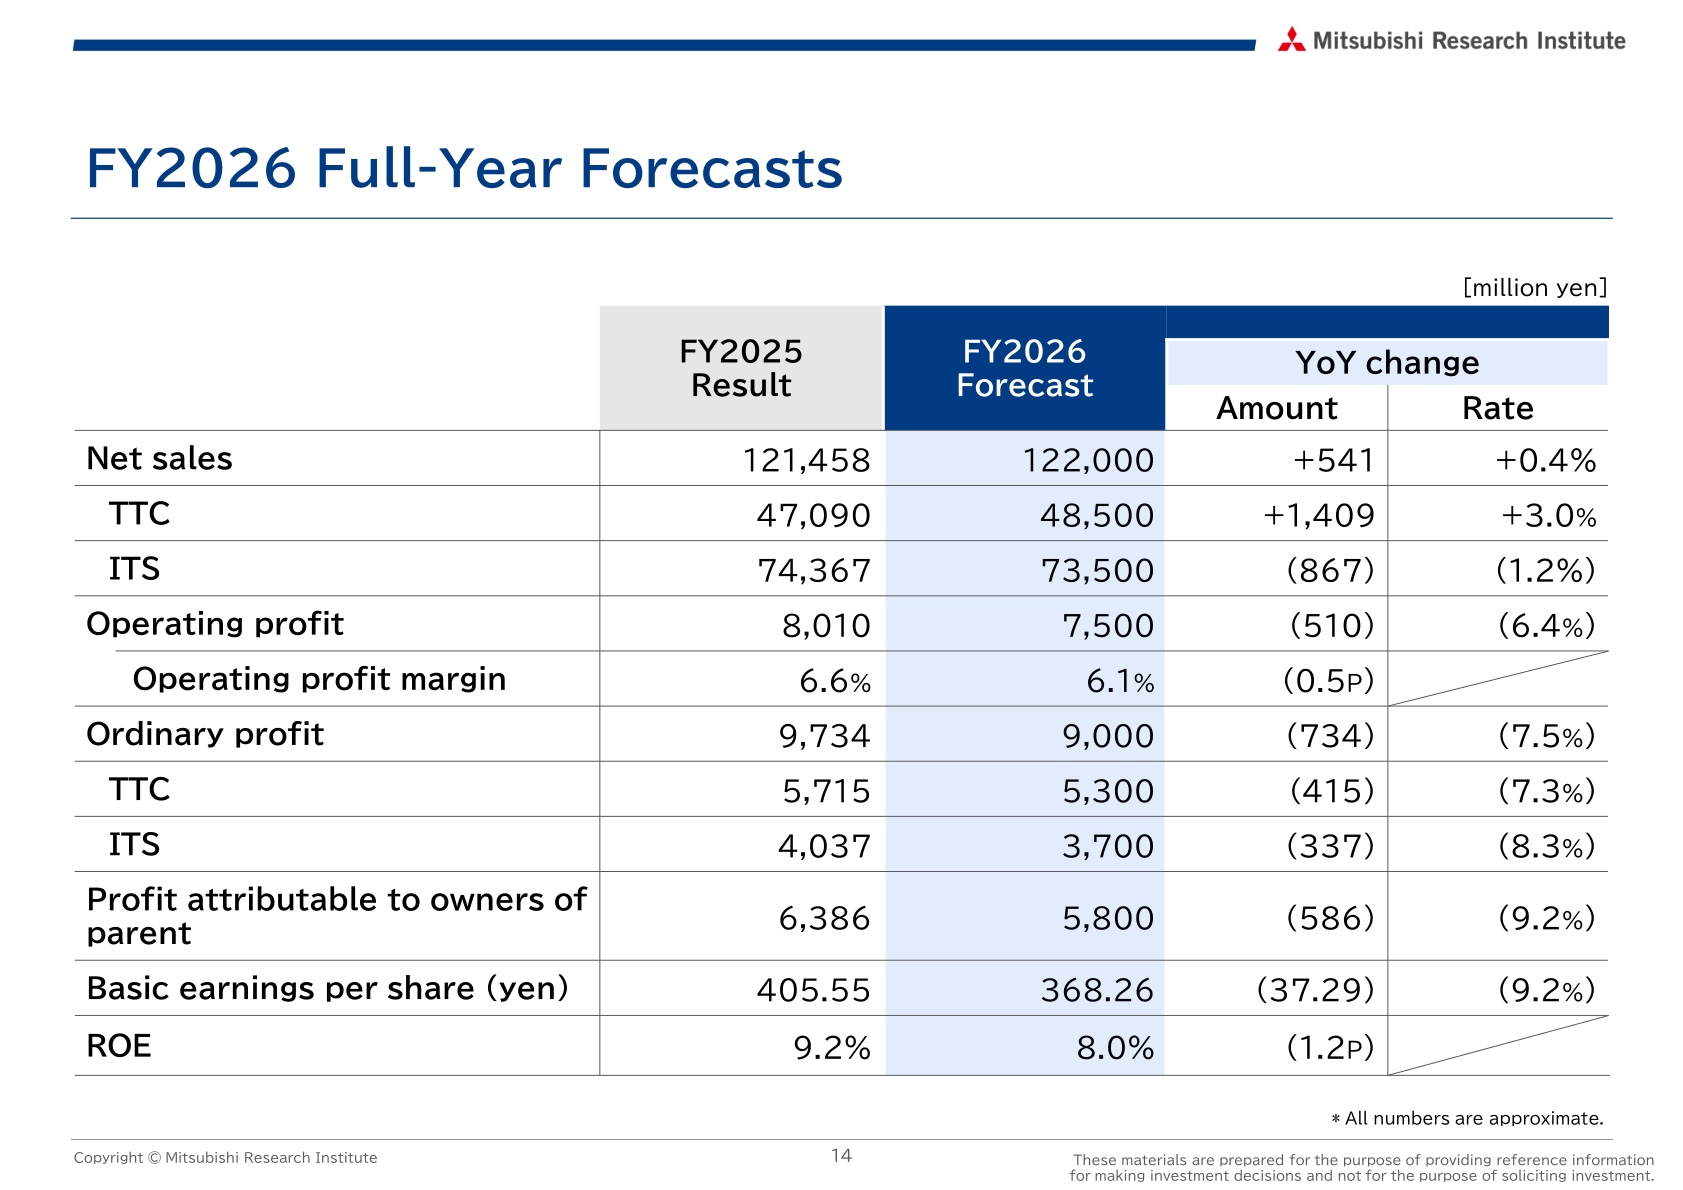
MRI’s basic policy is to continue paying stable dividends, determined by comprehensively considering operating results, future funding requirements and financial soundness, targeting a dividend payout ratio of around 40%. The FY2025 dividend is shown as 165 yen (Plan) with a consolidated payout ratio of 40.7%, up from 160 yen in FY2024. For FY2026, the company forecasts an annual dividend of 165 yen (interim 80 yen, year-end 85 yen), for a payout ratio of 44.8%. The materials state that the ordinary dividend has increased for a 13th consecutive year (since FY2013).
| Item | FY2024 | FY2025 (Plan) | FY2026 (Forecast) |
|---|---|---|---|
| Annual dividend per share (yen) | 160 | 165 | 165 (interim 80 / year-end 85) |
| Consolidated payout ratio | 50.6% | 40.7% | 44.8% |
Medium-Term Management Plan 2026 and Capital Policy
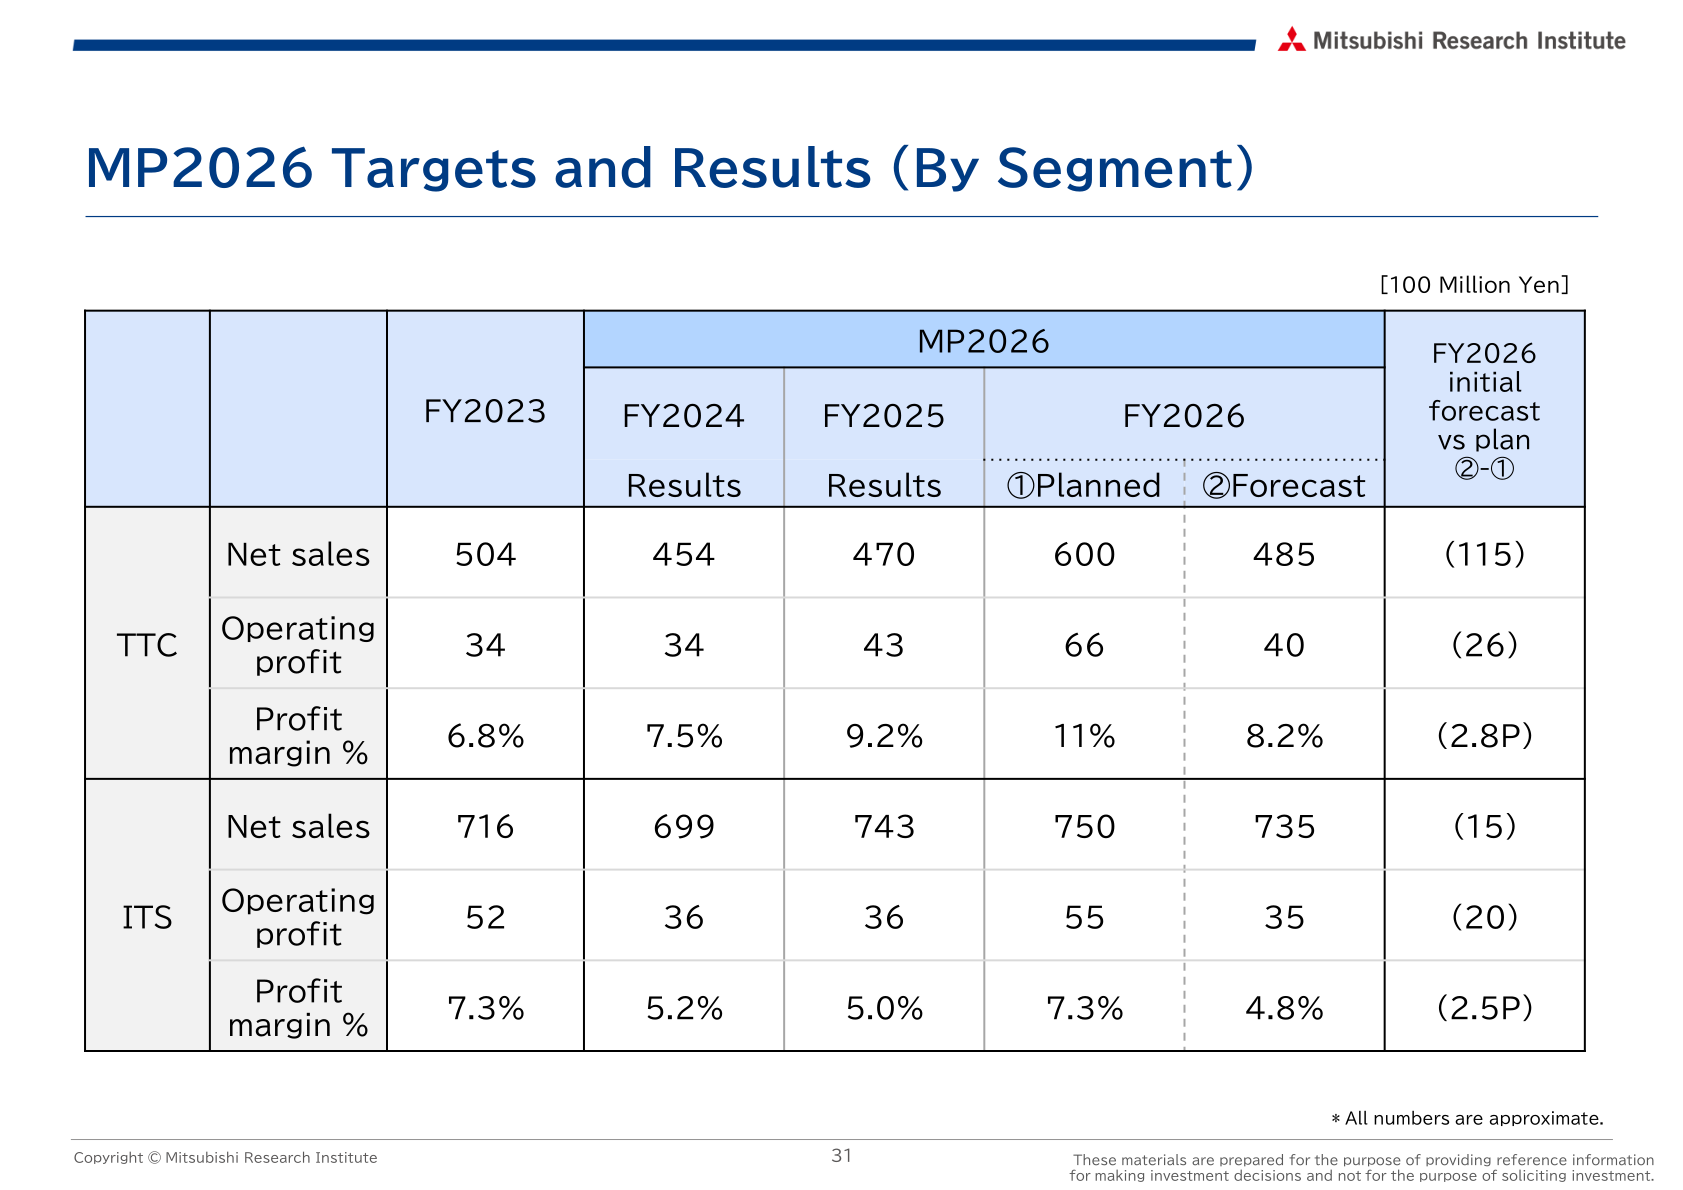
Two years into Medium-term Management Plan 2026 (MP2026), the company states that the effects of integrating MRI and Mitsubishi Research Institute DCS (DCS) have been limited and that its financial targets need to be revised. Against an MP2026 net sales target of 135.0 billion yen, FY2025 net sales were 121.4 billion yen (90% progress); against an ordinary profit target of 14.0 billion yen, FY2025 ordinary profit was 9.7 billion yen (69% progress). By segment, the FY2026 forecasts are below MP2026 plans for both TTC (net sales 485 vs. 600, operating profit 40 vs. 66, in 100 million yen) and ITS (net sales 735 vs. 750, operating profit 35 vs. 55). FY2026 is positioned as a year for rebuilding business through selection and concentration, and the next Medium-term Management Plan is to be formally announced at the time of the current fiscal year’s financial results announcement.
On capital efficiency, ROE was 9.2% and PBR was 1.13 in FY2025. The company estimates the cost of capital required by the stock market at around 9~10% and aims for double-digit ROE in the medium and long term, with detailed financial targets to be established in FY2026. Under its capital policy, funds for distribution are approximately 43.5 billion yen, allocated 20% to capital investment, 30% to growth investment, 35% to strategic investment (including M&A) and 15% or more to payouts. Service businesses developed in TTC are targeted to reach a business scale of 3.0 billion yen and gross profit of 1.0 billion yen in FY2026.
This article is an analysis based on publicly available information and is not a recommendation to buy or sell any specific securities. Investment decisions are your own responsibility.
















