
This article is based on publicly available IR materials and is not a recommendation to buy or sell any specific securities.
Note: GREE Holdings’ fiscal year ends in June. This article classifies the fiscal year ended June 2026, labeled “FY26” in the company’s materials, as FY2025 under this site’s convention; the body text and tables below keep the company’s own labels (FY26 = the year just ended, FY27 = the current forecast year).
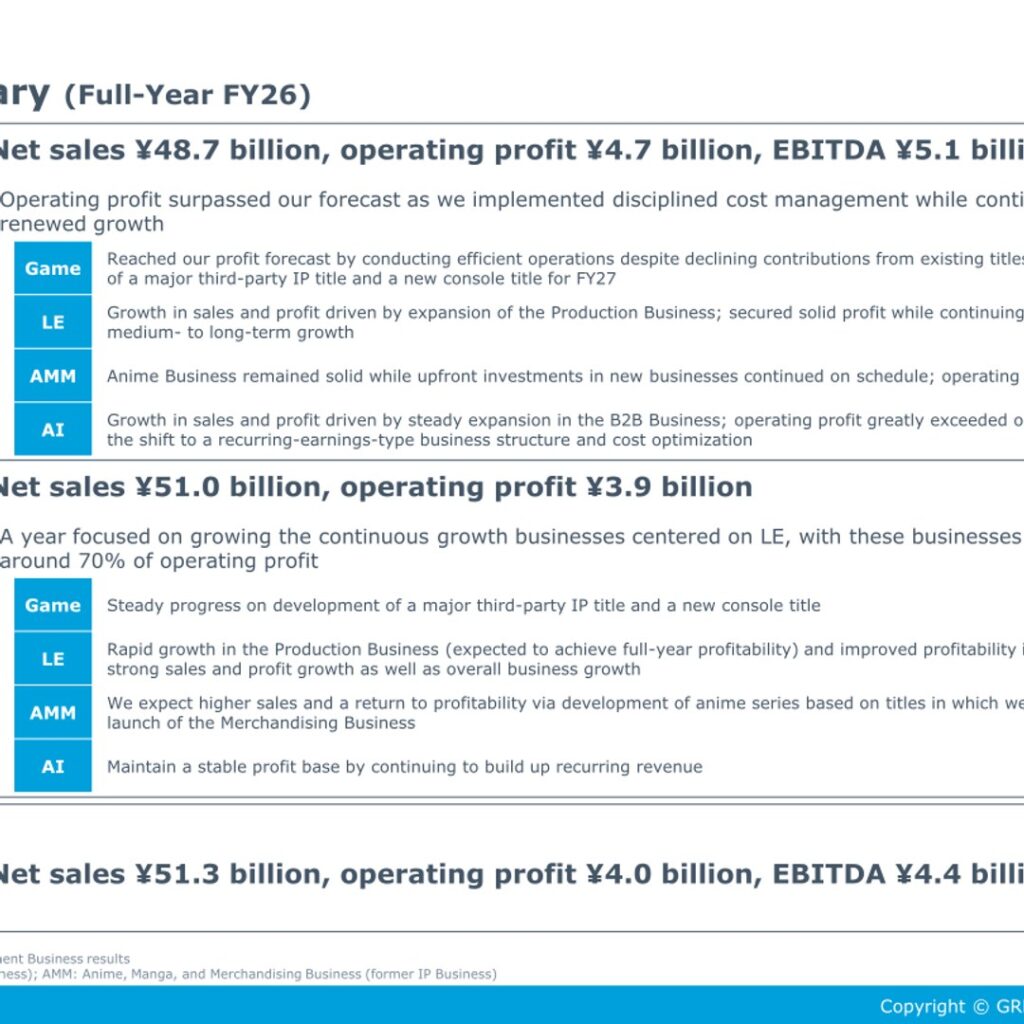
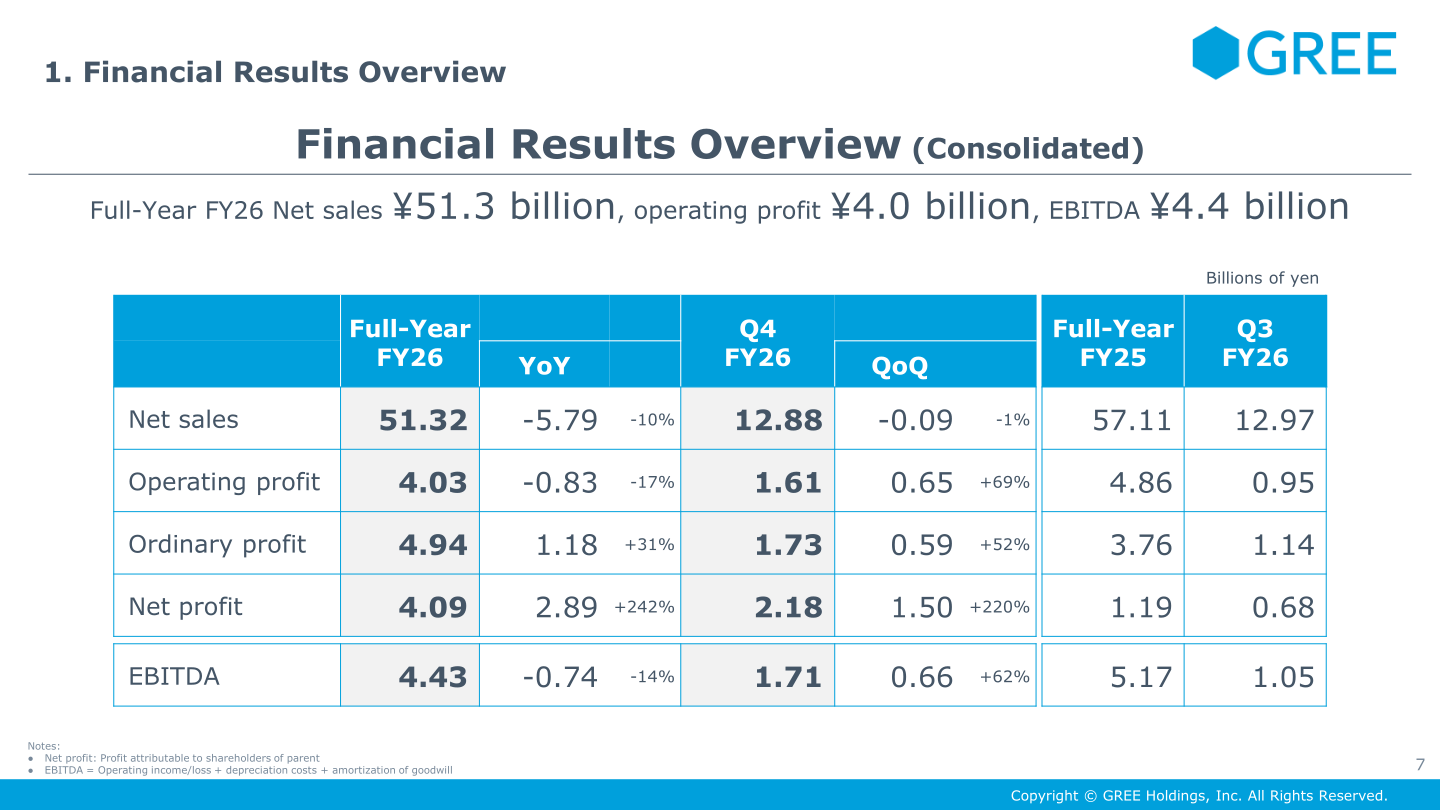
GREE Holdings, Inc. (3632) announced its Full-Year (Fourth Quarter) FY26 financial results on August 7, 2026. Consolidated net sales were ¥51.3 billion, operating profit ¥4.0 billion and EBITDA ¥4.4 billion. Net sales fell 10% and operating profit fell 17% year on year, while ordinary profit rose 31% to 4.94 billion yen and net profit (profit attributable to shareholders of parent) rose 242% to 4.09 billion yen. On a Four Segments basis (consolidated results minus the Investment Business), operating profit of ¥4.7 billion surpassed the company’s forecast, which it attributed to disciplined cost management while continuing to invest for renewed growth.
Starting with these results, the company renamed and regrouped its businesses: the VTuber Business became Live Entertainment (LE), the IP Business became Anime, Manga and Merchandising (AMM), and the DX Business and the Engineering Business were consolidated into a single AI Business. The company also divested from the Investment Business, which is reclassified to non-operating income/expenses from FY27.
Consolidated Results (Full-Year Actual)
The table below shows the consolidated full-year figures in billions of yen as presented in the results materials. Net profit refers to profit attributable to shareholders of parent, and EBITDA is defined by the company as operating income/loss plus depreciation costs and amortization of goodwill. In Q4 FY26 alone, consolidated net sales were 12.88 billion yen and operating profit 1.61 billion yen (QoQ +69%), with the Investment Business making a significant contribution.
| Item (billions of yen) | Full-Year FY26 | YoY | YoY % | Full-Year FY25 |
|---|---|---|---|---|
| Net sales | 51.32 | -5.79 | -10% | 57.11 |
| Operating profit | 4.03 | -0.83 | -17% | 4.86 |
| Ordinary profit | 4.94 | 1.18 | +31% | 3.76 |
| Net profit | 4.09 | 2.89 | +242% | 1.19 |
| EBITDA | 4.43 | -0.74 | -14% | 5.17 |
On the Four Segments basis, full-year FY26 net sales were 48.70 billion yen (-9% YoY; FY25: 53.76), operating profit 4.74 billion yen (-10%; FY25: 5.27) and EBITDA 5.15 billion yen (-8%; FY25: 5.58).
Segment Results
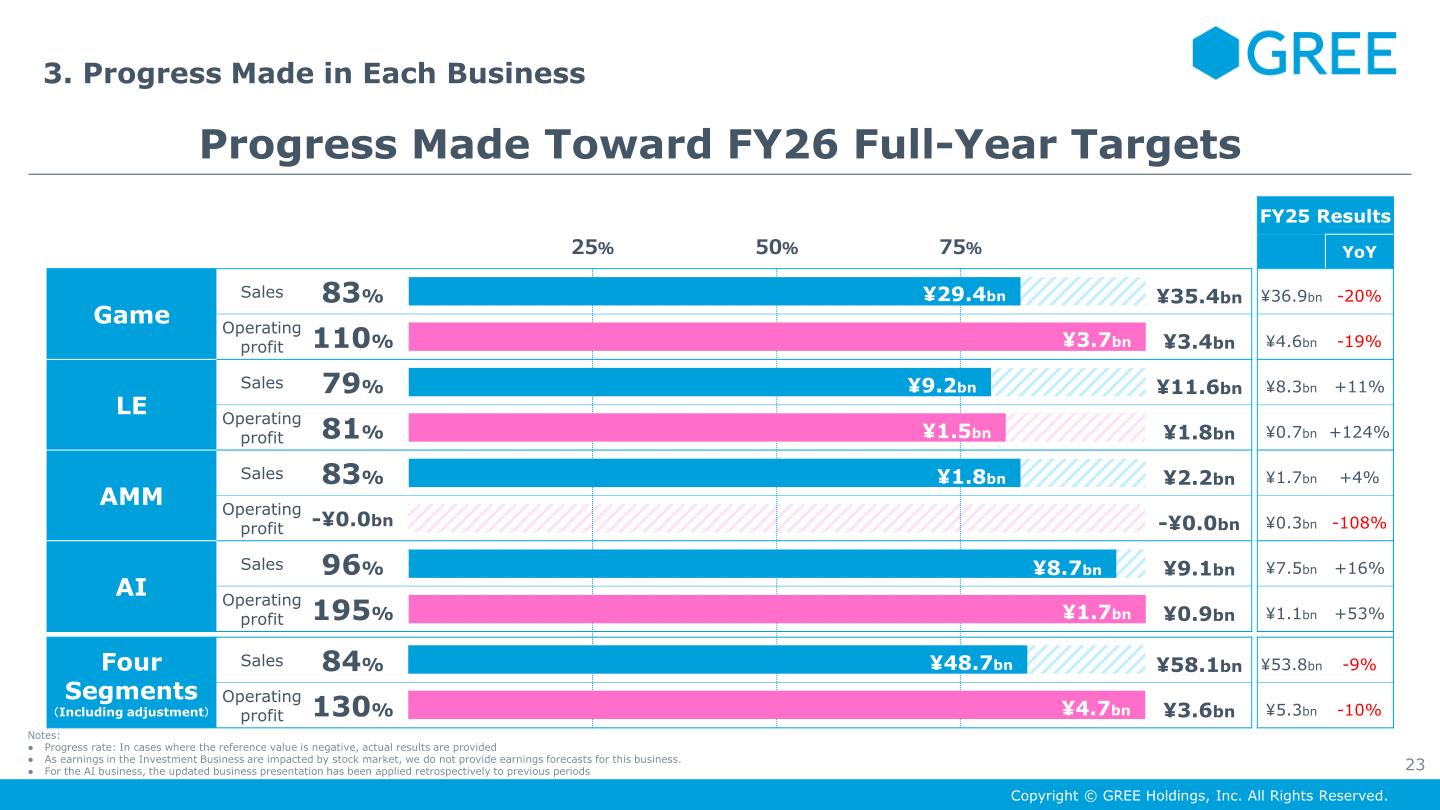
Game: Sales were ¥29.4bn (FY25: ¥36.9bn, -20%) and operating profit ¥3.7bn (FY25: ¥4.6bn, -19%). The company reached its profit forecast through efficient operations despite declining contributions from existing titles, and made progress in developing a major third-party IP title and a new console title for FY27.
Live Entertainment (LE, former VTuber Business): Sales were ¥9.2bn (+11%) and operating profit ¥1.5bn (+124%). Growth was driven by expansion of the Production Business, which entered the black on a quarterly basis for the first time in Q4, ahead of the original plan. The Platform Business (REALITY, Inc.) posted record-high quarterly operating profit in Q4 with an operating margin of 34.2%.
Anime, Manga and Merchandising (AMM, former IP Business): Sales were ¥1.8bn (+4%) and operating profit -¥0.0bn (FY25: ¥0.3bn). The Anime Business remained solid while upfront investments in new businesses continued on schedule, and operating profit exceeded expectations. Mushoku Tensei: Jobless Reincarnation – Chronicle of Echoes, a game adaptation of an anime title in which the Anime Business has invested, surpassed 500,000 pre-registrations ahead of its July release.
AI: Sales were ¥8.7bn (+16%) and operating profit ¥1.7bn (+53%), driven by steady expansion of the B2B business. Operating profit greatly exceeded the forecast on progress in shifting to a recurring-earnings-type business structure and on cost optimization.
| Segment | Metric | FY26 Results | FY25 Results | YoY |
|---|---|---|---|---|
| Game | Sales | ¥29.4bn | ¥36.9bn | -20% |
| Game | Operating profit | ¥3.7bn | ¥4.6bn | -19% |
| LE | Sales | ¥9.2bn | ¥8.3bn | +11% |
| LE | Operating profit | ¥1.5bn | ¥0.7bn | +124% |
| AMM | Sales | ¥1.8bn | ¥1.7bn | +4% |
| AMM | Operating profit | -¥0.0bn | ¥0.3bn | -108% |
| AI | Sales | ¥8.7bn | ¥7.5bn | +16% |
| AI | Operating profit | ¥1.7bn | ¥1.1bn | +53% |
| Four Segments (including adjustment) | Sales | ¥48.7bn | ¥53.8bn | -9% |
| Four Segments (including adjustment) | Operating profit | ¥4.7bn | ¥5.3bn | -10% |
FY27 Earnings Forecast
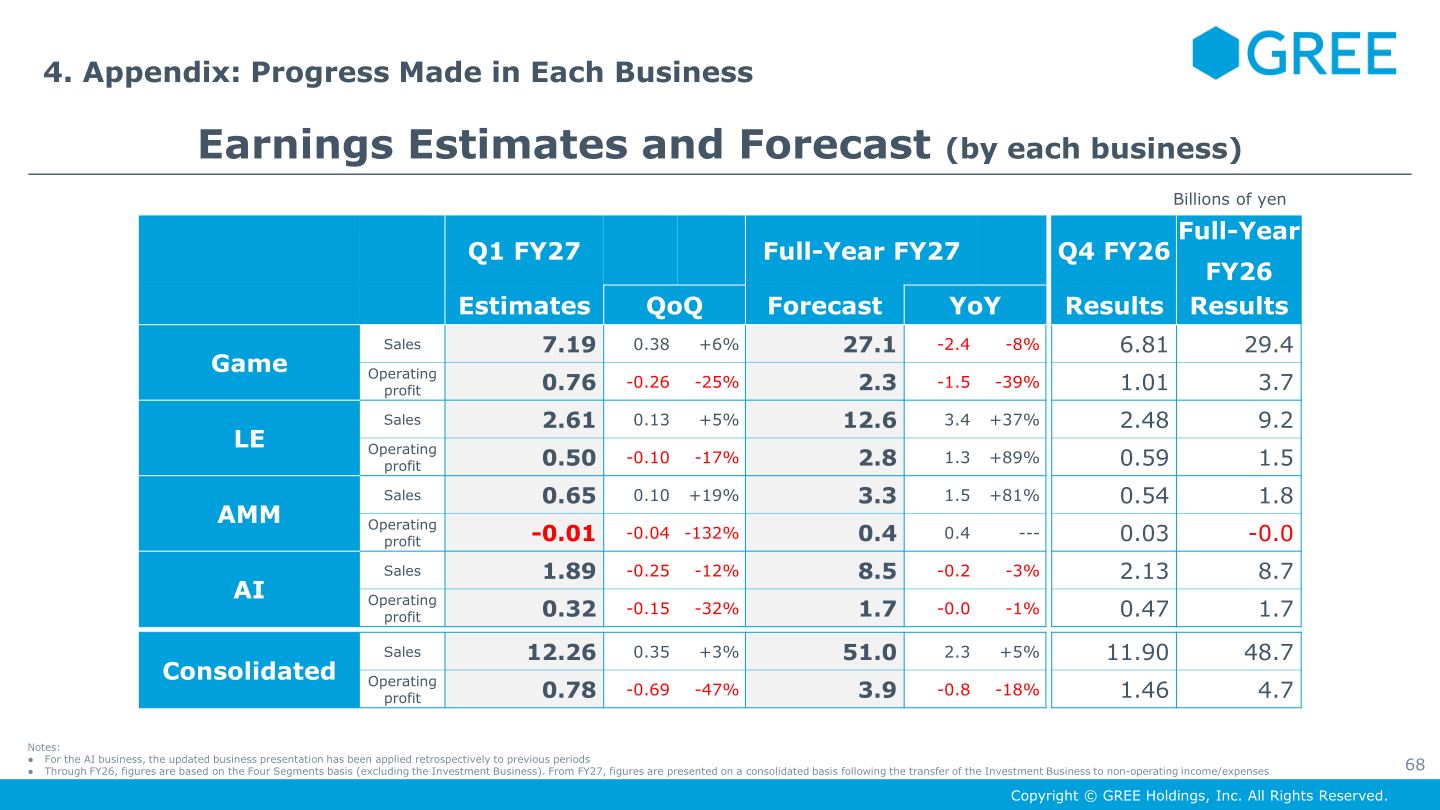
For FY27, the company forecasts consolidated net sales of ¥51.0 billion and operating profit of ¥3.9 billion. From FY27, figures are presented on a consolidated basis following the transfer of the Investment Business to non-operating income/expenses; FY26 comparisons are on the Four Segments basis. The company expects profit to decline because it has revised the launch timing of a major third-party IP title in the Game Business to around end-FY27, while growth in the continuous growth businesses led by LE is expected to offset the cyclical nature of the Game Business. These continuous growth businesses are expected to account for around 70% of operating profit in FY27. The console title Another Eden Begins is scheduled for release in September 2026.
| Segment | Metric | FY27 Forecast (bn yen) | YoY | FY26 Results (bn yen) |
|---|---|---|---|---|
| Game | Sales | 27.1 | -8% | 29.4 |
| Game | Operating profit | 2.3 | -39% | 3.7 |
| LE | Sales | 12.6 | +37% | 9.2 |
| LE | Operating profit | 2.8 | +89% | 1.5 |
| AMM | Sales | 3.3 | +81% | 1.8 |
| AMM | Operating profit | 0.4 | — | -0.0 |
| AI | Sales | 8.5 | -3% | 8.7 |
| AI | Operating profit | 1.7 | -1% | 1.7 |
| Consolidated (FY26: Four Segments basis) | Sales | 51.0 | +5% | 48.7 |
| Consolidated (FY26: Four Segments basis) | Operating profit | 3.9 | -18% | 4.7 |
For Q1 FY27, the company estimates consolidated sales of 12.26 billion yen and operating profit of 0.78 billion yen, expecting a temporary decline in profit due to the absence of development support payments posted in Q4 and increased investment in new title development.
Shareholder Returns
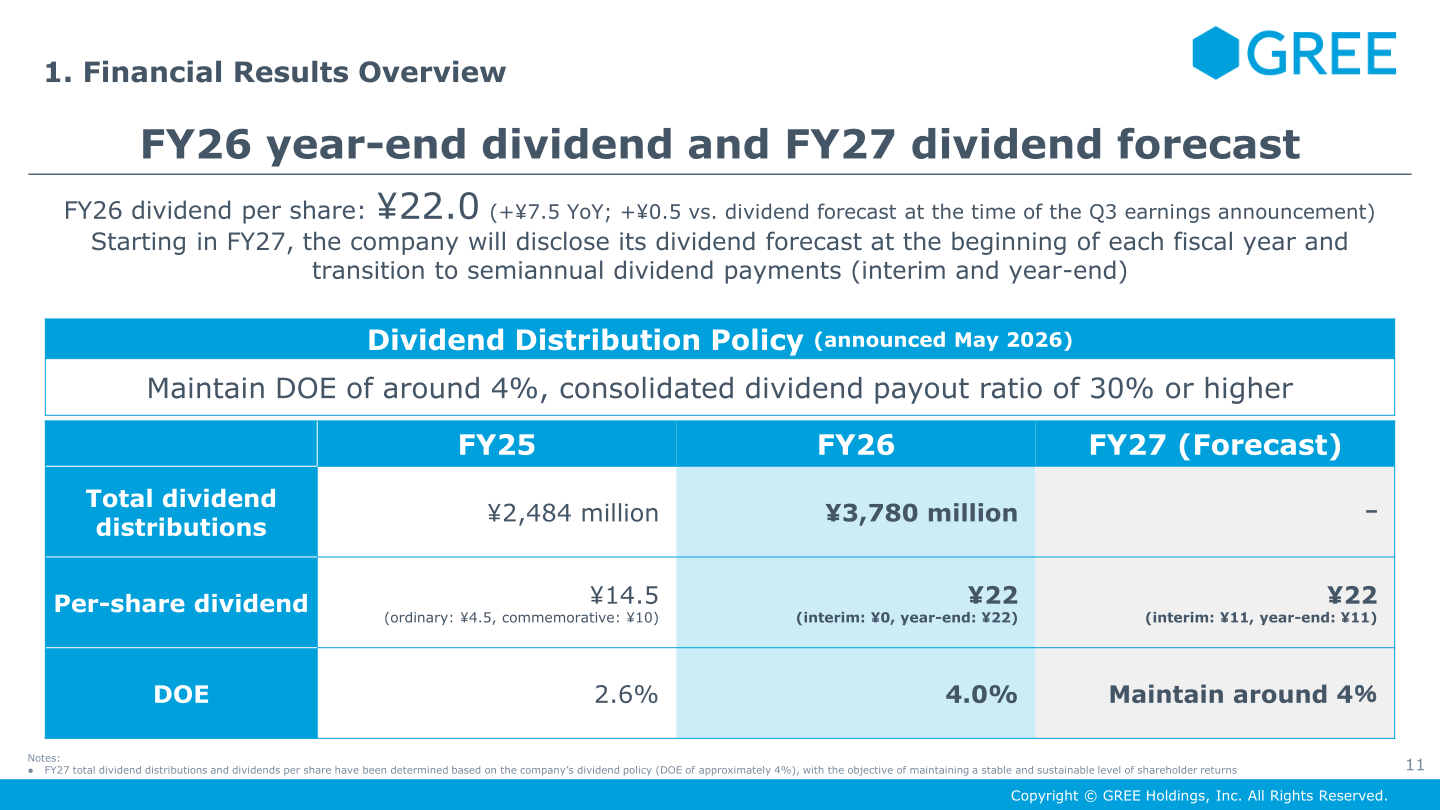
The FY26 dividend per share is ¥22.0, up ¥7.5 year on year and ¥0.5 above the dividend forecast at the time of the Q3 earnings announcement. Under the dividend distribution policy announced in May 2026, the company aims to maintain DOE of around 4% and a consolidated dividend payout ratio of 30% or higher. Starting in FY27, it will disclose its dividend forecast at the beginning of each fiscal year and transition to semiannual dividend payments (interim and year-end).
| Item | FY25 | FY26 | FY27 (Forecast) |
|---|---|---|---|
| Total dividend distributions | ¥2,484 million | ¥3,780 million | – |
| Per-share dividend | ¥14.5 (ordinary: ¥4.5, commemorative: ¥10) | ¥22 (interim: ¥0, year-end: ¥22) | ¥22 (interim: ¥11, year-end: ¥11) |
| DOE | 2.6% | 4.0% | Maintain around 4% |
Medium-Term Targets
The company updated its medium-term targets on August 7, 2026. Sales targets are ¥58.6 billion for FY28 and ¥67.4 billion for FY29, with operating profit targets of ¥10.4 billion for FY28 and ¥13.4 billion for FY29, implying a profit CAGR of 85% for FY27-FY29. The targets were partially revised downward from the previous plan (announced August 6, 2025) because of the revised launch timing of the major third-party IP title; the company expects a return to strong growth from FY28, driven by the continuous growth businesses and new hit titles. It also plans to formulate and announce a capital policy that includes capital allocation during FY27.
The company has set fiscal discipline targets of an equity ratio of at least 60% and an interest-bearing debt to EBITDA ratio of 6x or lower. At the end of FY26, consolidated total net assets were 96.8 billion yen, cash and cash equivalents 74.2 billion yen, interest-bearing debt 16.7 billion yen and net cash 57.5 billion yen.
This article is an analysis based on publicly available information and is not a recommendation to buy or sell any specific securities. Investment decisions are your own responsibility.
















