
This article is based on publicly available IR materials and is not a recommendation to buy or sell any specific securities.
Note: TSI Holdings’ fiscal year ends in February. This article classifies the fiscal year ended February 28, 2026 (labeled “FY2026” in the company’s materials, covering March 1, 2025 to February 28, 2026) as FY2025 under this site’s convention; the body text and tables below keep the company’s own labels.
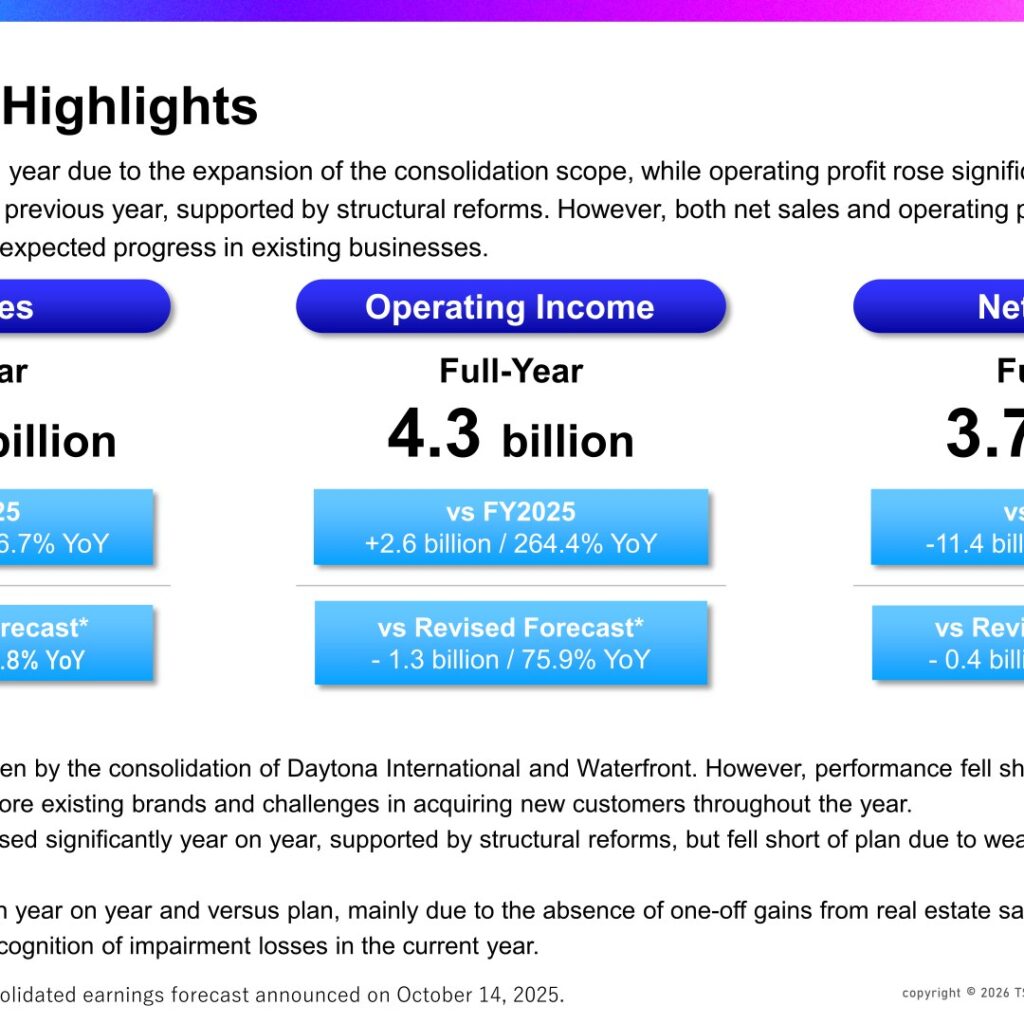
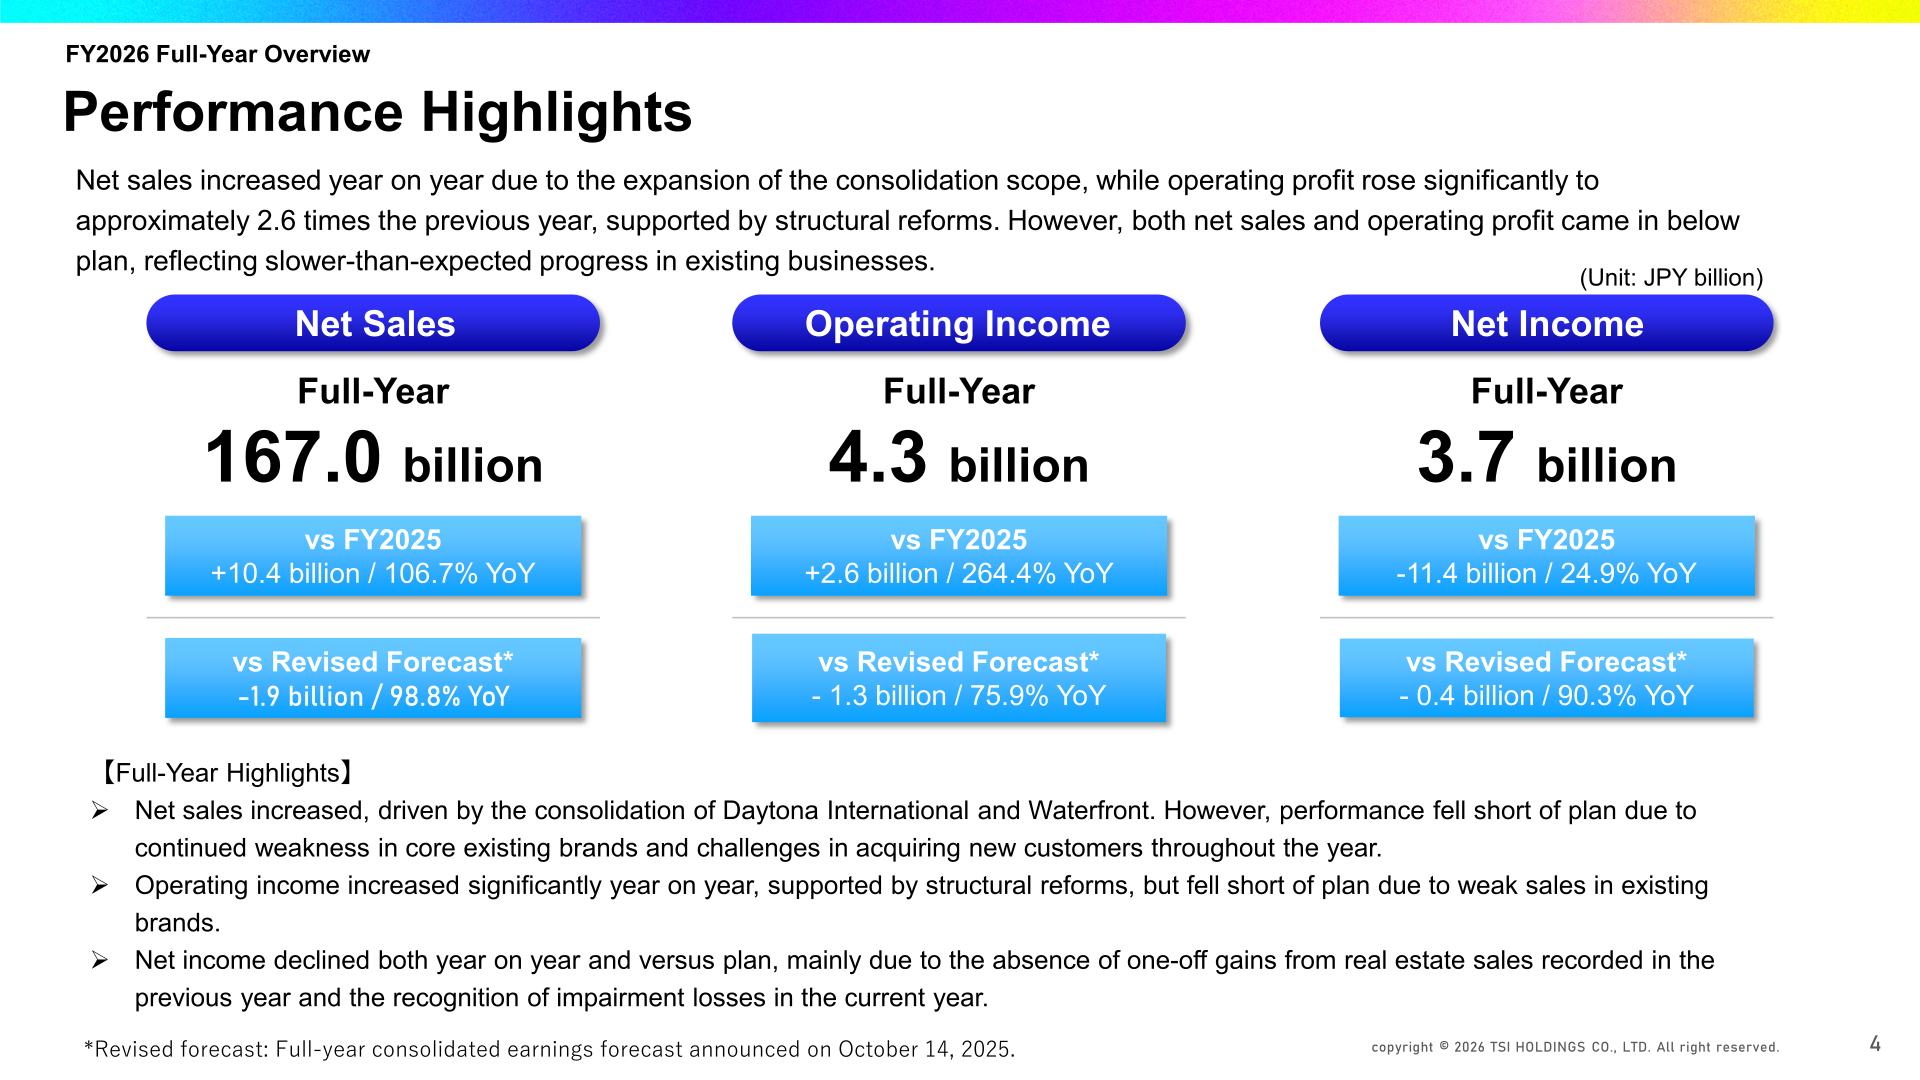
TSI HOLDINGS CO., LTD. (3608), an apparel group operating brands such as MARGARET HOWELL, NANO universe, AVIREX and PEARLY GATES, reported FY2026 net sales of 167,085 million yen (106.7% YoY), operating income of 4,325 million yen (264.4% YoY) and profit attributable to owners of parent of 3,793 million yen (24.9% YoY). Net sales increased on the consolidation of Daytona International Co., Ltd. and Waterfront Co., Ltd., while operating income rose to approximately 2.6 times the previous year, supported by structural reforms. However, both net sales and operating income came in below plan, reflecting slower-than-expected progress in existing businesses. For FY2027, the company forecasts net sales of 200.0 billion yen and operating income of 7.5 billion yen, and plans a record-high annual dividend of ¥70 per share.
Consolidated Results (Full-Year Actual)
Against the revised forecast announced on October 14, 2025, net sales were short by 1.9 billion yen (98.8%), operating income by 1.3 billion yen (75.9%) and net income by 0.4 billion yen (90.3%). The company attributes the shortfall in net sales to continued weakness in core existing brands and challenges in acquiring new customers throughout the year. Excluding the impact of M&A, net sales were 90.4% YoY and SG&A expenses decreased to 92.1% YoY. In existing businesses, the gross profit margin improved by 2.4 percentage points, supported by supplier consolidation, pricing initiatives and supply-demand optimization measures.
| Item (Millions of yen) | FY Ended Feb. 2025 | FY Ended Feb. 2026 | YoY Change | YoY (%) |
|---|---|---|---|---|
| Net sales | 156,606 | 167,085 | 10,478 | 106.7 |
| Gross profit | 83,995 | 91,458 | 7,462 | 108.9 |
| SG&A expenses | 82,359 | 87,132 | 4,772 | 105.8 |
| Operating income | 1,636 | 4,325 | 2,689 | 264.4 |
| Ordinary income | 2,076 | 5,440 | 3,363 | 262.0 |
| Extraordinary income | 25,350 | 3,470 | -21,879 | 13.7 |
| Extraordinary loss | 3,567 | 2,790 | -776 | 78.2 |
| Profit before taxes | 23,860 | 6,120 | -17,739 | 25.7 |
| Profit attributable to owners of parent | 15,230 | 3,793 | -11,437 | 24.9 |
| EBITDA | 5,269 | 9,678 | 4,408 | 183.7 |
In the operating income bridge, operating income of 1.6 billion yen in FY2025 was reduced by 4.0 billion yen of gross profit from divested businesses and 2.6 billion yen of gross profit from existing businesses, offset by +3.1 billion yen in variable costs, +5.2 billion yen from the impact of structural reforms and +1.0 billion yen from new businesses and M&A, resulting in 4.3 billion yen. The negative impact from lower revenue was approx. 3.5 billion yen, and operating income fell short of the plan (5.7 billion yen). EBITDA (operating income plus depreciation and amortization, including goodwill amortization) rose from 5.2 billion yen to 9.6 billion yen.
Below operating income, non-operating income, including dividend income, real estate income and foreign exchange gains, totaled approximately 1.1 billion yen, while interest expenses increased due to M&A-related borrowings. At the extraordinary level, the company recorded net income on sale of investment securities of 3.3 billion yen and impairment losses of 1.8 billion yen, including impairment losses on goodwill in the U.S. business. Net income declined mainly due to the absence of one-off gains from real estate sales recorded in the previous year and the recognition of impairment losses in the current year.
On the balance sheet, total assets rose to 174,204 million yen as of February 28, 2026 from 141,159 million yen a year earlier. Cash and deposits decreased to 28,478 million yen (61.5% YoY), which the company says reflects proactive investments in growth (including M&A) and shareholder returns after the previous year-end balance was elevated by real estate sale proceeds. Long-term borrowings increased to 31,621 million yen due to bank borrowings for working capital and M&A, and total net assets were 99,321 million yen. Share buybacks totaling 12.0 billion yen were executed in July 2025, and all treasury shares were retired as of the end of January 2026.
Sales by Channel and Brand
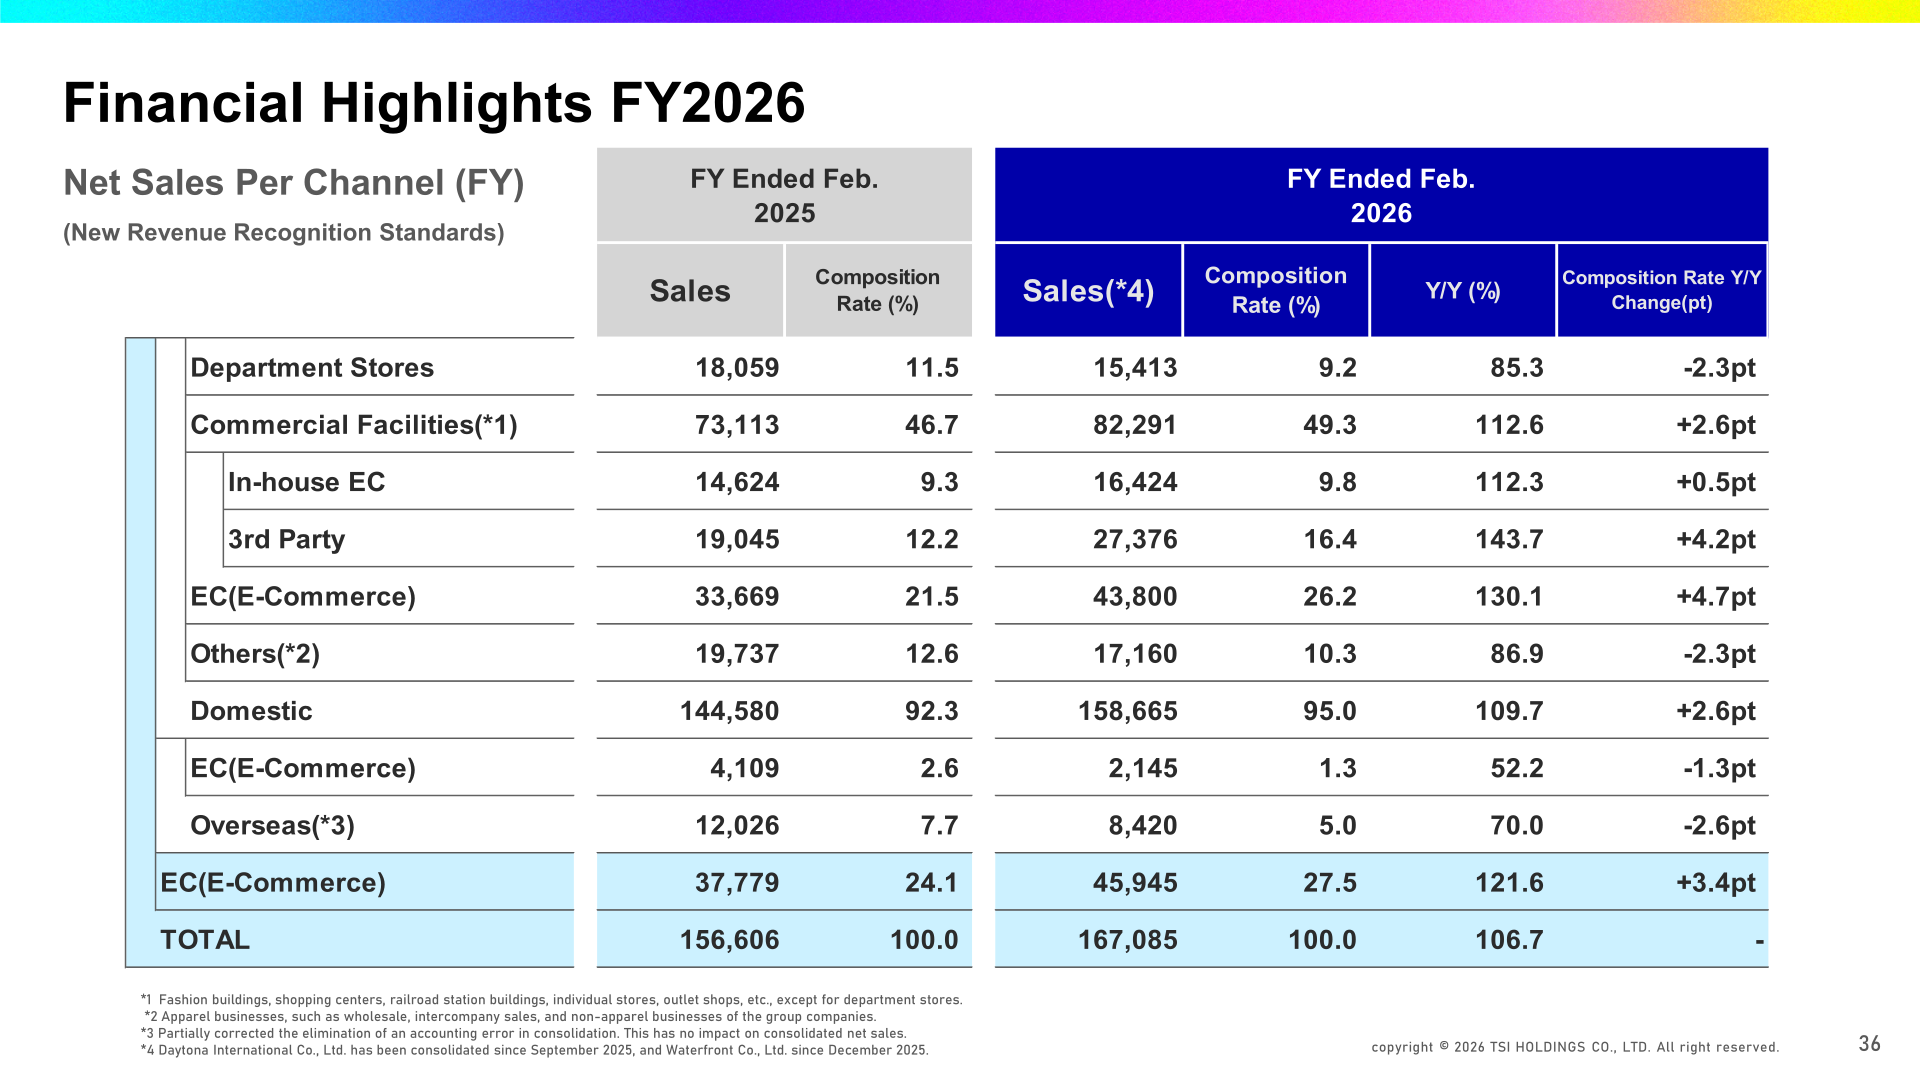
The company discloses results by sales channel and by brand rather than by business segment. Domestic e-commerce sales rose to 43,800 million yen (130.1% YoY), driven by Daytona International, which was consolidated from September, across both in-house and third-party EC channels; third-party EC sales rose to 143.7% YoY. Commercial facilities sales increased to 112.6% YoY, while department stores declined to 85.3% YoY due to the impact of divestments and store closures in the previous year. Overseas sales decreased to 70.0% YoY, reflecting continued weakness in the U.S. business and the impact of divestment.
| Channel (Millions of yen) | FY Ended Feb. 2025 | FY Ended Feb. 2026 | YoY (%) | Composition Rate Change (pt) |
|---|---|---|---|---|
| Department stores | 18,059 | 15,413 | 85.3 | -2.3pt |
| Commercial facilities | 73,113 | 82,291 | 112.6 | +2.6pt |
| In-house EC | 14,624 | 16,424 | 112.3 | +0.5pt |
| 3rd party EC | 19,045 | 27,376 | 143.7 | +4.2pt |
| Domestic EC | 33,669 | 43,800 | 130.1 | +4.7pt |
| Others (domestic) | 19,737 | 17,160 | 86.9 | -2.3pt |
| Domestic | 144,580 | 158,665 | 109.7 | +2.6pt |
| Overseas | 12,026 | 8,420 | 70.0 | -2.6pt |
| Total EC | 37,779 | 45,945 | 121.6 | +3.4pt |
| Total | 156,606 | 167,085 | 106.7 | – |
By brand, FREAK’S STORE, consolidated from the second half, became the largest brand with sales of 25,074 million yen. AVIREX grew to 118.5% YoY, supported by its 50th anniversary collaboration projects, and Schott rose to 124.8% YoY. MARGARET HOWELL (96.0%), NANO universe (88.3%), PEARLY GATES (81.7%) and NATURAL BEAUTY BASIC (88.6%) declined, which the company attributes to lower customer traffic and store closures, although it notes an improving trend in average spending per customer. Domestic existing-store sales were 97.2% for the year, against 113.9% for all stores.
| Brand (Millions of yen) | FY Ended Feb. 2025 Sales | FY Ended Feb. 2026 Sales | Sales YoY (%) | FY Ended Feb. 2026 Gross Profit Ratio (%) |
|---|---|---|---|---|
| FREAK’S STORE | – | 25,074 | – | 48.0 |
| MARGARET HOWELL | 14,038 | 13,476 | 96.0 | 58.0 |
| NANO universe | 14,586 | 12,877 | 88.3 | 56.6 |
| AVIREX | 8,841 | 10,476 | 118.5 | 63.1 |
| PEARLY GATES | 11,577 | 9,454 | 81.7 | 53.4 |
| NATURAL BEAUTY BASIC | 10,428 | 9,242 | 88.6 | 64.6 |
| TOP10 total | 82,345 | 102,406 | 124.4 | 55.2 |
Progress of Structural Reforms
Structural reform initiatives contributed approximately 5.2 billion yen to operating income on a full-year basis: approx. 1.6 billion yen from purchase cost reductions and optimized supply/demand management (supplier and factory consolidation, relocation of production bases and standardized price analysis), approx. 0.9 billion yen from retail operation reform (area-based optimization of sales staff allocation), approx. 0.5 billion yen from e-commerce platform integration and system renewal, and approx. 2.2 billion yen from improving the efficiency of costs including SG&A (logistics cost optimization, cross-functional cost control and workforce optimization implemented in the previous fiscal year). The company says it will continue to refine these initiatives in the current fiscal year.
FY2027 Forecast
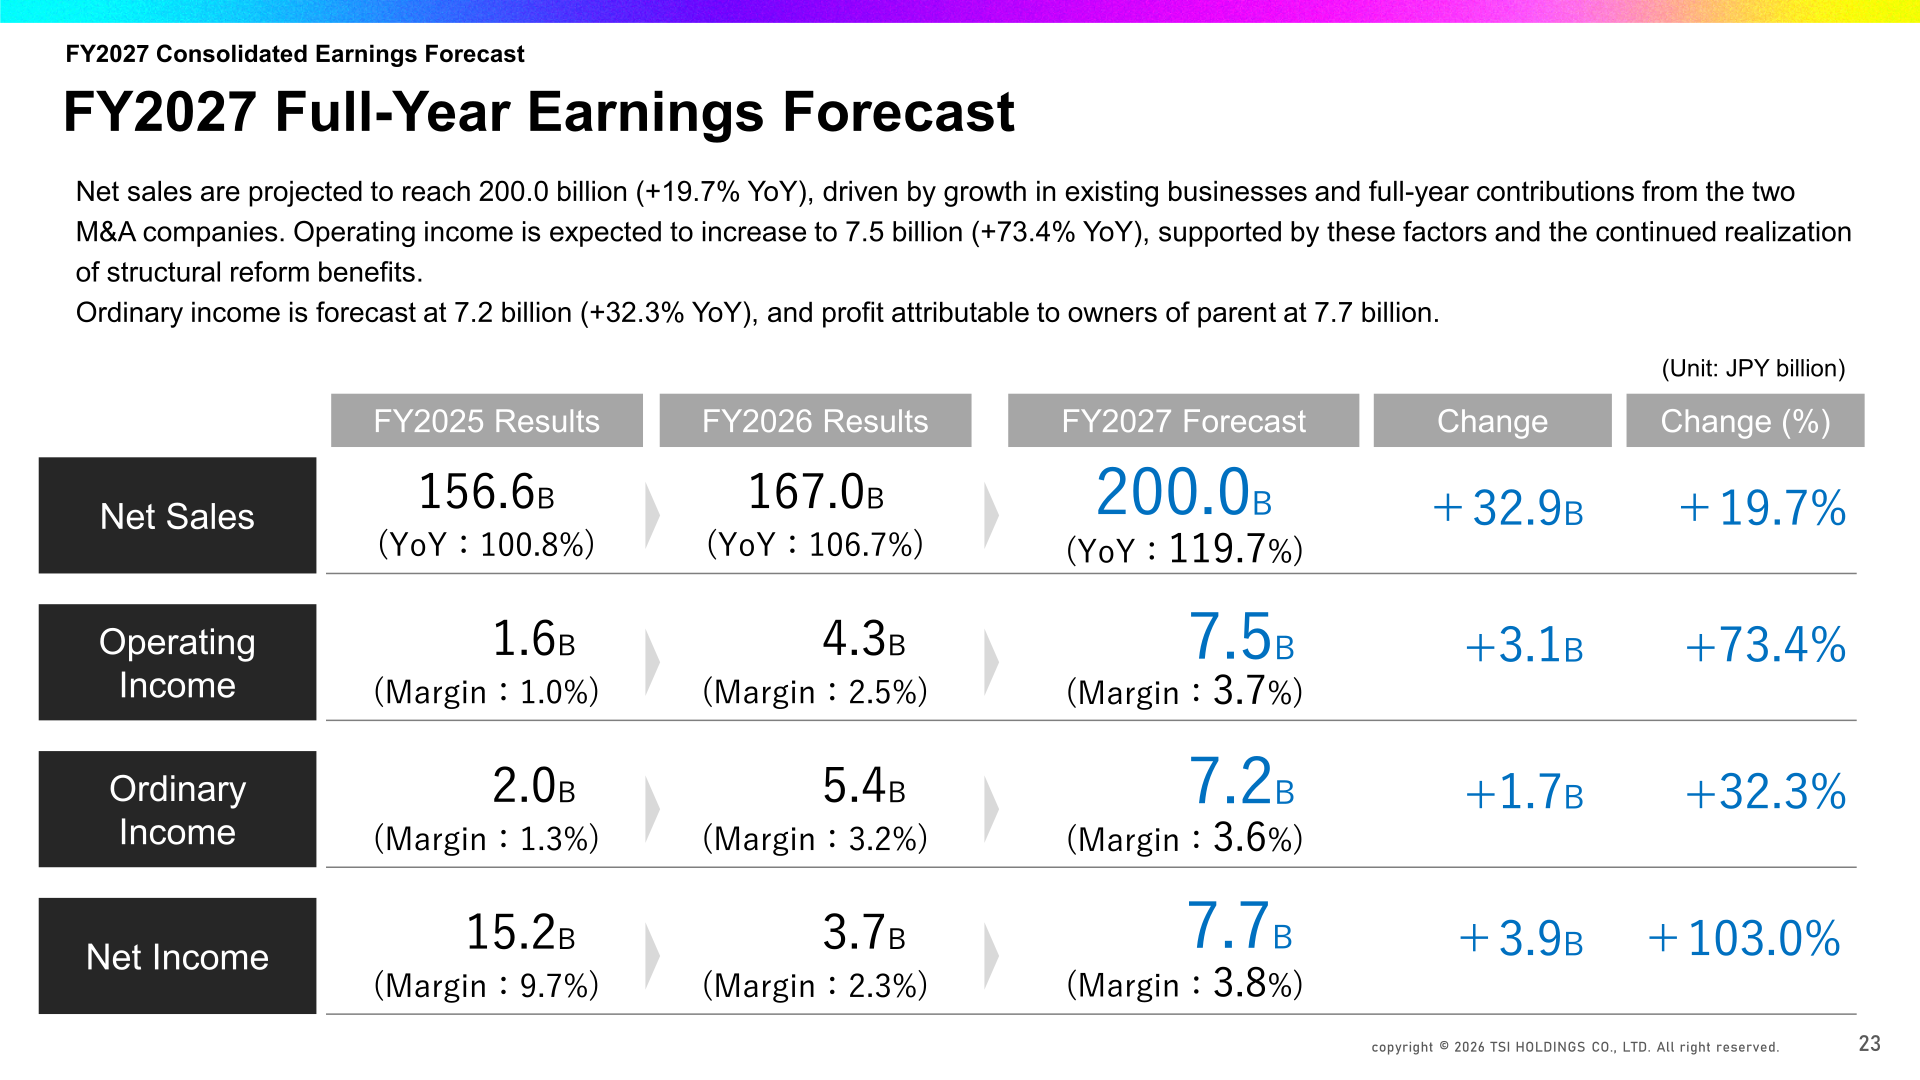
For FY2027, the company projects net sales of 200.0 billion yen (+19.7% YoY), driven by growth in existing businesses and full-year contributions from the two M&A companies. Operating income is expected to increase to 7.5 billion yen (+73.4% YoY), with business growth contributing +1.8 billion yen and structural reform benefits +1.9 billion yen, partly offset by -0.6 billion yen of strategic investments. Ordinary income is forecast at 7.2 billion yen (+32.3% YoY) and profit attributable to owners of parent at 7.7 billion yen (+103.0%).
| Item (Billions of yen) | FY2025 Results | FY2026 Results | FY2027 Forecast | Change | Change (%) |
|---|---|---|---|---|---|
| Net sales | 156.6 | 167.0 | 200.0 | +32.9 | +19.7% |
| Operating income | 1.6 | 4.3 | 7.5 | +3.1 | +73.4% |
| Ordinary income | 2.0 | 5.4 | 7.2 | +1.7 | +32.3% |
| Net income | 15.2 | 3.7 | 7.7 | +3.9 | +103.0% |
Under its medium-term management plan TIP27, the company expects to achieve its final-year targets for net sales (current forecast 200.0 billion yen vs. target 165.0 billion yen), net income (7.7 billion yen), ROE (8.0%) and DOE (4.0%). However, reflecting the recent decline in sales in existing businesses, the operating income target of 10.0 billion yen will be revised, with the current forecast at 7.5 billion yen, and the operating margin is forecast at 3.8% against the 6.0% target. The company explains that existing business sales are approximately 10.0 billion yen short of the TIP27 target, with a full recovery not assumed in the FY2027 forecast, while structural reform benefits are expected to be broadly in line with the TIP27 plan.
Shareholder Returns
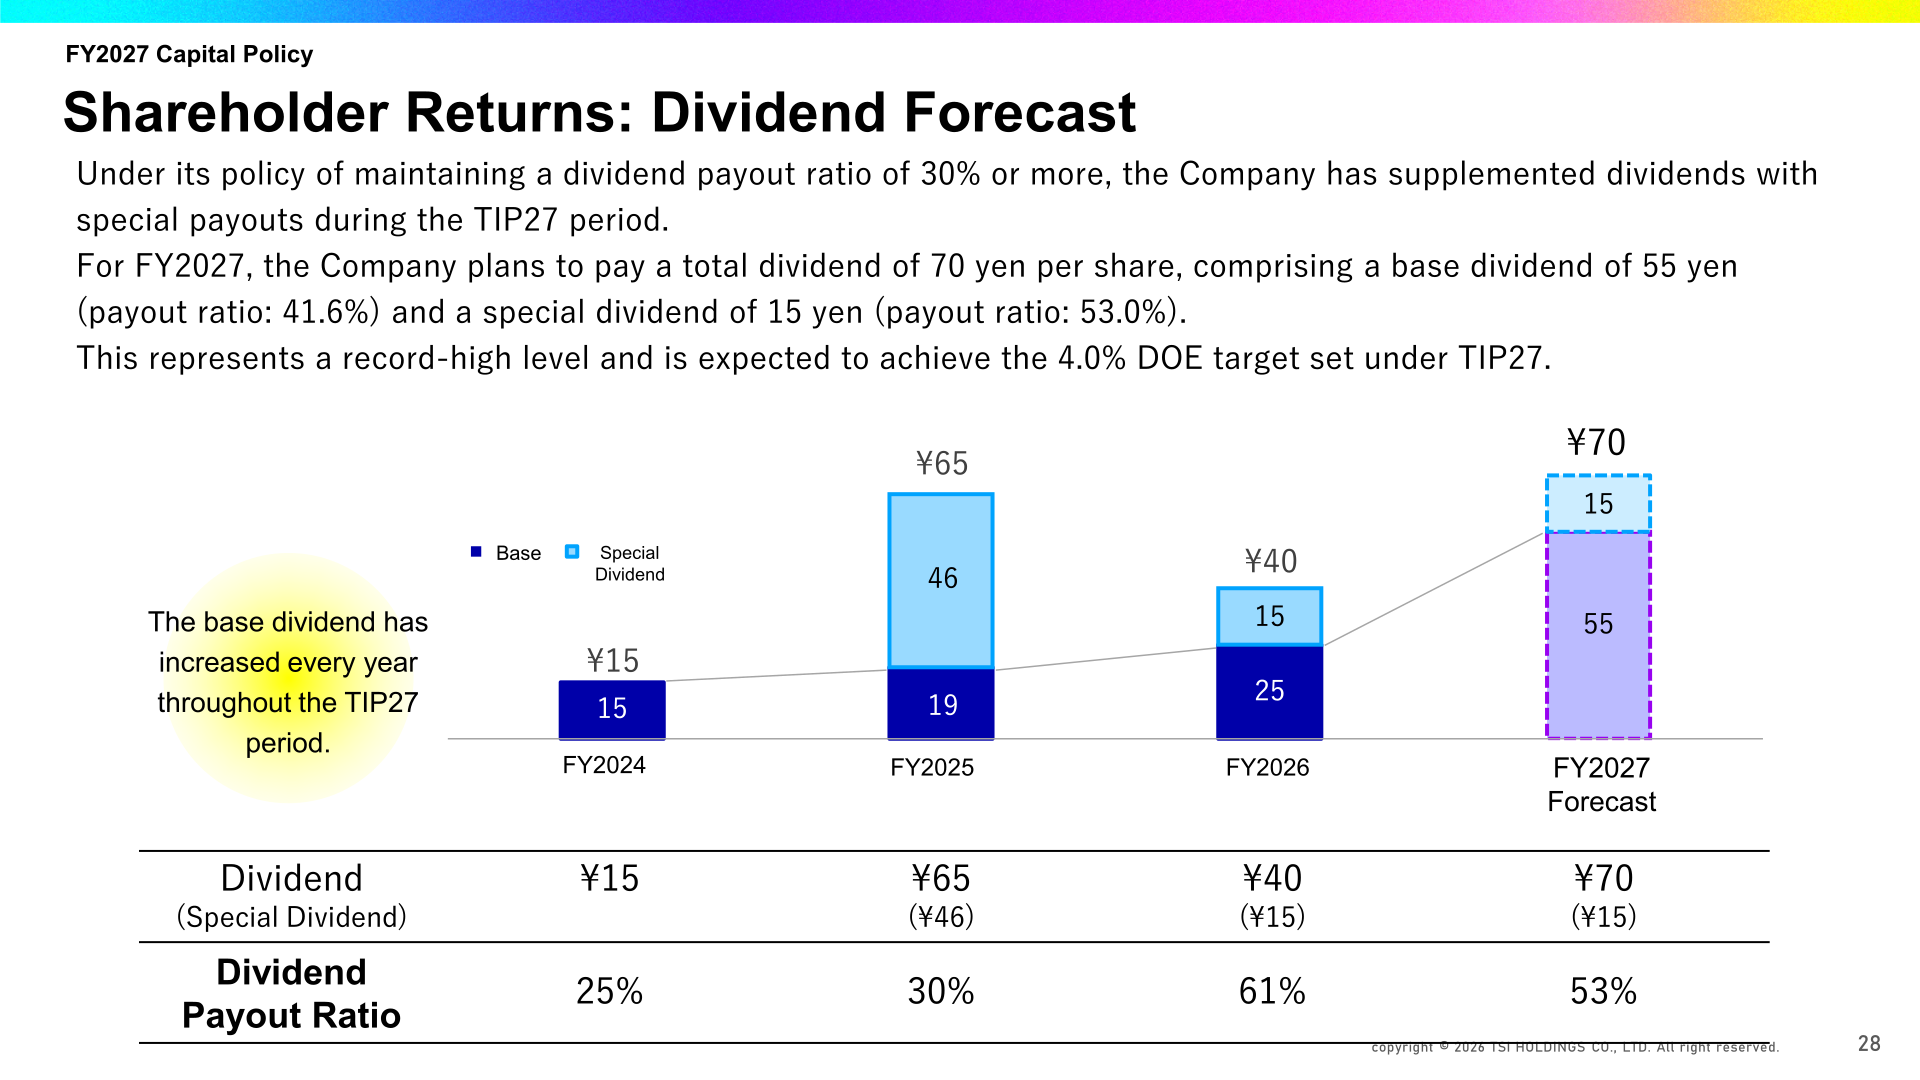
Under its policy of maintaining a dividend payout ratio of 30% or more, the company has supplemented dividends with special payouts during the TIP27 period. For FY2027, it plans a total dividend of 70 yen per share, comprising a base dividend of 55 yen (payout ratio: 41.6%) and a special dividend of 15 yen (payout ratio: 53.0%), which it describes as a record-high level expected to achieve the 4.0% DOE target set under TIP27. The company has also announced a share buyback program of up to 3.0 billion yen (maximum 3,300,000 shares) with an acquisition period of April 13 – October 30, 2026. Including this program, cumulative share buybacks over the three-year period are expected to reach 20.7 billion yen, against the original TIP27 target of 10.0 billion yen or more.
| Dividend per share | FY2024 | FY2025 | FY2026 | FY2027 (Forecast) |
|---|---|---|---|---|
| Total dividend | ¥15 | ¥65 | ¥40 | ¥70 |
| of which special dividend | – | ¥46 | ¥15 | ¥15 |
| Dividend payout ratio | 25% | 30% | 61% | 53% |
Topics: M&A, mix.tokyo and the TSI Foundation
The company has agreed to acquire 100% of the shares of Toyo Enterprise Co., Ltd., a long-established American casual wear manufacturer operating brands including TAILOR TOYO, SUGAR CANE and BUZZ RICKSON’S, with annual sales of approximately 4.4 billion yen. Details of the acquisition and its impact on performance will be disclosed promptly after closing. Its cross-brand platform mix.tokyo reached approximately one million registered members as of March 2026, and the February “Special Thanks Sale” delivered record-high customer traffic and sales. The company also resolved to establish the TSI Foundation for Future Fashion (planned for June 2026, with an annual budget of approximately ¥40 million), and 630,000 shares will be allocated in connection with its establishment.
This article is an analysis based on publicly available information and is not a recommendation to buy or sell any specific securities. Investment decisions are your own responsibility.
















