
This article is based on publicly available IR materials and is not a recommendation to buy or sell any specific securities.
Note: Kisoji does not publish an English results presentation; this article is an English translation of the Japanese-language article on our sister site Investalk, which is based on the company’s Japanese-language IR materials, with figures transcribed as reported. This site classifies the most recent completed fiscal year as FY2025, while the company’s materials label the period as the fiscal year ended March 31, 2026 (FY3/2026). Kisoji announced consolidated financial results for FY3/2026. Net sales were ¥54.5 billion (up 2.5% year on year) and operating profit was ¥2.9 billion (up 7.6%), marking the fifth consecutive year of higher sales and profit for both net sales and operating profit. The Kisoji, izakaya and Suzunoren formats performed steadily, and improved productivity and energy-saving measures absorbed the rise in labor costs, contributing to the profit increase. The financial base also strengthened, with the equity-to-asset ratio rising to 65.1% (up 0.3pt from the previous fiscal year-end).
Consolidated Results (FY3/2026 Actual)
Gross margin improved (+0.25 points) on a review of ingredient procurement and stronger sales of higher value-added items, while thorough shift management and energy-saving measures controlled costs and absorbed the rise in labor and utility costs, resulting in a 7.6% year-on-year increase in operating profit. Profit attributable to owners of parent for the fiscal year ended March 31, 2025 included a 1,310 million yen benefit from deferred tax adjustments.
| Item | FY3/2026 | FY3/2025 | Change |
|---|---|---|---|
| Net sales (million yen) | 54,570 | 53,229 | +2.5% |
| Operating profit (million yen) | 2,913 | 2,708 | +7.6% |
| Ordinary profit (million yen) | 2,929 | 2,754 | +6.3% |
| Profit attributable to owners of parent (million yen) | 1,728 | 3,166 | ▲45.4% |
Results by Restaurant Format
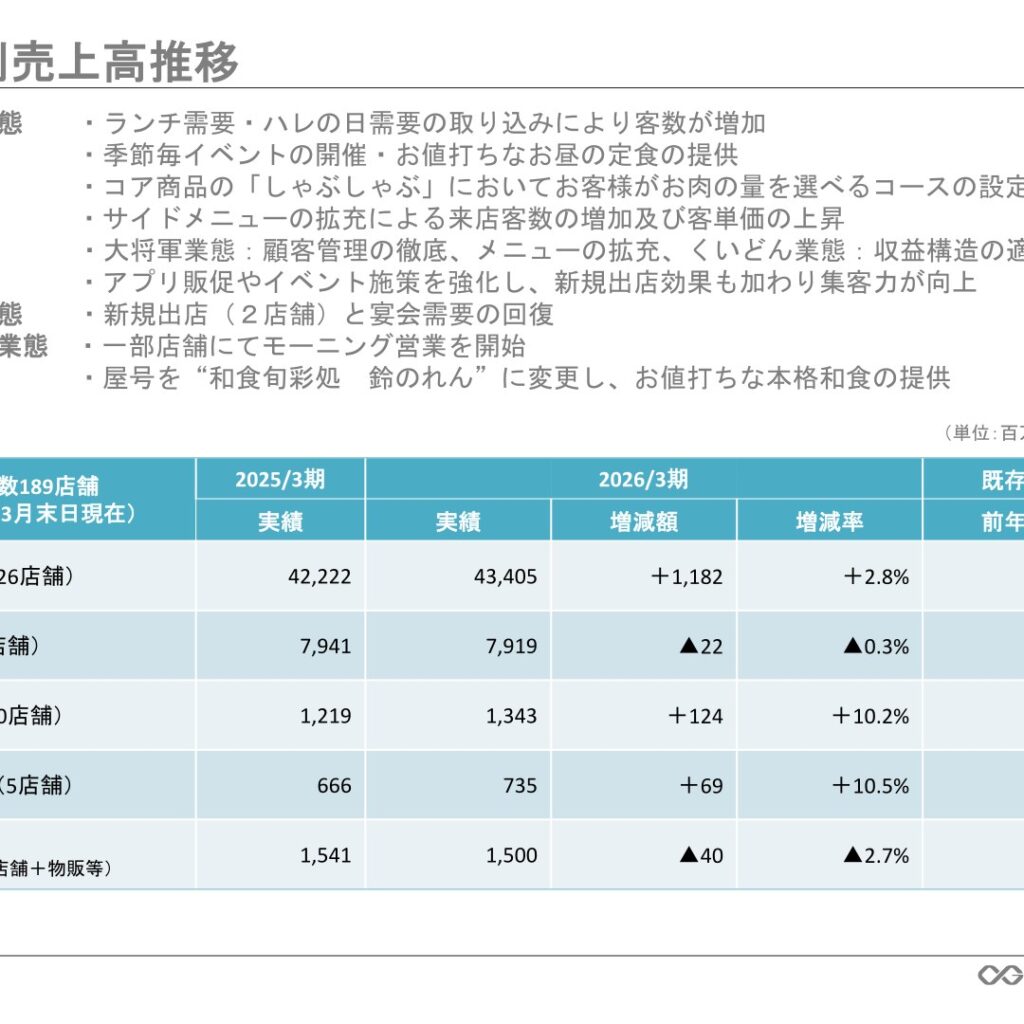
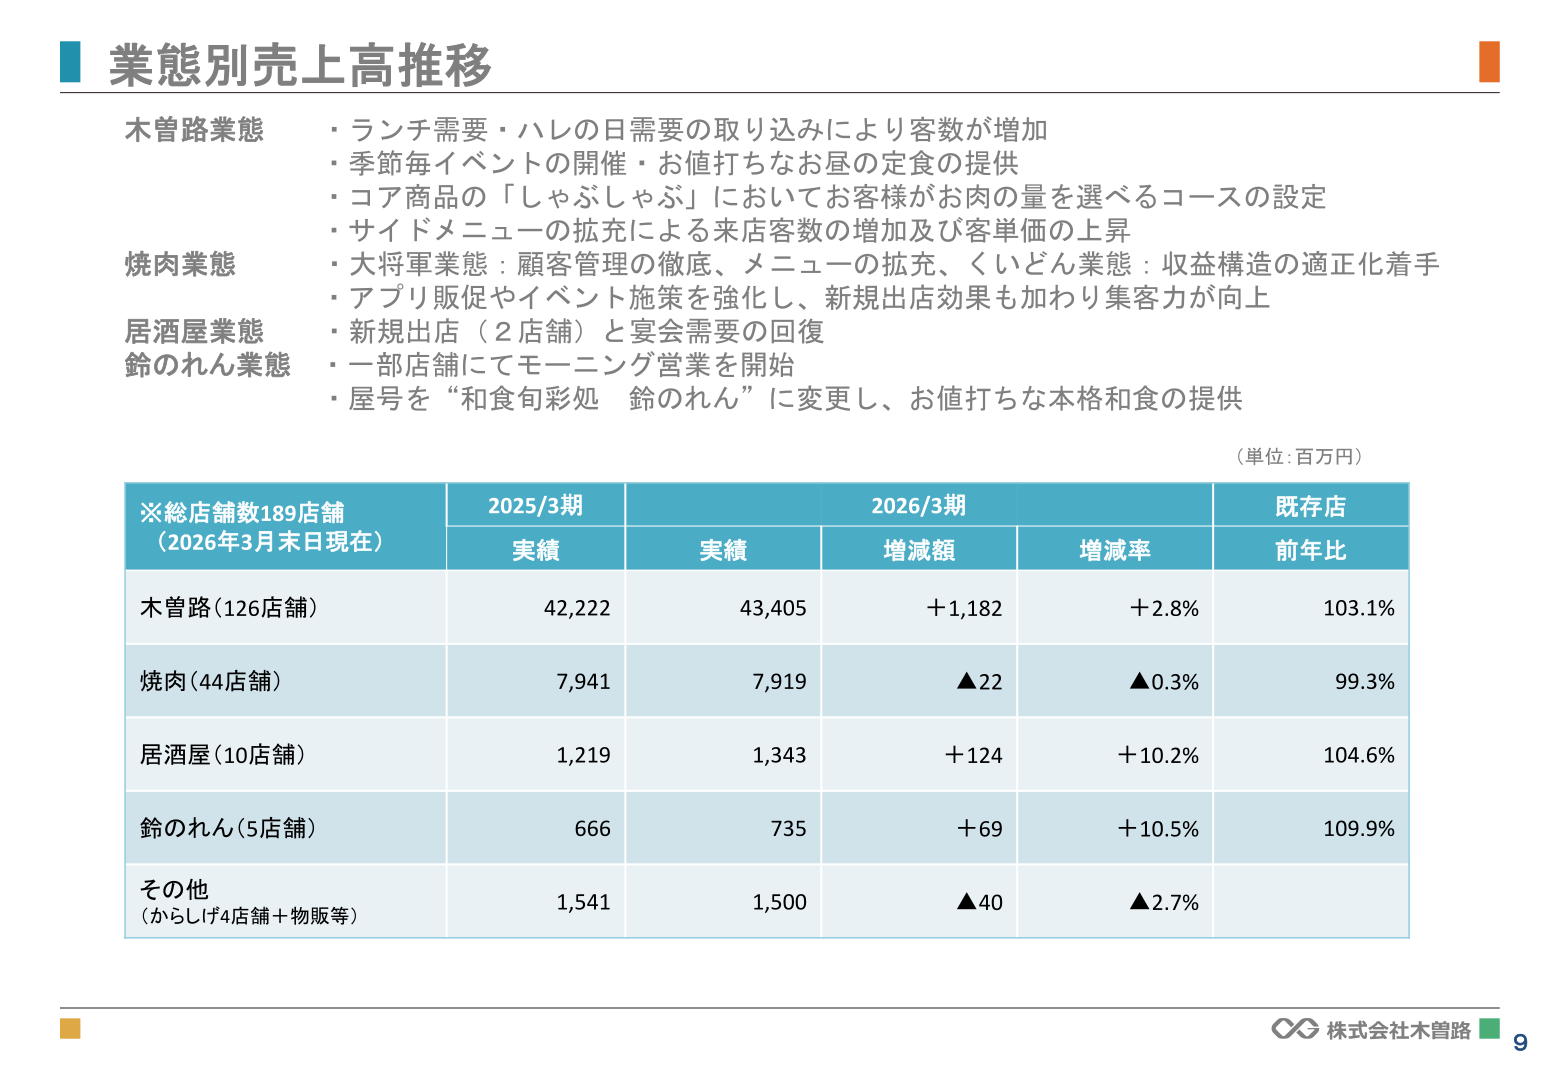
The Kisoji format increased sales on stronger lunch demand and special-occasion dining, together with a rise in average spend per customer (existing-store sales up 103.1% year on year). The izakaya format increased sales on two new store openings and a recovery in banquet demand (up 104.6%). The Suzunoren format increased sales, partly due to the start of morning service at some restaurants (up 109.9%). The yakiniku (grilled meat) format’s existing-store sales were roughly flat year on year.
| Format | FY3/2026 | FY3/2025 | Change |
|---|---|---|---|
| Kisoji (126 restaurants) | 43,405 | 42,222 | +2.8% |
| Yakiniku (44 restaurants) | 7,919 | 7,941 | ▲0.3% |
| Izakaya (10 restaurants) | 1,343 | 1,219 | +10.2% |
| Suzunoren (5 restaurants) | 735 | 666 | +10.5% |
| Other (Karashige, 4 restaurants, and merchandise sales, etc.) | 1,500 | 1,541 | ▲2.7% |
Full-Year Forecast
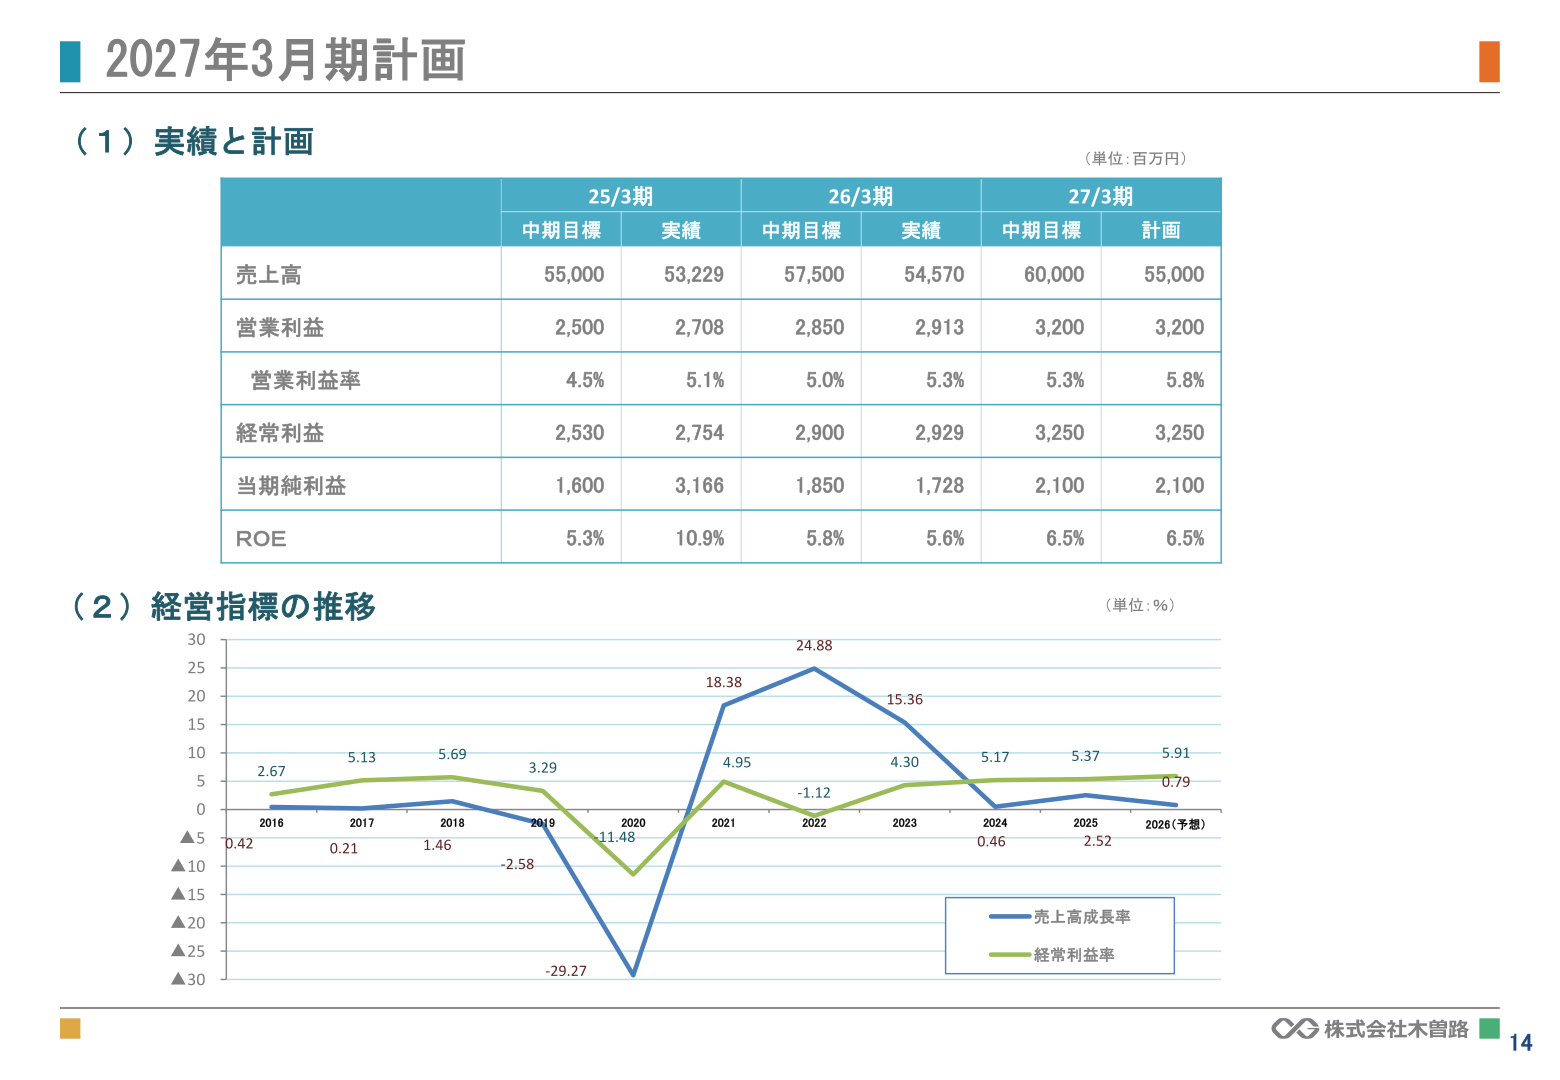
For FY3/2027, the company plans net sales of ¥55.0 billion (up 0.8% year on year), operating profit of ¥3.2 billion (up 9.8%), ordinary profit of ¥3.25 billion (up 11.0%), and profit attributable to owners of parent of ¥2.1 billion (up 21.5%). Under the final year of its medium-term plan (FY3/2027), the company’s target is net sales of ¥60.0 billion and operating profit of ¥3.2 billion.
| Item | FY3/2027 Plan | FY3/2026 Actual | Change |
|---|---|---|---|
| Net sales (million yen) | 55,000 | 54,570 | +0.8% |
| Operating profit (million yen) | 3,200 | 2,913 | +9.8% |
| Ordinary profit (million yen) | 3,250 | 2,929 | +11.0% |
| Profit attributable to owners of parent (million yen) | 2,100 | 1,728 | +21.5% |
Capital Expenditure
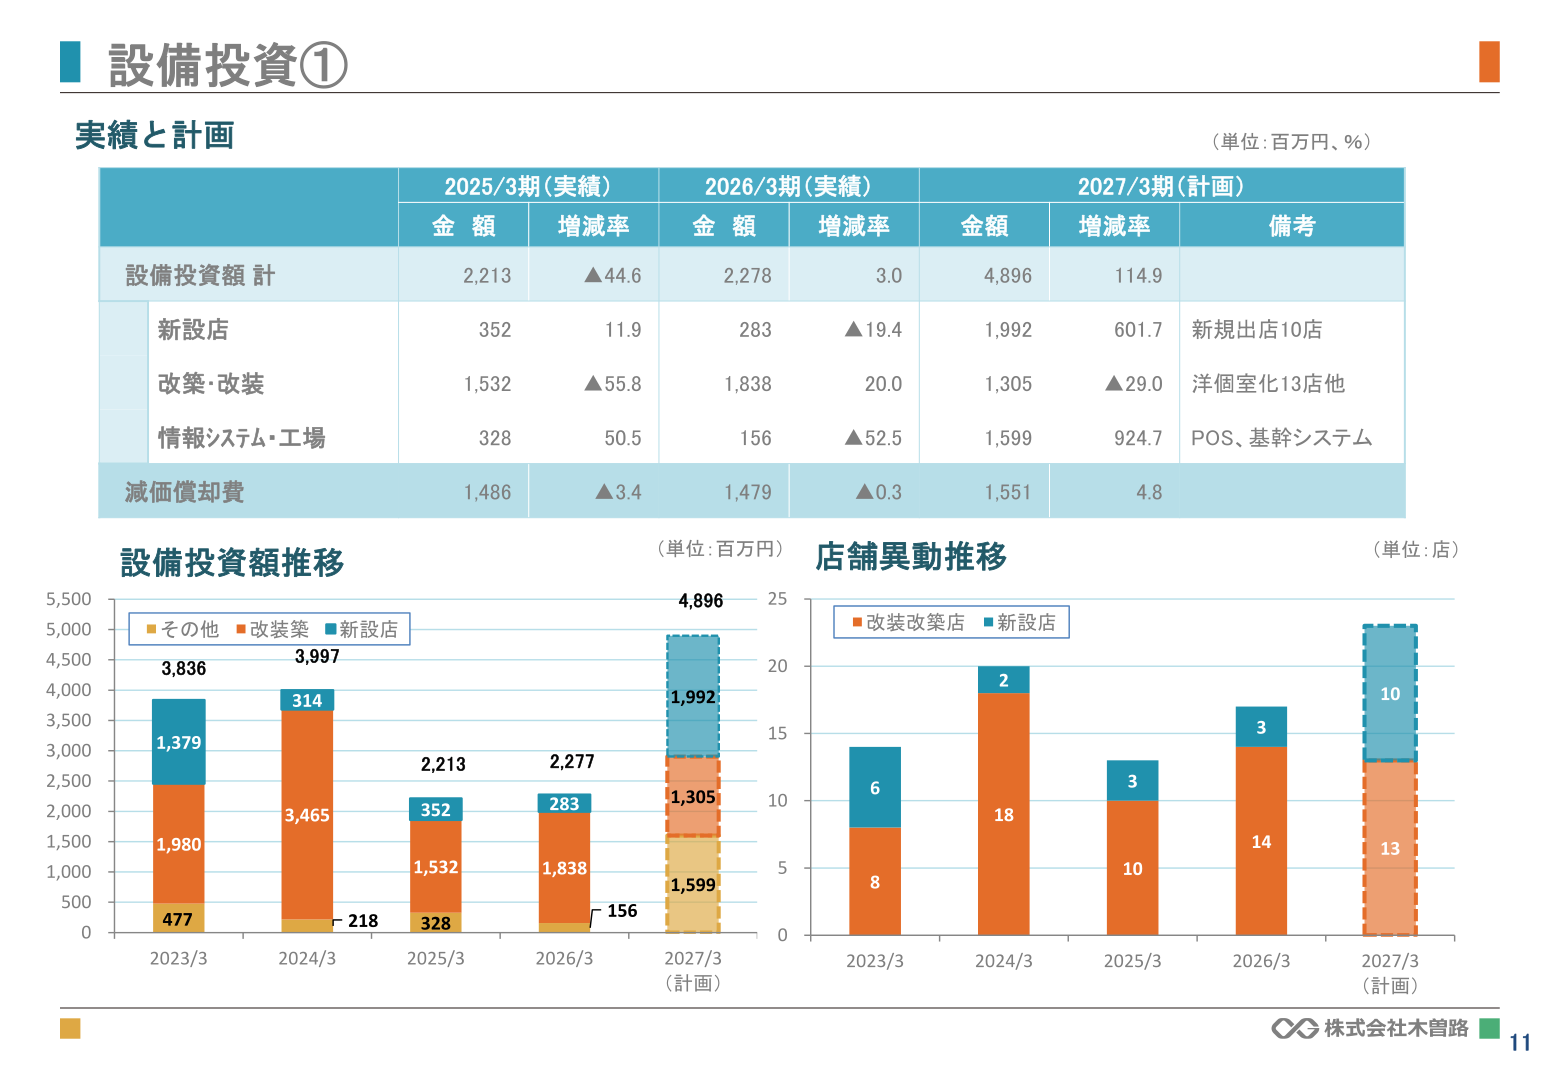
Capital expenditure for FY3/2026 was 2,278 million yen (up 3.0% year on year). The company opened 3 new restaurants and rebuilt or renovated 16 restaurants, and actively carried out major repairs of roughly 100 million yen per year aimed at strengthening the yakiniku business, along with upgrades to energy-saving equipment. For FY3/2027, the company plans capital expenditure of 4,896 million yen (up 114.9%), including 10 new store openings.
Shareholder Returns
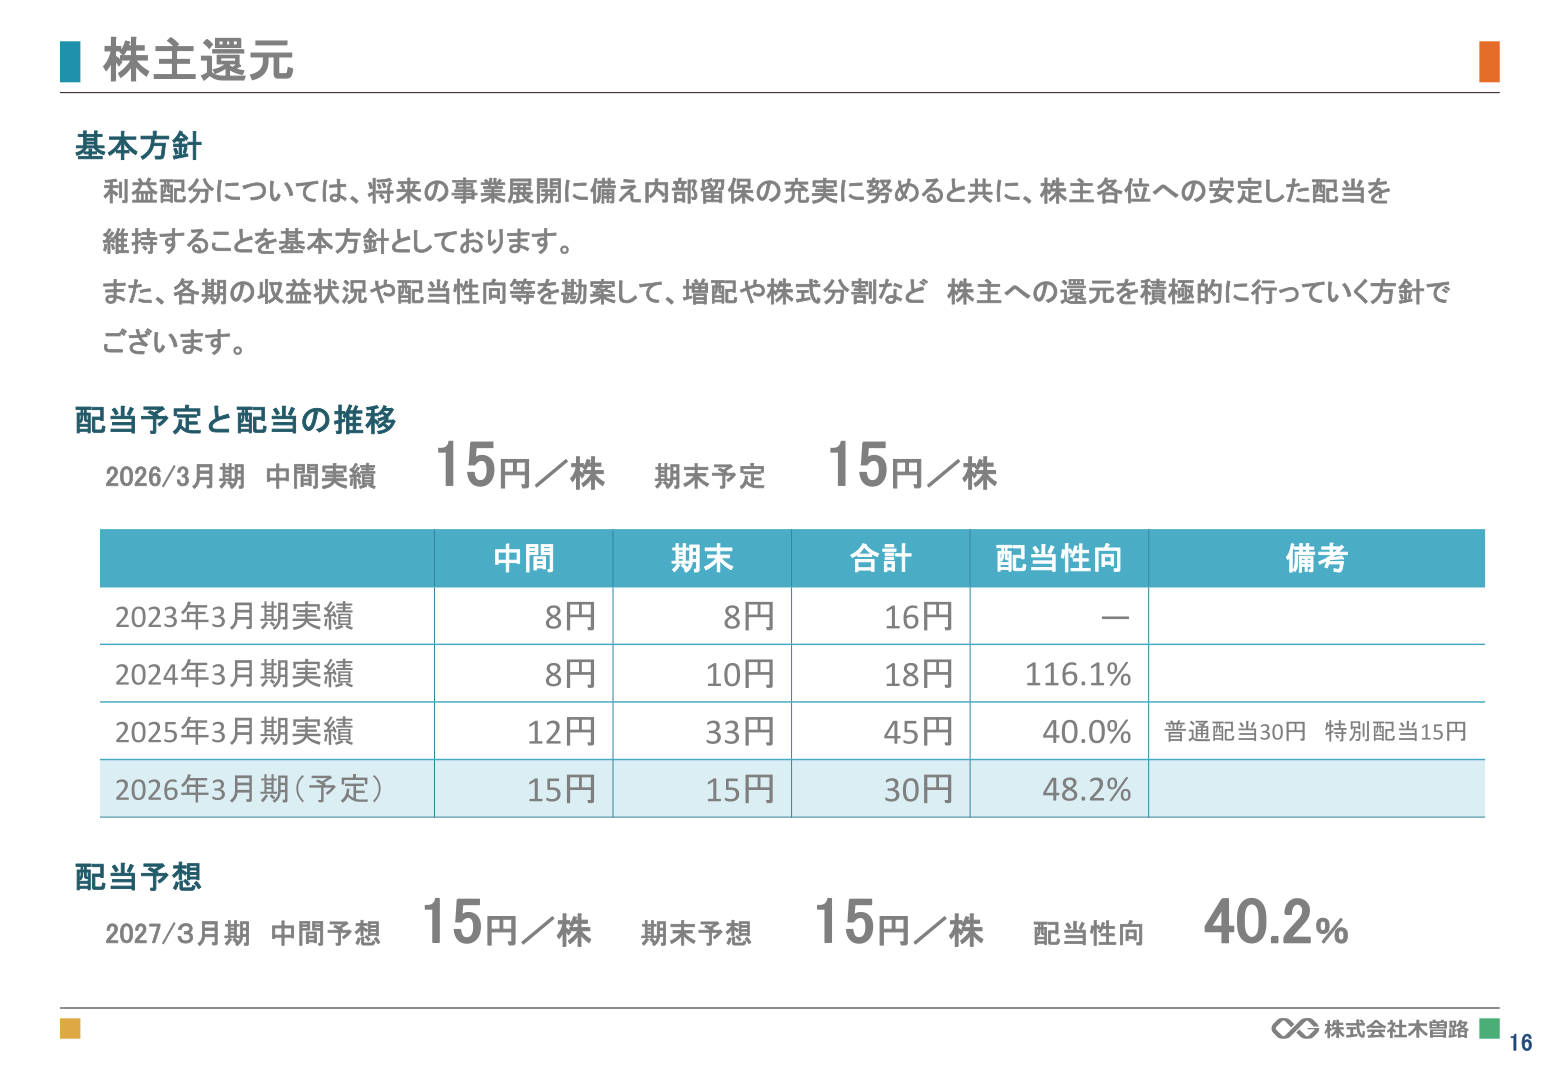
For FY3/2026, the company plans an annual dividend of 30 yen per share, comprising an interim dividend of 15 yen and a year-end dividend of 15 yen (payout ratio of 48.2%). For FY3/2027, it forecasts the same annual dividend of 30 yen (interim 15 yen, year-end 15 yen), with a payout ratio of 40.2%. Its basic policy on profit distribution is to build up retained earnings for future business development while maintaining stable dividends to shareholders, and it aims to actively return value to shareholders — including dividend increases and stock splits — taking into account earnings conditions in each period.
| Period | Interim | Year-End | Total | Payout Ratio |
|---|---|---|---|---|
| FY3/2025 Actual | 12 yen | 33 yen | 45 yen | 40.0% |
| FY3/2026 Planned | 15 yen | 15 yen | 30 yen | 48.2% |
| FY3/2027 Forecast | 15 yen | 15 yen | 30 yen | 40.2% |
This article is an analysis based on publicly available information and is not a recommendation to buy or sell any specific securities. Investment decisions are your own responsibility.
















