
This article is based on publicly available IR materials and is not a recommendation to buy or sell any specific securities.
Note: &Do Holdings has a June fiscal year-end. This article covers the fiscal year ended June 2026 (FY6/26), its most recently completed full fiscal year, which this site classifies as FY2025; labels in the text and tables follow the company’s materials (FY6/25, FY6/26, FY6/27).
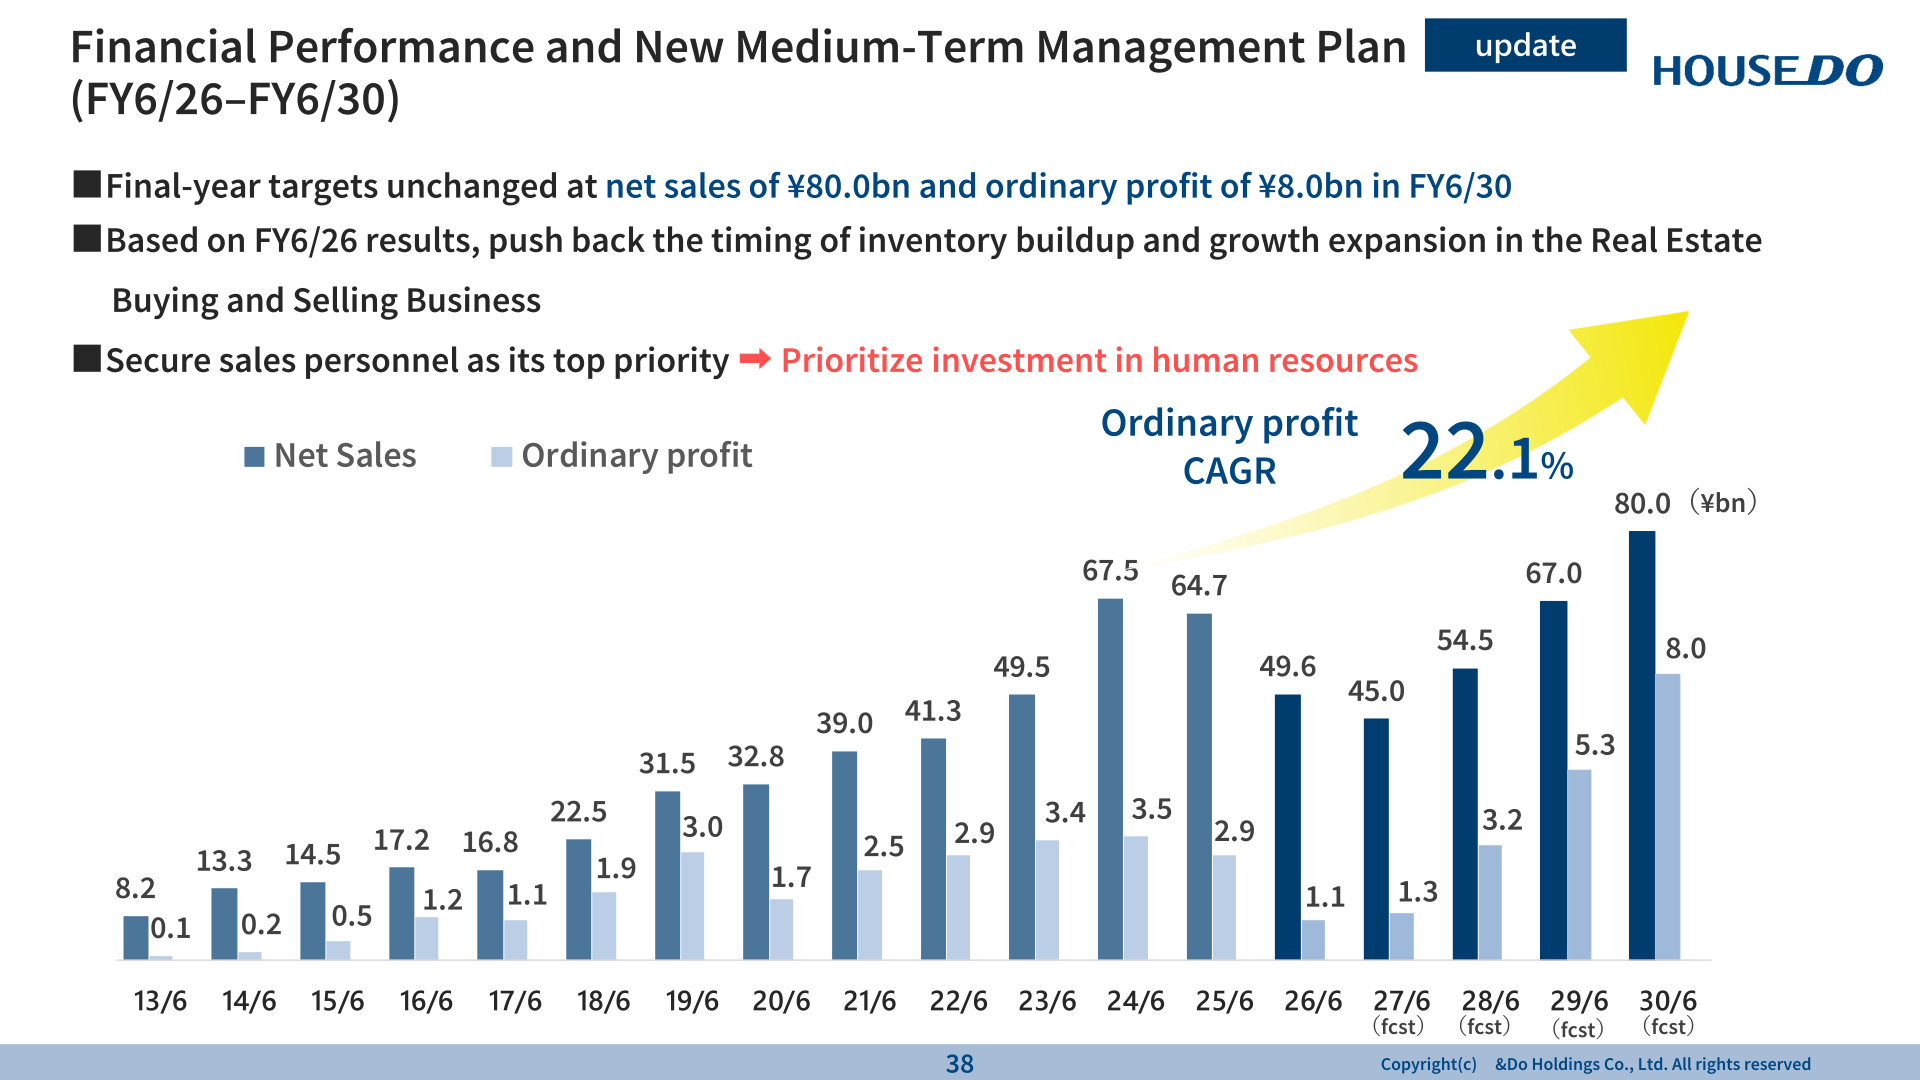
On August 14, 2026, &Do Holdings Co., Ltd. (HOUSE DO) released its “Earnings Results for the Fiscal Year Ended June 2026.” Net sales were 49,617 million yen (-23.4% YoY), operating profit 1,120 million yen (-57.3%), ordinary profit 1,120 million yen (-61.9%) and profit 1,452 million yen (-38.0%). Against the initial plan (net sales 55,000 million yen, operating profit 2,900 million yen, ordinary profit 3,000 million yen, profit 2,772 million yen), achievement rates were 90.2%, 38.6%, 37.3% and 52.4%, respectively. The company states that portfolio restructuring progressed steadily, but results fell below plan due to hiring investment in the growth-driving Real Estate Buying and Selling Business and a larger-than-expected earnings decline in the downsized House-Leaseback Business. Medium-term plan policies and targets remain unchanged, while the process for achieving them will be revised in line with the business environment.
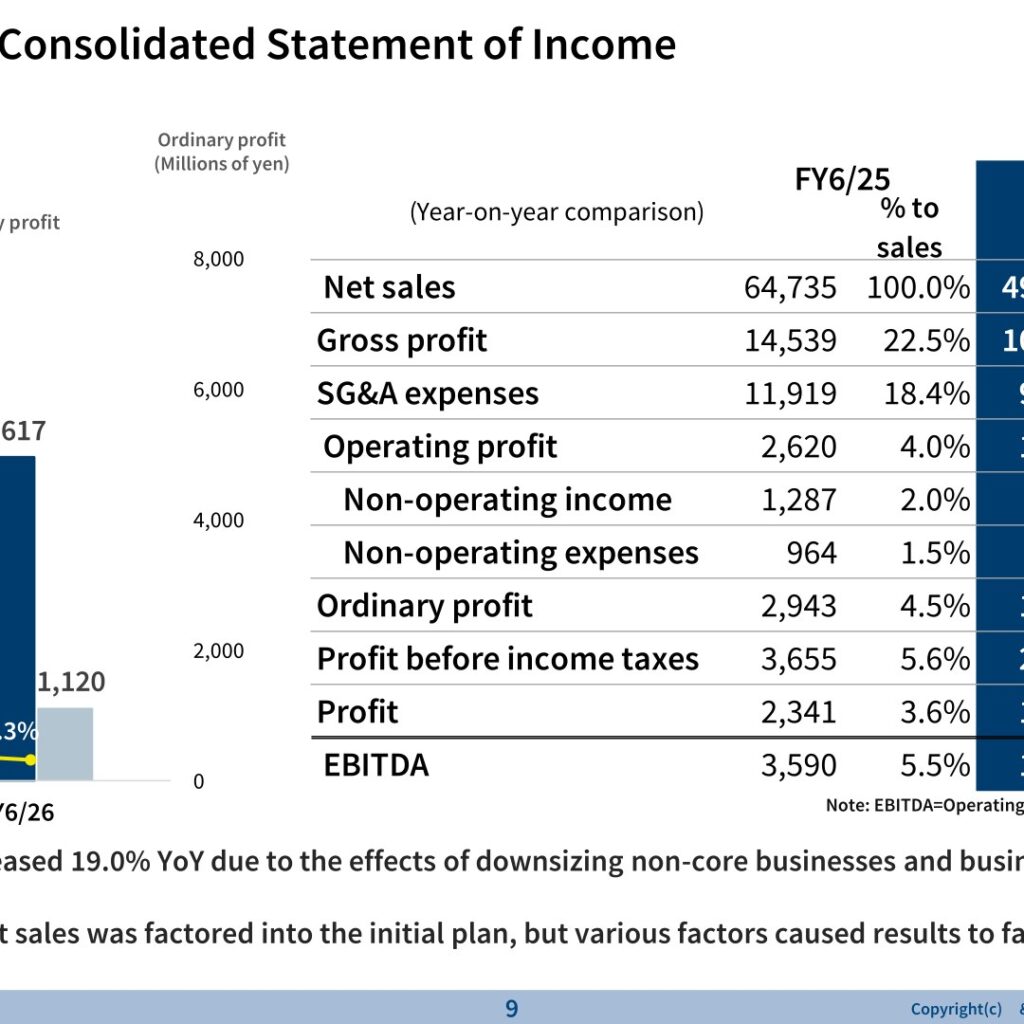
Consolidated Results (Full-Year Actual)
Gross profit fell 25.9% to 10,771 million yen. SG&A expenses decreased 19.0% YoY to 9,651 million yen due to the effects of downsizing non-core businesses and business transfers, among other factors, but rose as a percentage of sales from 18.4% to 19.5%. EBITDA (operating profit + depreciation + goodwill amortization) was 1,953 million yen (-45.6%). The company notes that the YoY decline in net sales was factored into the initial plan, but various factors caused results to fall below expectations.
| Item (Millions of yen) | FY6/25 | FY6/26 | YoY change |
|---|---|---|---|
| Net sales | 64,735 | 49,617 | -23.4% |
| Gross profit | 14,539 | 10,771 | -25.9% |
| SG&A expenses | 11,919 | 9,651 | -19.0% |
| Operating profit | 2,620 | 1,120 | -57.3% |
| Non-operating income | 1,287 | 984 | -23.5% |
| Non-operating expenses | 964 | 983 | + 2.0% |
| Ordinary profit | 2,943 | 1,120 | -61.9% |
| Profit before income taxes | 3,655 | 2,468 | -32.5% |
| Profit | 2,341 | 1,452 | -38.0% |
| EBITDA | 3,590 | 1,953 | -45.6% |
As factors behind the shortfall, the company cites that some planned transfers to HLB Funds were not realized, the disposal of long-stagnant inventory to improve inventory health, large transactions carried over, additional investment in personnel to secure the target headcount, and delays in property acquisitions and inventory buildup due to the time required for employee retention and development. On the progress side, sales personnel in the Real Estate Buying and Selling Business rose from 59.3 to 91.1 (period average), the sales ratio of pre-owned houses increased from 29.0% to 31.7%, and the number of purchase contracts increased 16.5%.
On the balance sheet, total assets decreased from 71,973 million yen to 67,798 million yen and inventories from 43,179 million yen to 39,823 million yen. Interest-bearing debt decreased by ¥3.6bn from the end of the previous fiscal year, the D/E ratio declined from 2.6 times to 2.3 times, and the shareholders’ equity ratio rose from 25.6% to 28.0%. The median inventory holding period in the Real Estate Buying and Selling Business shortened from 293 days to 214 days. Free cash flow remained positive for FY6/26 as the pace of expansion in property acquisitions was slower than initially planned.
Segment Results
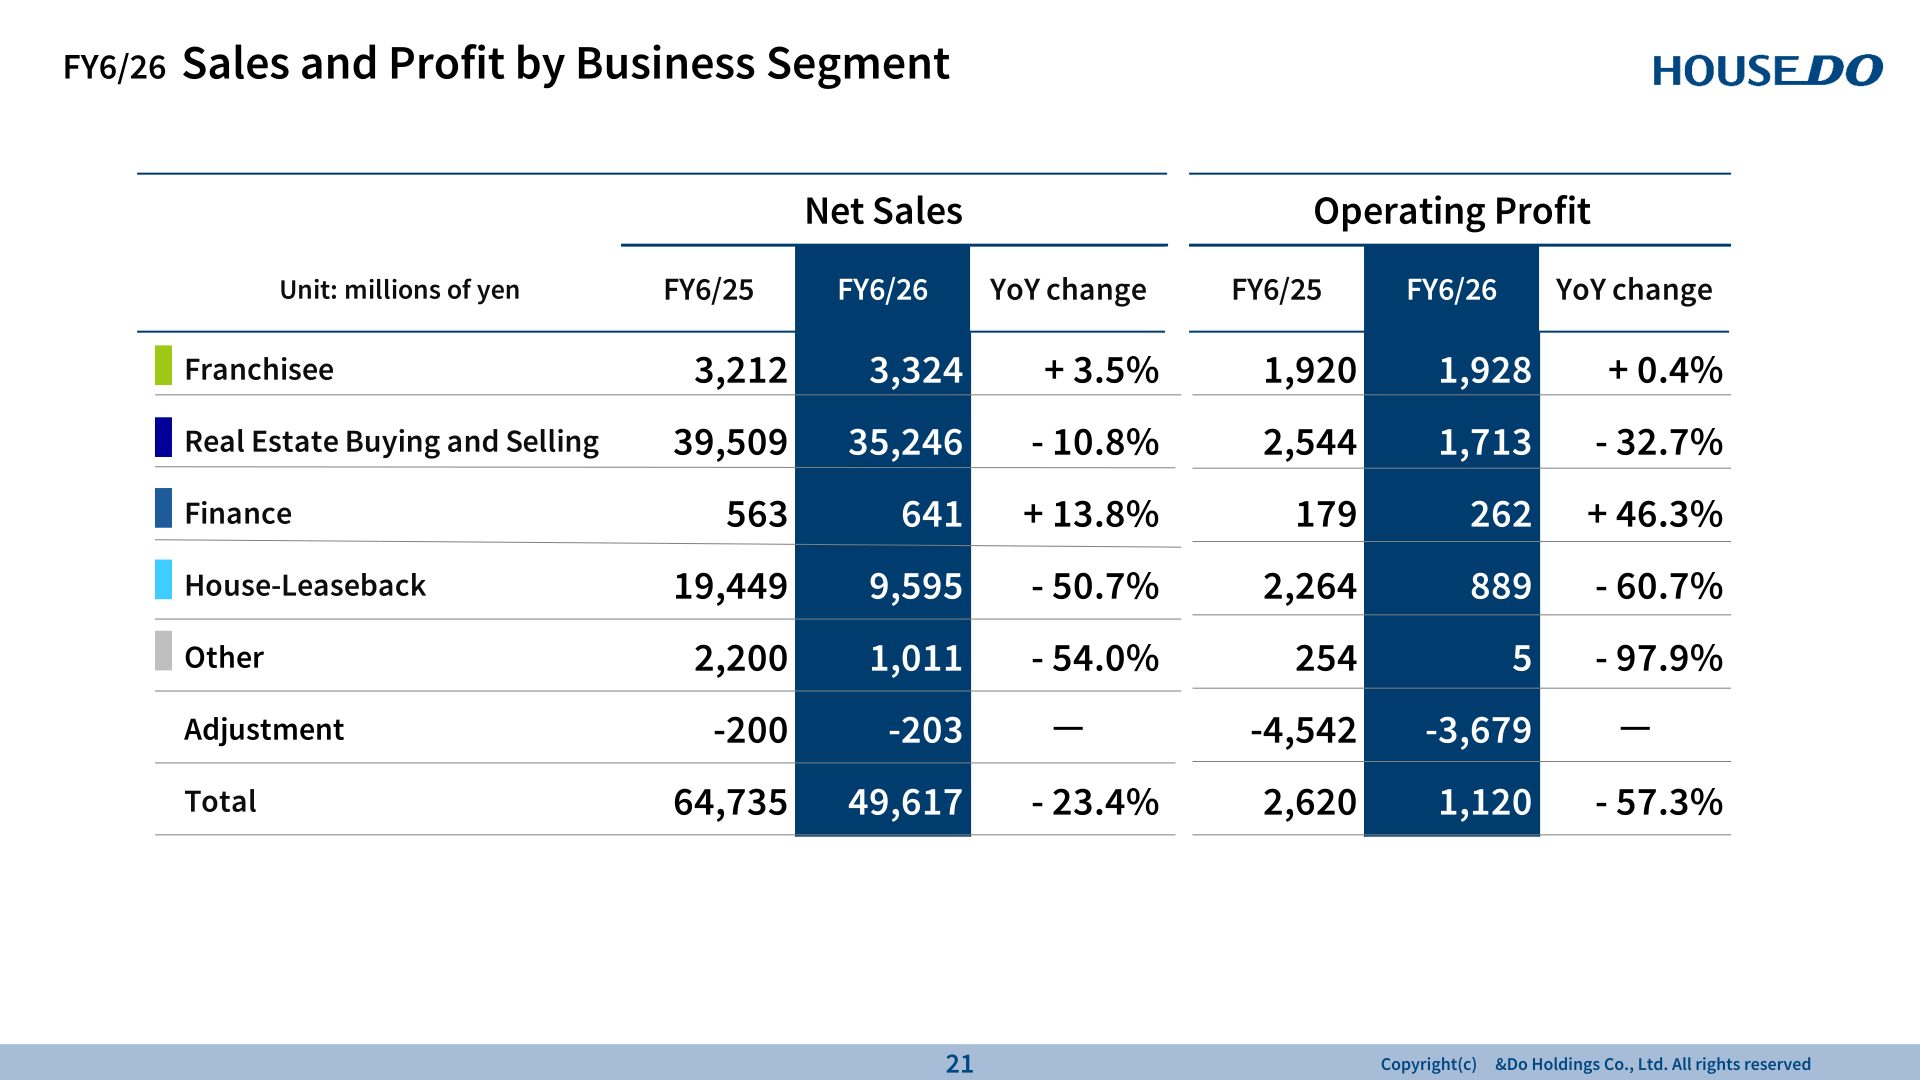
Franchisee: Net sales rose 3.5% to 3,324 million yen and operating profit 0.4% to 1,928 million yen as the number of stores increased; the operating margin was 58.0%. The total number of franchised stores (including stores preparing to open) reached 733 (725 a year earlier), of which 637 were open (624).
Real Estate Buying and Selling: Net sales fell 10.8% to 35,246 million yen and operating profit 32.7% to 1,713 million yen (operating margin 4.9%), mainly due to differences in the scale of sales of large properties, disposal of long-held inventory, and increased personnel investment expenses. Sales of pre-owned houses rose 12.4% to 9,954 million yen, and the number of transactions increased 10.3% to 1,309. The company plans to open two additional stores by the end of 2026.
Finance: Net sales rose 13.8% to 641 million yen and operating profit 46.3% to 262 million yen (operating margin 40.9%) as guarantee balances were built up, despite falling below the initial plan. The reverse mortgage guarantees outstanding balance reached 35,344 million yen (28,178 million yen a year earlier). An alliance with Setagaya Shinkin Bank brought partnerships to 12 shinkin banks, more than half of shinkin banks in Tokyo, and the company had 55 alliance financial institutions as of August 14, 2026.
House-Leaseback: Net sales fell 50.7% to 9,595 million yen and operating profit 60.7% to 889 million yen as the business was downsized as a matter of policy. Profit including gain on investment in silent partnerships was 1,699 million yen (-48.9%), and the number of properties purchased was 172 (854 a year earlier).
| Segment (Millions of yen) | Net sales FY6/25 | Net sales FY6/26 | YoY change | Operating profit FY6/25 | Operating profit FY6/26 | YoY change |
|---|---|---|---|---|---|---|
| Franchisee | 3,212 | 3,324 | + 3.5% | 1,920 | 1,928 | + 0.4% |
| Real Estate Buying and Selling | 39,509 | 35,246 | – 10.8% | 2,544 | 1,713 | – 32.7% |
| Finance | 563 | 641 | + 13.8% | 179 | 262 | + 46.3% |
| House-Leaseback | 19,449 | 9,595 | – 50.7% | 2,264 | 889 | – 60.7% |
| Other | 2,200 | 1,011 | – 54.0% | 254 | 5 | – 97.9% |
| Adjustment | -200 | -203 | - | -4,542 | -3,679 | - |
| Total | 64,735 | 49,617 | – 23.4% | 2,620 | 1,120 | – 57.3% |
FY6/27 Forecast
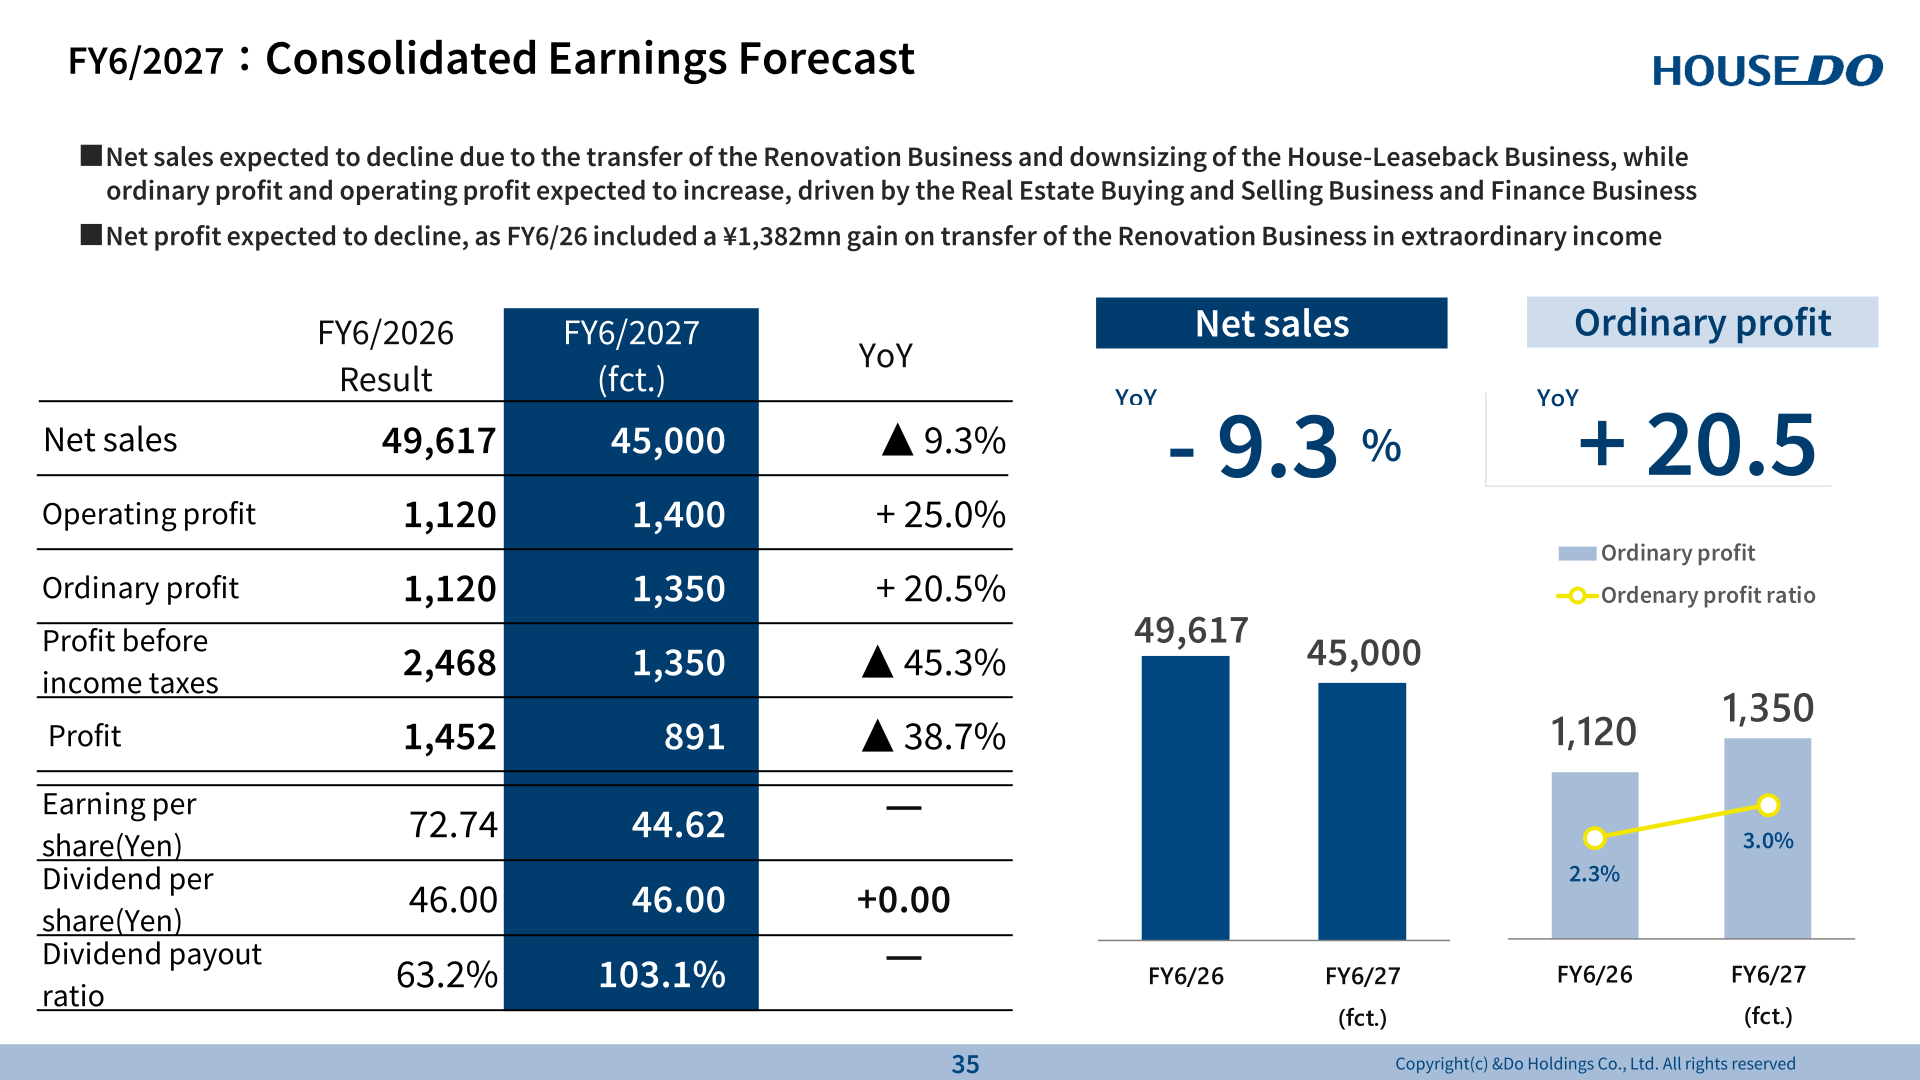
For FY6/27, the company forecasts net sales of 45,000 million yen (▲9.3%), as sales are expected to decline due to the transfer of the Renovation Business and downsizing of the House-Leaseback Business. Operating profit is forecast at 1,400 million yen (+25.0%) and ordinary profit at 1,350 million yen (+20.5%), driven by the Real Estate Buying and Selling Business and Finance Business. Profit is forecast at 891 million yen (▲38.7%), as FY6/26 included a ¥1,382mn gain on transfer of the Renovation Business in extraordinary income.
| Item (Millions of yen) | FY6/2026 Result | FY6/2027 (fct.) | YoY |
|---|---|---|---|
| Net sales | 49,617 | 45,000 | ▲ 9.3% |
| Operating profit | 1,120 | 1,400 | + 25.0% |
| Ordinary profit | 1,120 | 1,350 | + 20.5% |
| Profit before income taxes | 2,468 | 1,350 | ▲ 45.3% |
| Profit | 1,452 | 891 | ▲ 38.7% |
| Earnings per share (Yen) | 72.74 | 44.62 | - |
| Dividend per share (Yen) | 46.00 | 46.00 | +0.00 |
| Dividend payout ratio | 63.2% | 103.1% | - |
By segment, the FY6/27 plan calls for Franchisee net sales of 3,561 million yen and operating profit of 2,110 million yen, with a focus on priority urban areas with development potential; Real Estate Buying and Selling net sales of 36,350 million yen and operating profit of 2,030 million yen, with continued investment to secure personnel and profit improvement expected from efforts to improve inventory health; Finance net sales of 1,049 million yen and operating profit of 600 million yen, developing partnerships for both consumer and business guarantees; and House-Leaseback net sales of 4,190 million yen and operating profit of 220 million yen, with lower sales from property disposals expected due to a decrease in the number of properties held. (The column headings on the segment plan slide read “FY6/25 Result” and “FY6/26 (fct.)”; the figures correspond to the FY6/26 results and FY6/27 forecasts shown on the individual segment slides.)
| Segment (Millions of yen) | Net sales FY6/26 | Net sales FY6/27 (fct.) | YoY change | Operating profit FY6/26 | Operating profit FY6/27 (fct.) | YoY change |
|---|---|---|---|---|---|---|
| Franchisee | 3,324 | 3,561 | + 7.1% | 1,928 | 2,110 | + 9.4% |
| Real Estate Buying and Selling | 35,246 | 36,350 | + 3.1% | 1,713 | 2,030 | + 18.5% |
| Finance | 641 | 1,049 | + 63.5% | 262 | 600 | + 128.5% |
| House-Leaseback | 9,595 | 4,190 | – 56.3% | 889 | 220 | – 75.3% |
Shareholder Returns
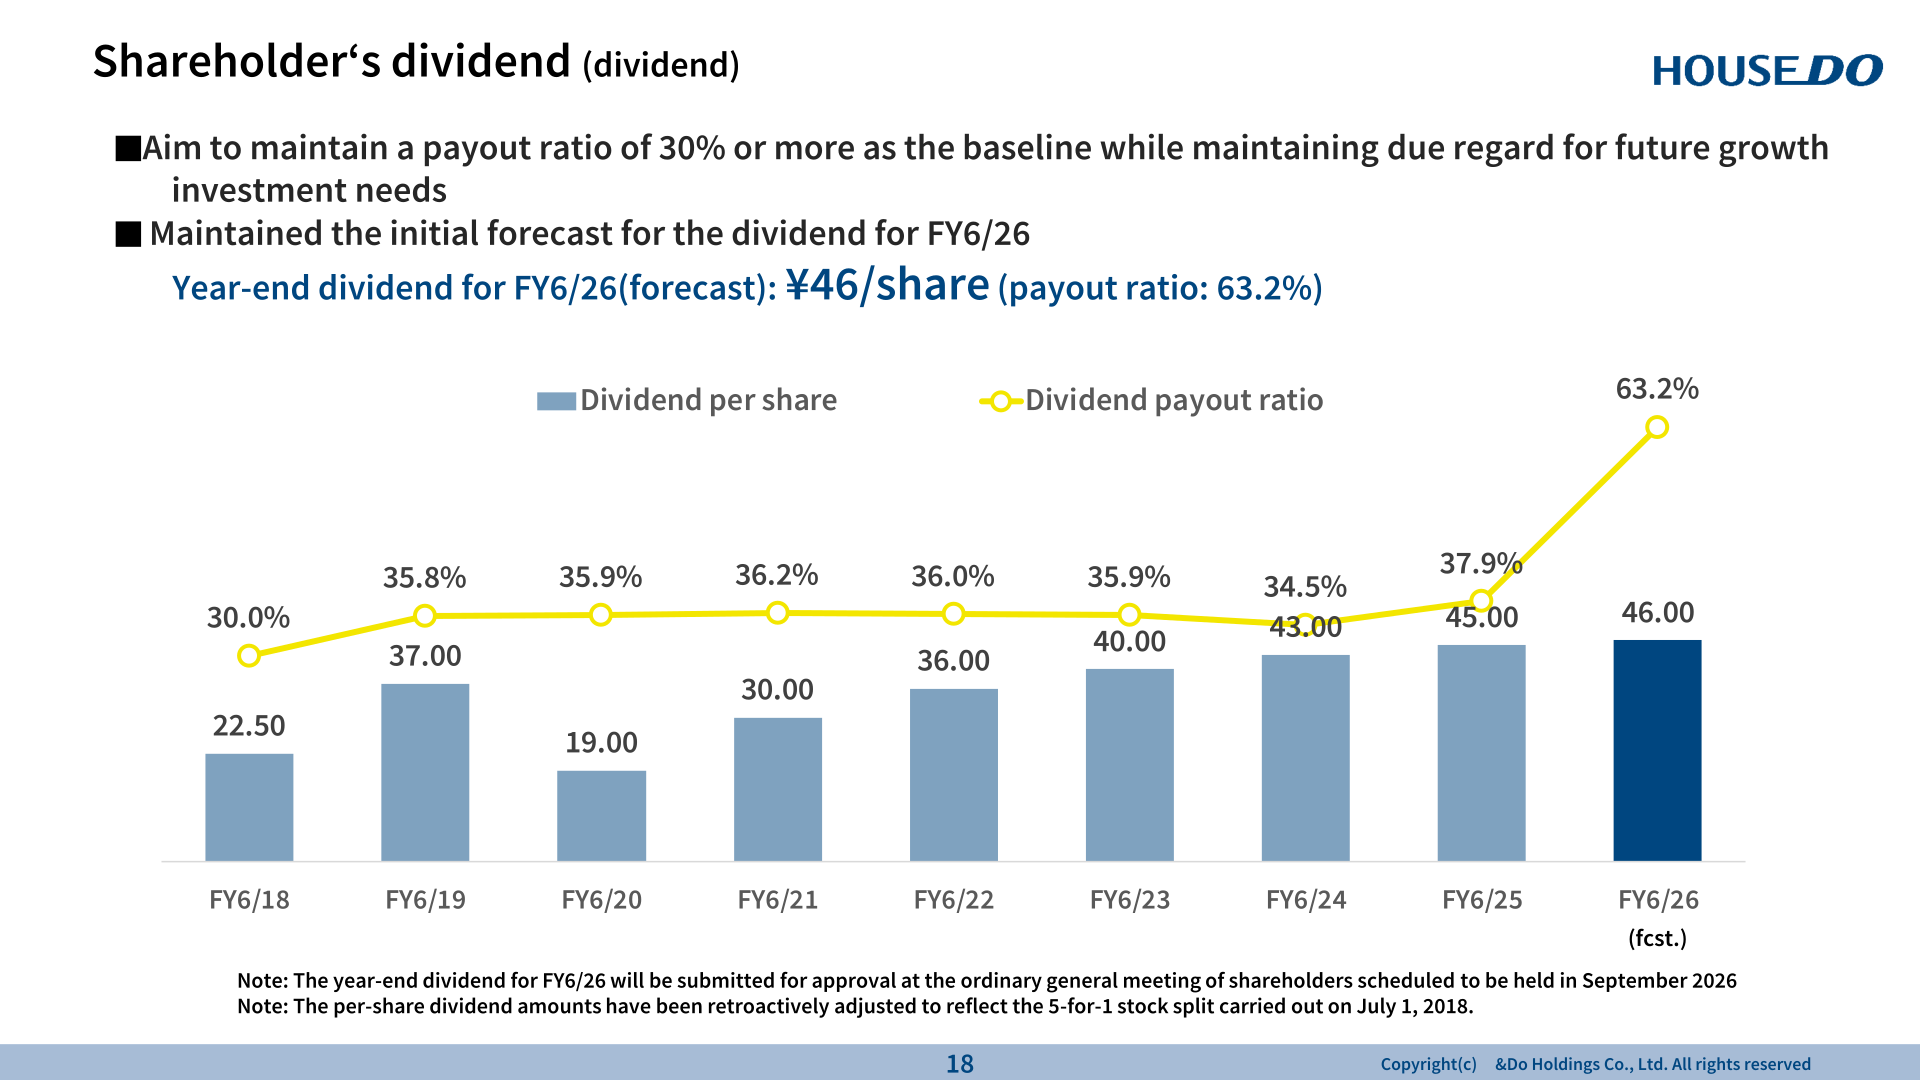
The company aims to maintain a payout ratio of 30% or more as the baseline while maintaining due regard for future growth investment needs. It maintained its initial dividend forecast for FY6/26: a year-end dividend of ¥46 per share (payout ratio: 63.2%), to be submitted for approval at the ordinary general meeting of shareholders scheduled for September 2026. For FY6/27, it forecasts a dividend of 46.00 yen per share (payout ratio 103.1%). The materials also present the restoration of the shareholder benefit program, under which shareholders holding at least five units (500 shares) as of June 30 receive points redeemable on a special website for shareholders only.
Medium-Term Management Plan (FY6/26–FY6/30)
Under the New Medium-Term Management Plan, the company targets, for FY6/30, net sales of ¥80.0 bn, ordinary profit of ¥8.0 bn (profit margin 10%), profit of ¥5.3 bn, a shareholder’s equity ratio of over 30%, ROIC of over 6.0% and a dividend payout ratio of over 30%. The final-year targets are unchanged, while, based on FY6/26 results, the company will push back the timing of inventory buildup and growth expansion in the Real Estate Buying and Selling Business and prioritize investment in human resources, with securing sales personnel as its top priority. Its 2030 targets include 960 franchised stores, pre-owned house sales of ¥37 bn (54% ratio) and a reverse mortgage guarantee outstanding balance of ¥125 bn. ROIC and ROE declined from FY6/25 due to lower-than-expected profit, and the company expects a temporary decline in capital efficiency during the transition period while measures for improvement are underway.
This article is an analysis based on publicly available information and is not a recommendation to buy or sell any specific securities. Investment decisions are your own responsibility.
















