
This article is based on publicly available IR materials and is not a recommendation to buy or sell any specific securities.
Note: TOKYO BASE CO., LTD. has a January fiscal year-end and labels the fiscal year covered here as “FY2026/1” (the fiscal year ended January 31, 2026); on this site the most recently completed fiscal year is classified as FY2025, and the labels used in the text, tables and segment data below follow the company’s own materials.
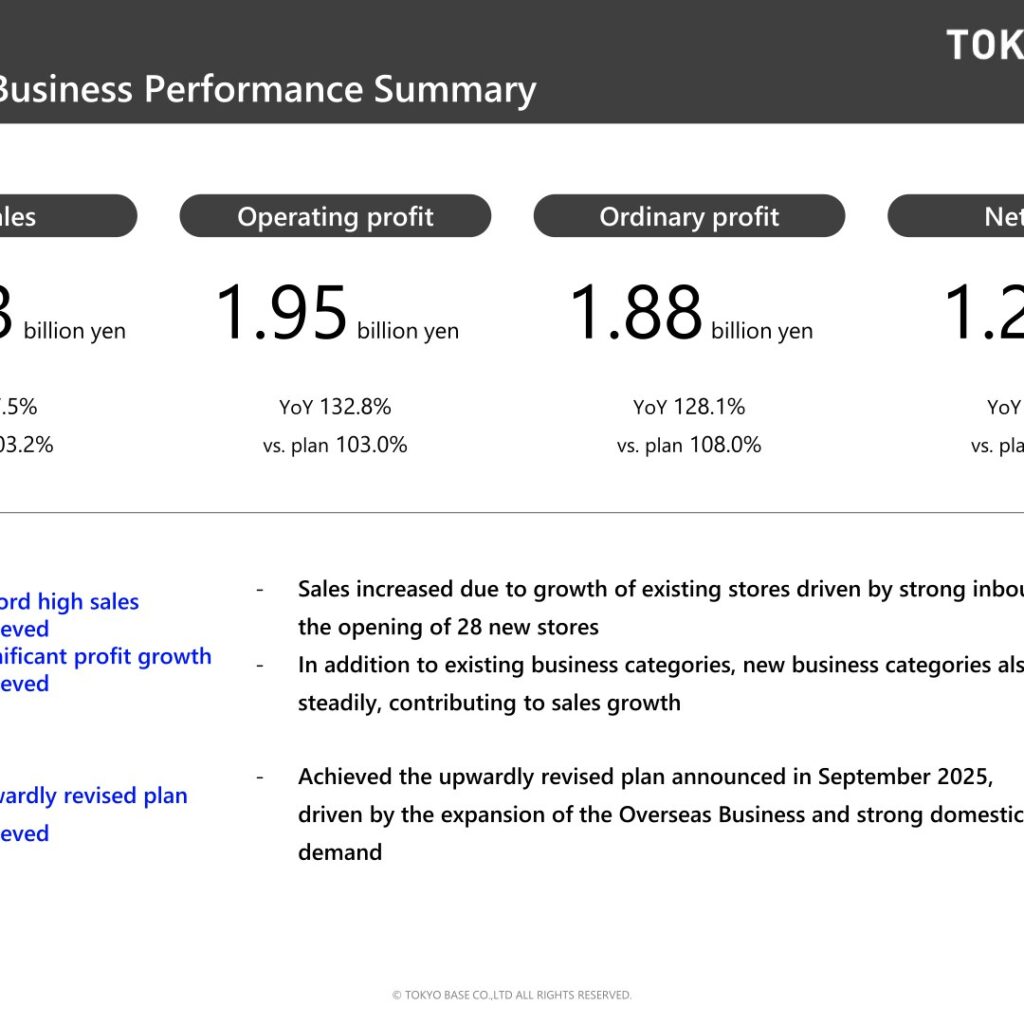
TOKYO BASE, the operator of the STUDIOUS, UNITED TOKYO, PUBLIC TOKYO and THE TOKYO store brands, reported FY2026/1 net sales of 23,734 million yen (117.5% YoY), operating profit of 1,956 million yen, ordinary profit of 1,889 million yen (128.1% YoY) and net profit of 1,209 million yen. The company describes the year as achieving record high sales and significant profit growth, and says it achieved the upwardly revised plan announced in September 2025, driven by the expansion of the Overseas Business and strong domestic inbound demand. The dividend was raised to 6 yen from 5 yen, and for FY2027/1 the company plans net sales of 28,000 million yen, operating profit of 2,500 million yen and a dividend of 7 yen.
Consolidated Results (Full-Year Actual)
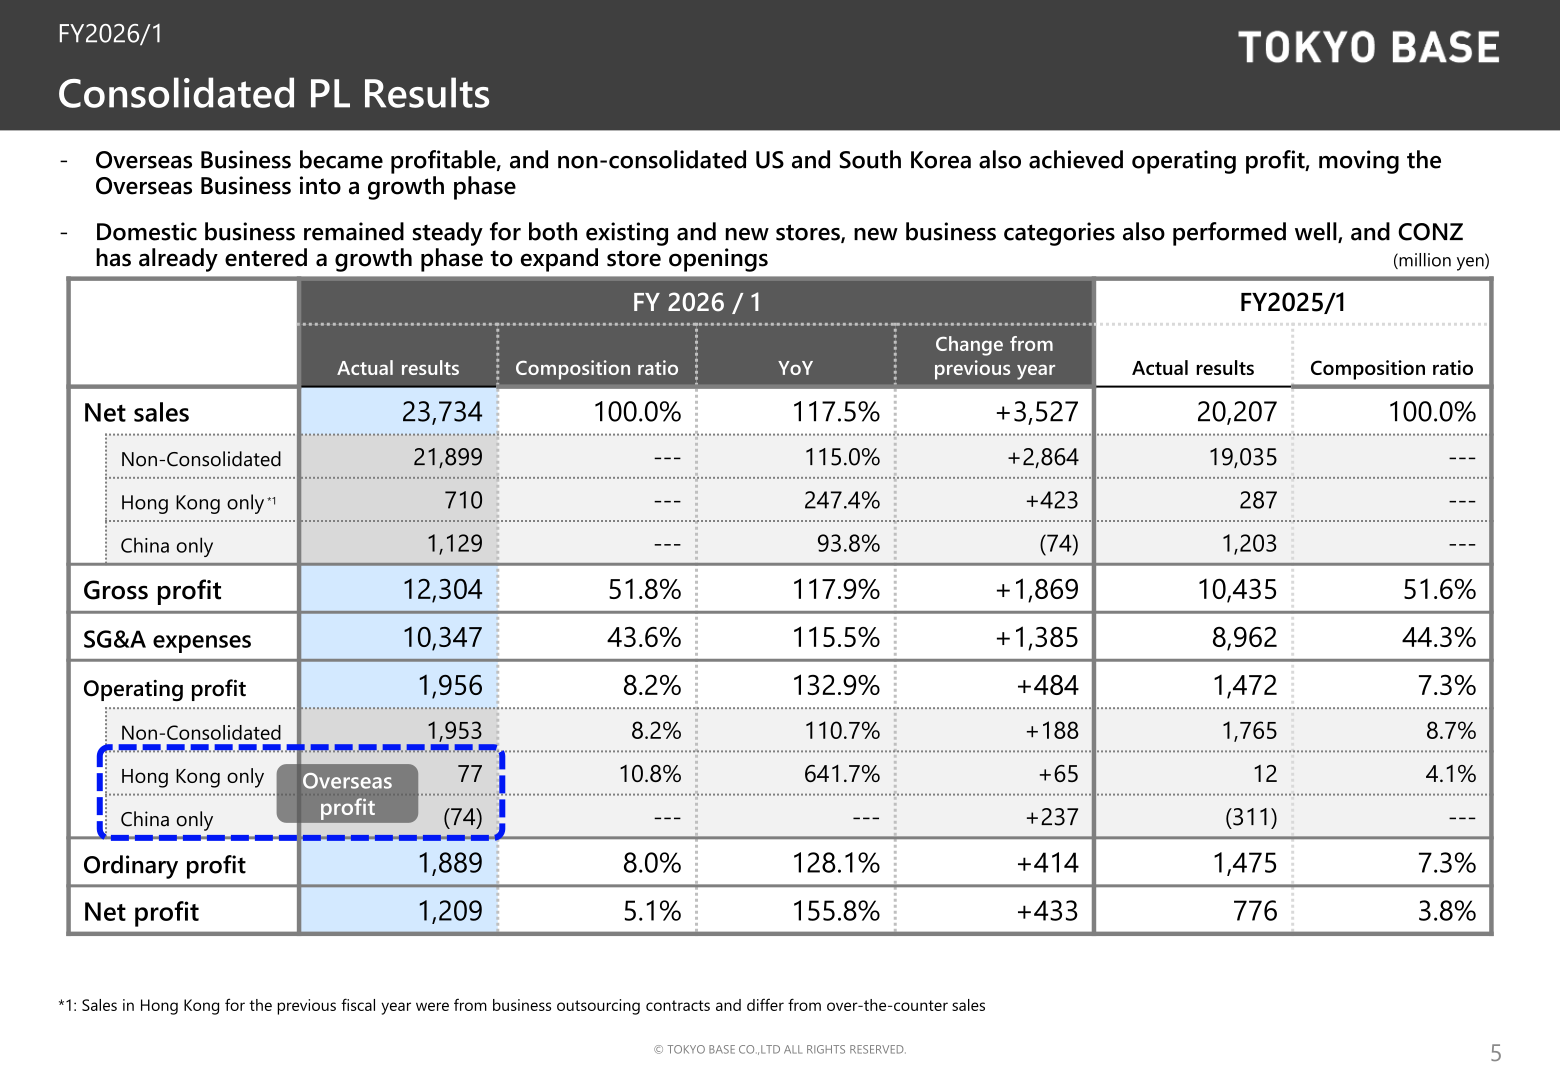
According to the company, sales increased due to growth of existing stores driven by strong inbound demand and the opening of 28 new stores, and new business categories also expanded steadily. Against plan, net sales reached 103.2%, operating profit 103.0%, ordinary profit 108.0% and net profit 100.8%. The company states that the Overseas Business became profitable and that the non-consolidated US and South Korea subsidiaries also achieved operating profit, moving the Overseas Business into a growth phase. The China business narrowed its operating loss to (74) million yen from (311) million yen, while Hong Kong posted operating profit of 77 million yen.
| Item (million yen) | FY2026/1 Actual | Composition ratio | YoY | Change from previous year | FY2025/1 Actual |
|---|---|---|---|---|---|
| Net sales | 23,734 | 100.0% | 117.5% | +3,527 | 20,207 |
| Non-Consolidated | 21,899 | — | 115.0% | +2,864 | 19,035 |
| Hong Kong only | 710 | — | 247.4% | +423 | 287 |
| China only | 1,129 | — | 93.8% | (74) | 1,203 |
| Gross profit | 12,304 | 51.8% | 117.9% | +1,869 | 10,435 |
| SG&A expenses | 10,347 | 43.6% | 115.5% | +1,385 | 8,962 |
| Operating profit | 1,956 | 8.2% | 132.9% | +484 | 1,472 |
| Non-Consolidated | 1,953 | 8.2% | 110.7% | +188 | 1,765 |
| Hong Kong only | 77 | 10.8% | 641.7% | +65 | 12 |
| China only | (74) | — | — | +237 | (311) |
| Ordinary profit | 1,889 | 8.0% | 128.1% | +414 | 1,475 |
| Net profit | 1,209 | 5.1% | 155.8% | +433 | 776 |
Sales in Hong Kong for FY2025/1 were from business outsourcing contracts and differ from over-the-counter sales. The gross profit margin was 51.8% (+0.2pt YoY): the gross profit margin for physical stores in Japan plus EC improved to 54.5% from 54.2% (+0.3pt), and higher sales from the Hong Kong business, whose gross profit margin was 69.2%, added +0.1pt, while strategic and aggressive inventory clearance at the fiscal year-end reduced the margin by 0.2pt. The SG&A expense ratio improved by 0.8 pts to 43.6%. The company attributes the revenue increase to higher existing store sales in Japan (+990 million yen), new store openings in Japan in existing business categories (+1.6 billion yen), new business categories JAPAN EDITION and RITAN (+450 million yen), overseas store expansion (+60 million yen) and EC (+770 million yen). Extraordinary losses of 110 million yen were recorded for impairment losses and loss on retirement of assets due to the closing of unprofitable stores in Japan and China.
At the end of FY2026/1, total assets were 14,864 million yen (+3,409 million yen), merchandise inventory 3,661 million yen (+766 million yen), loans payable 5,315 million yen (+1,430 million yen) and net assets 6,266 million yen. The company notes that launching Midsummer MD resulted in slightly excess inventory, with clearance being promoted from FY2026/1 4Q through FY2027/1 1H, and that the increase in loans reflects store openings in Japan and overseas in line with the Medium-term Management Plan. ROE was 21.3% (+6.7 pts) and the equity ratio 42.0%.
Segment Results
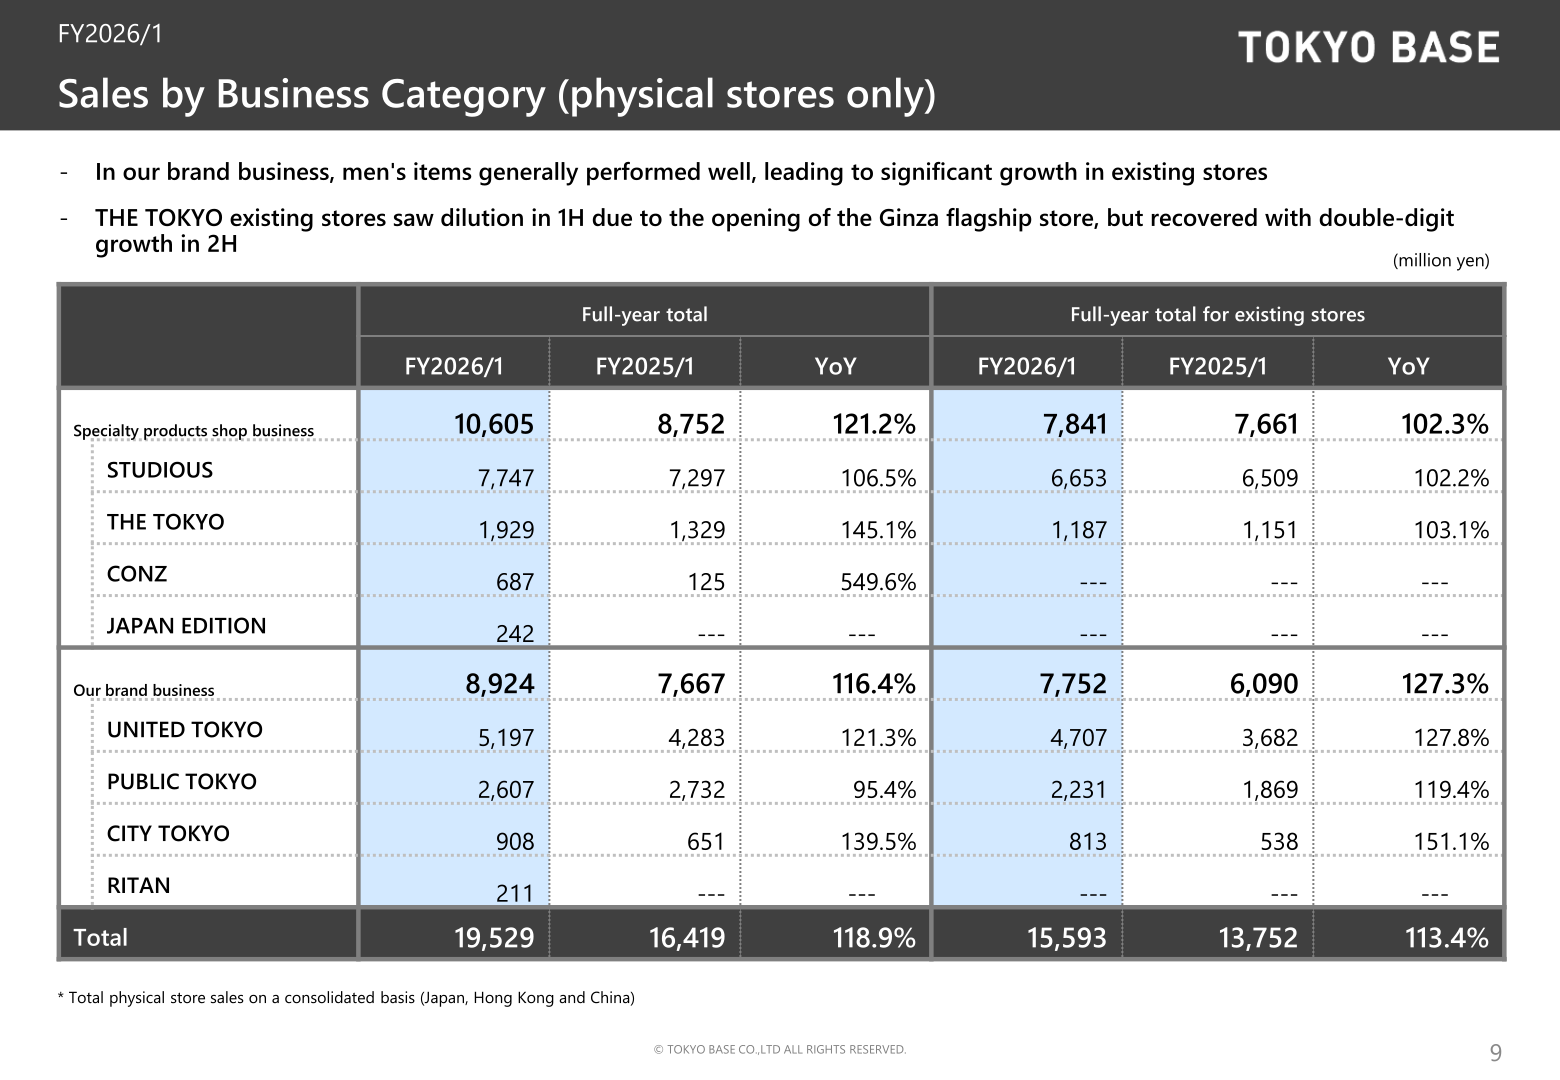
TOKYO BASE reports sales by sales channel and by business category. By channel (based on in-store sales), physical store sales were 19,529 million yen (118.9% YoY), of which Japan 17,684 million yen (120.9%), Hong Kong 710 million yen (122.8%) and China 1,135 million yen (94.0%); EC sales were 4,085 million yen (123.2%). The company says physical stores successfully opened new stores without slowing the growth of existing stores, and that Company EC sales increased to 125.8% YoY, establishing an EC business that does not rely on discount promotions.
| Business category (physical stores, million yen) | FY2026/1 | FY2025/1 | YoY | Existing stores FY2026/1 | Existing stores FY2025/1 | Existing stores YoY |
|---|---|---|---|---|---|---|
| Specialty products shop business | 10,605 | 8,752 | 121.2% | 7,841 | 7,661 | 102.3% |
| STUDIOUS | 7,747 | 7,297 | 106.5% | 6,653 | 6,509 | 102.2% |
| THE TOKYO | 1,929 | 1,329 | 145.1% | 1,187 | 1,151 | 103.1% |
| CONZ | 687 | 125 | 549.6% | — | — | — |
| JAPAN EDITION | 242 | — | — | — | — | — |
| Our brand business | 8,924 | 7,667 | 116.4% | 7,752 | 6,090 | 127.3% |
| UNITED TOKYO | 5,197 | 4,283 | 121.3% | 4,707 | 3,682 | 127.8% |
| PUBLIC TOKYO | 2,607 | 2,732 | 95.4% | 2,231 | 1,869 | 119.4% |
| CITY TOKYO | 908 | 651 | 139.5% | 813 | 538 | 151.1% |
| RITAN | 211 | — | — | — | — | — |
| Total | 19,529 | 16,419 | 118.9% | 15,593 | 13,752 | 113.4% |
The figures above are total physical store sales on a consolidated basis (Japan, Hong Kong and China). In the in-house brand business, men’s items generally performed well, leading to significant growth in existing stores; THE TOKYO existing stores saw dilution in 1H due to the opening of the Ginza flagship store but recovered with double-digit growth in 2H. By overseas market, the Hong Kong business posted net sales of 710 million yen and operating profit of 77 million yen, an operating profit margin of 10.8% after 50 million yen of opening costs (17.9% excluding opening costs, according to the company). In China, the company says the business has consistently achieved monthly operating profit since September, after completing the transition of all stores to middle-risk stores.
Full-Year Forecast (FY2027/1 Plan)
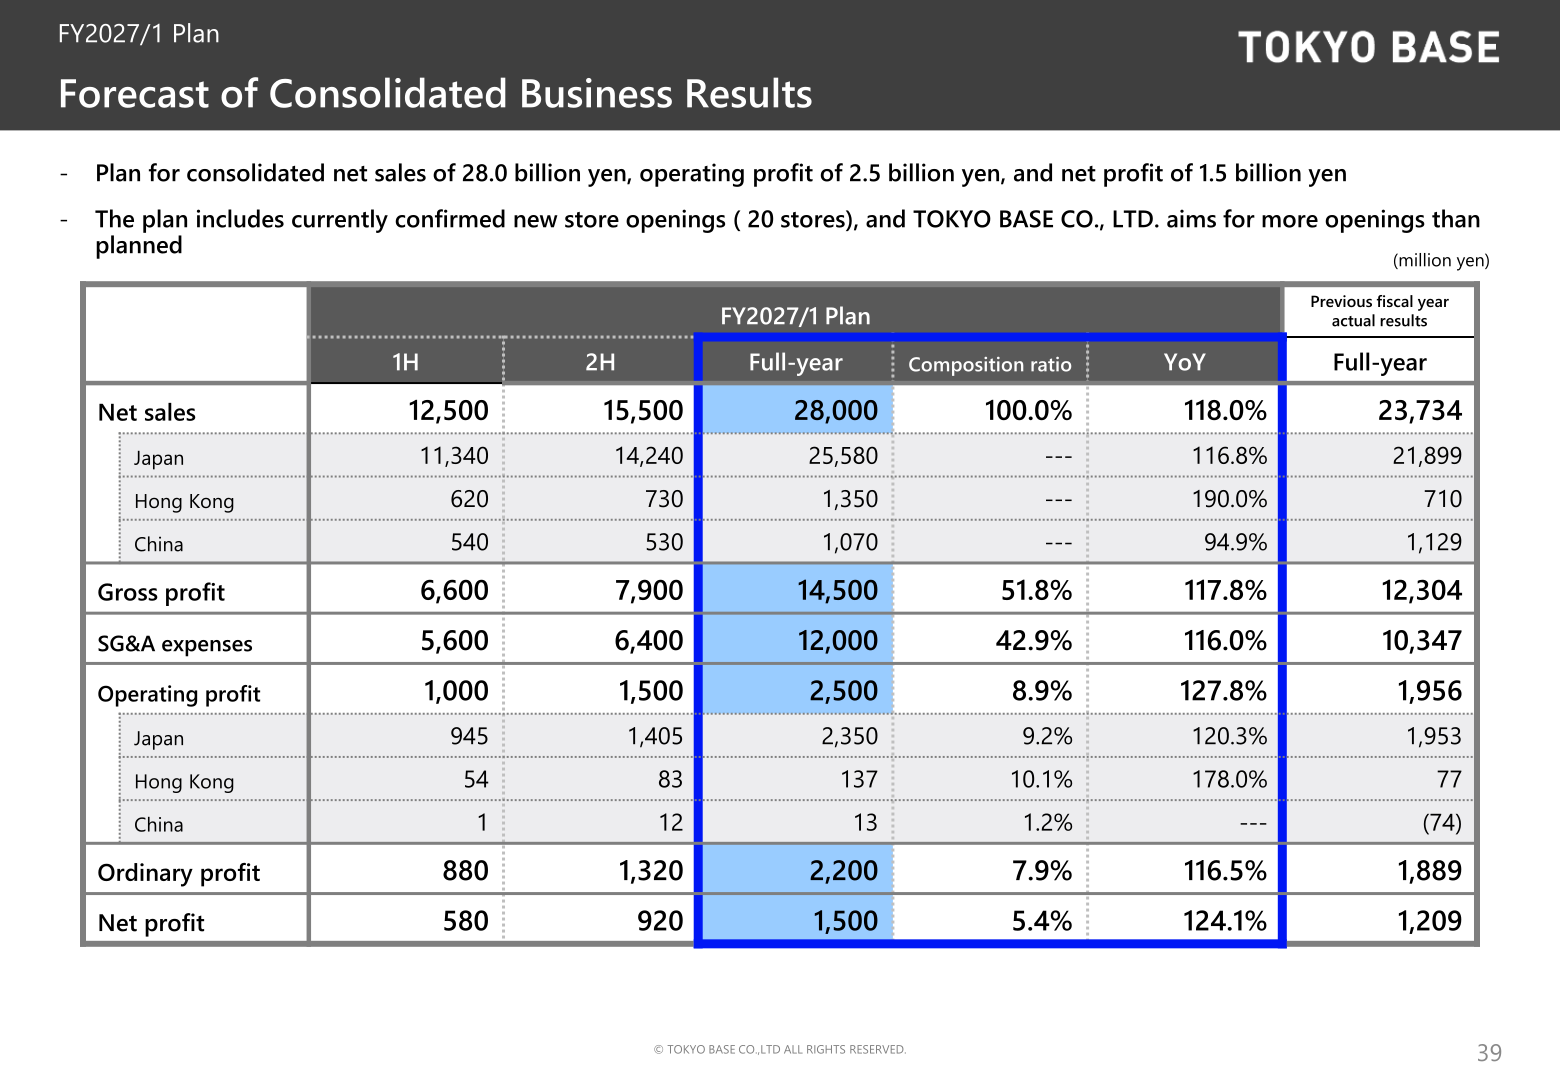
For FY2027/1, TOKYO BASE plans consolidated net sales of 28,000 million yen (118.0% YoY), operating profit of 2,500 million yen (127.8%) and net profit of 1,500 million yen (124.1%). The plan includes the currently confirmed new store openings (20 stores), and the company aims for more openings than planned. The China business is expected to turn profitable in FY2027/1, one year behind the original plan.
| Item (million yen) | FY2027/1 Plan 1H | FY2027/1 Plan 2H | FY2027/1 Plan Full-year | YoY | FY2026/1 Actual |
|---|---|---|---|---|---|
| Net sales | 12,500 | 15,500 | 28,000 | 118.0% | 23,734 |
| Japan | 11,340 | 14,240 | 25,580 | 116.8% | 21,899 |
| Hong Kong | 620 | 730 | 1,350 | 190.0% | 710 |
| China | 540 | 530 | 1,070 | 94.9% | 1,129 |
| Gross profit | 6,600 | 7,900 | 14,500 | 117.8% | 12,304 |
| SG&A expenses | 5,600 | 6,400 | 12,000 | 116.0% | 10,347 |
| Operating profit | 1,000 | 1,500 | 2,500 | 127.8% | 1,956 |
| Japan | 945 | 1,405 | 2,350 | 120.3% | 1,953 |
| Hong Kong | 54 | 83 | 137 | 178.0% | 77 |
| China | 1 | 12 | 13 | — | (74) |
| Ordinary profit | 880 | 1,320 | 2,200 | 116.5% | 1,889 |
| Net profit | 580 | 920 | 1,500 | 124.1% | 1,209 |
Shareholder Returns
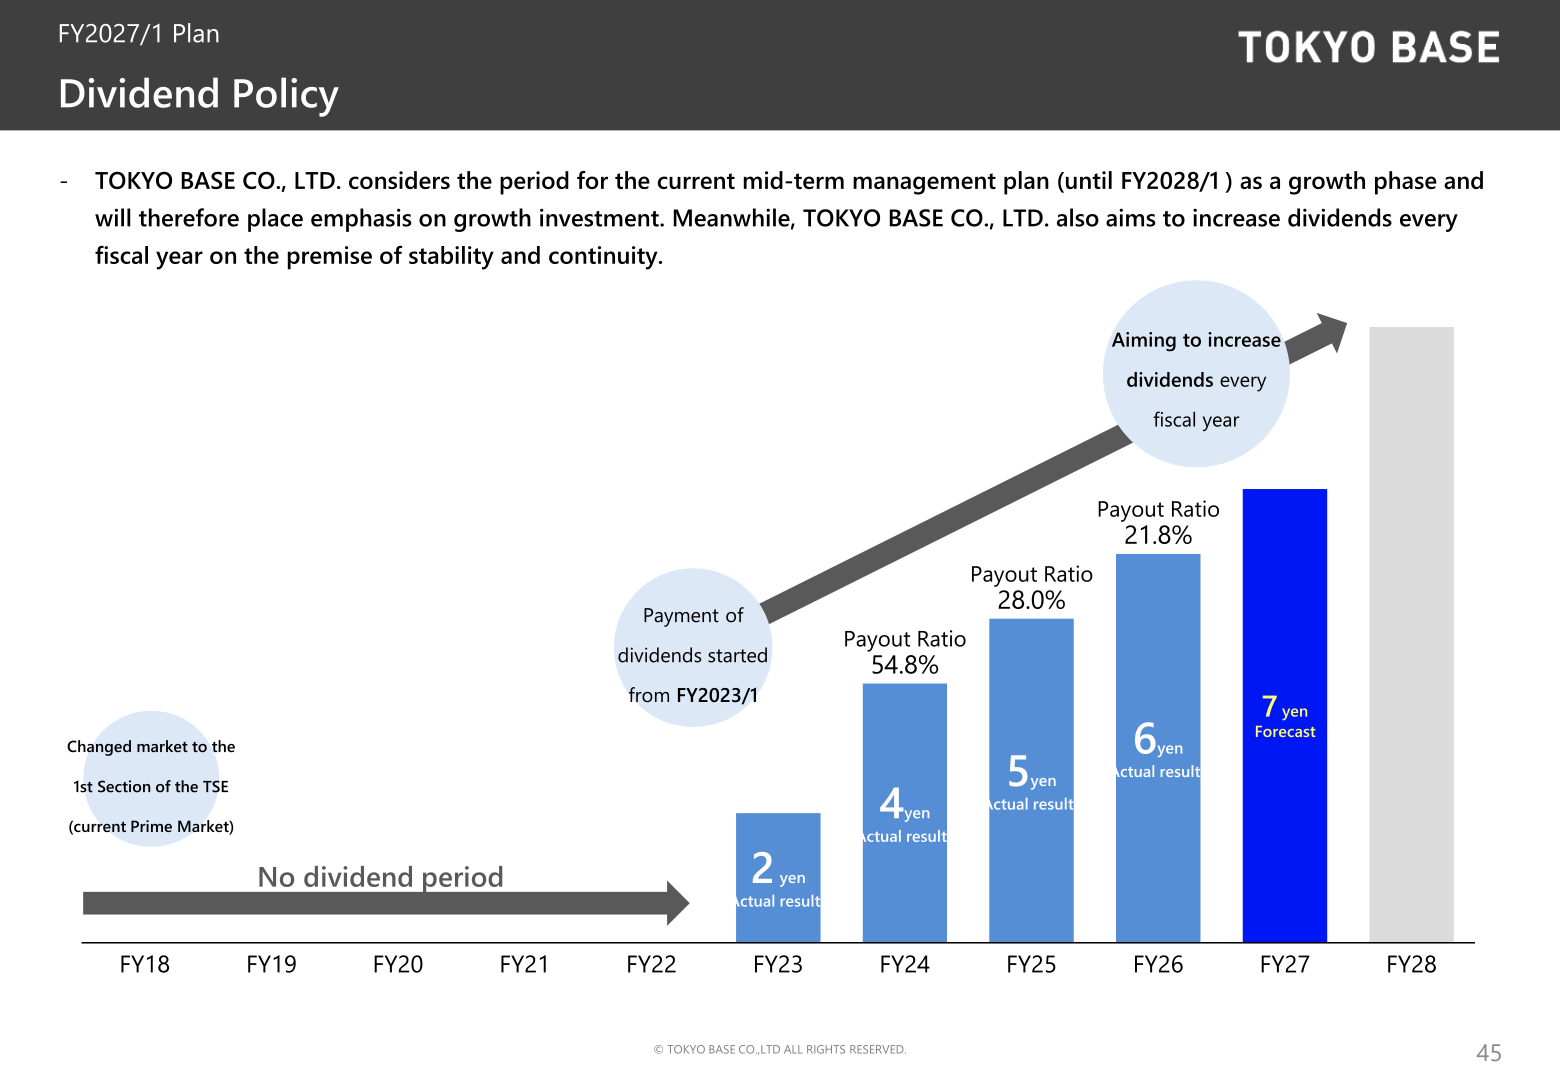
During the current medium-term management plan period, TOKYO BASE has set the total return ratio at 20% or more. The FY2026/1 dividend was 6 yen per share, up 1 yen from the previous fiscal year, for a payout ratio of 21.8%. The company considers the period of the current mid-term management plan (until FY2028/1) a growth phase and places emphasis on growth investment, while aiming to increase dividends every fiscal year on the premise of stability and continuity. The dividend forecast for FY2027/1 is 7 yen.
| Indicator | FY2026/1 | FY2025/1 | YoY change |
|---|---|---|---|
| Dividend | 6 yen | 5 yen | +1 yen |
| Payout ratio | 21.8% | 28.0% | (6.2) pts |
| Total return ratio | 21.8% | 156.7% | (134.9) pts |
| DOE (Ratio of dividends to net assets) | 4.2% | 4.3% | (0.1%) |
| ROE | 21.3% | 14.6% | +6.7 pts |
| Operating profit/net sales | 8.2% | 7.3% | +0.9 pts |
| Equity ratio | 42.0% | 44.5% | (2.5) pts |
Medium-Term Management Plan and Initiatives
Following the revision of performance forecasts announced in September 2025, net sales and operating profit margin targets for FY2026/1 to FY2028/1 in the Medium-term Management Plan were revised upward. The milestones are net sales of 23.0 billion yen with an operating profit margin of 8.2% for FY2026/1, 28.0 billion yen and 9.0% for FY2027/1, and 35.0 billion yen and 10.0% for FY2028/1, with KPIs including opening over 15 stores a year, expansion into a 5th foreign country and continued development of new business categories.
In FY2026/1, TOKYO BASE opened a total of 28 stores (including EC) in Japan and overseas, in addition to beginning its South Korea business, bringing the group total to 106 stores at the end of the period. The company strengthened street-front store openings in areas with high inflows of inbound tourists and developed JAPAN EDITION as a new business category aimed at Western inbound tourists. In Hong Kong it plans to open 4 stores in 1H of FY2027/1 to reach a 10-store network. For FY2027/1, the plan incorporates an increase of 20 consolidated stores whose openings are confirmed, while the company aims for 40 store openings for the full fiscal year, including the launch of the new KEY TIMEZ business category in Japan and Hong Kong. The company is also researching the possibility of business expansion into Taiwan as its 5th overseas country.
This article is an analysis based on publicly available information and is not a recommendation to buy or sell any specific securities. Investment decisions are your own responsibility.
















