
This article is based on publicly available IR materials and is not a recommendation to buy or sell any specific securities.
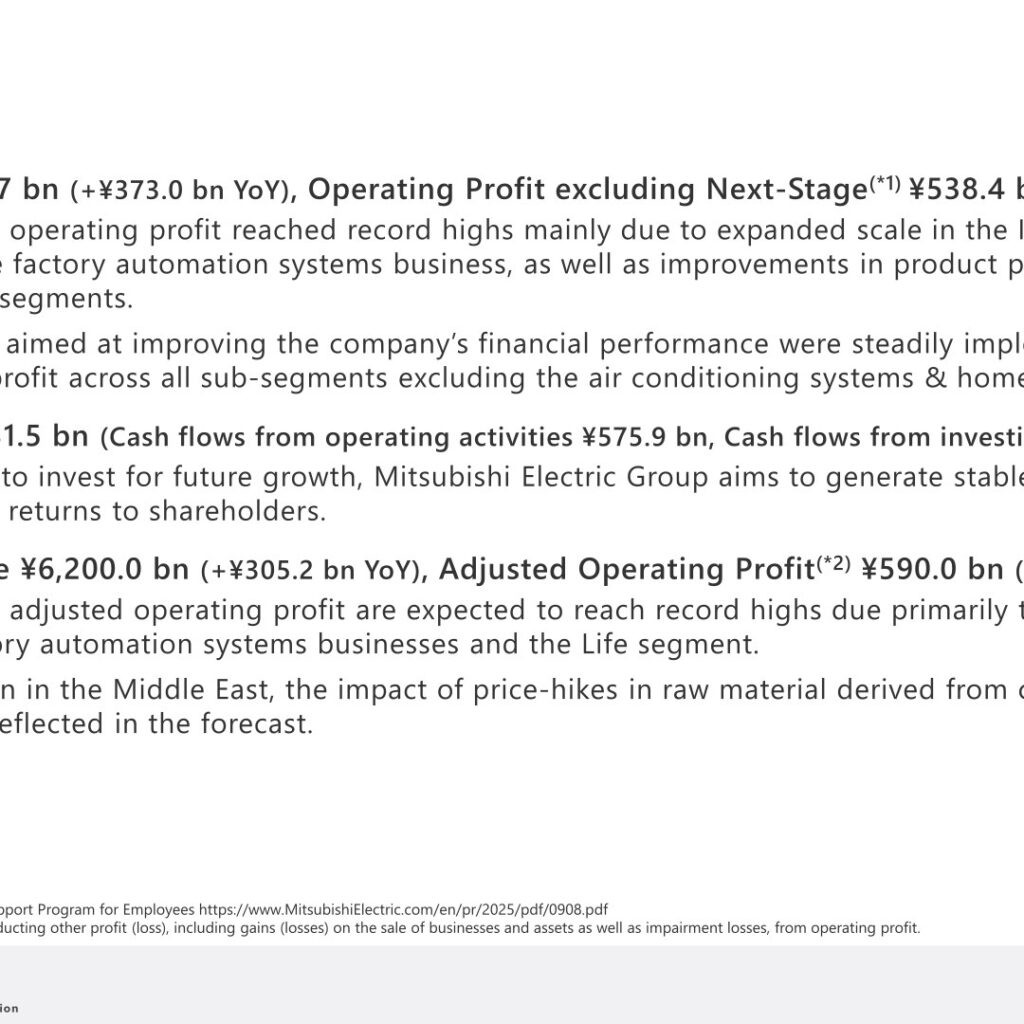
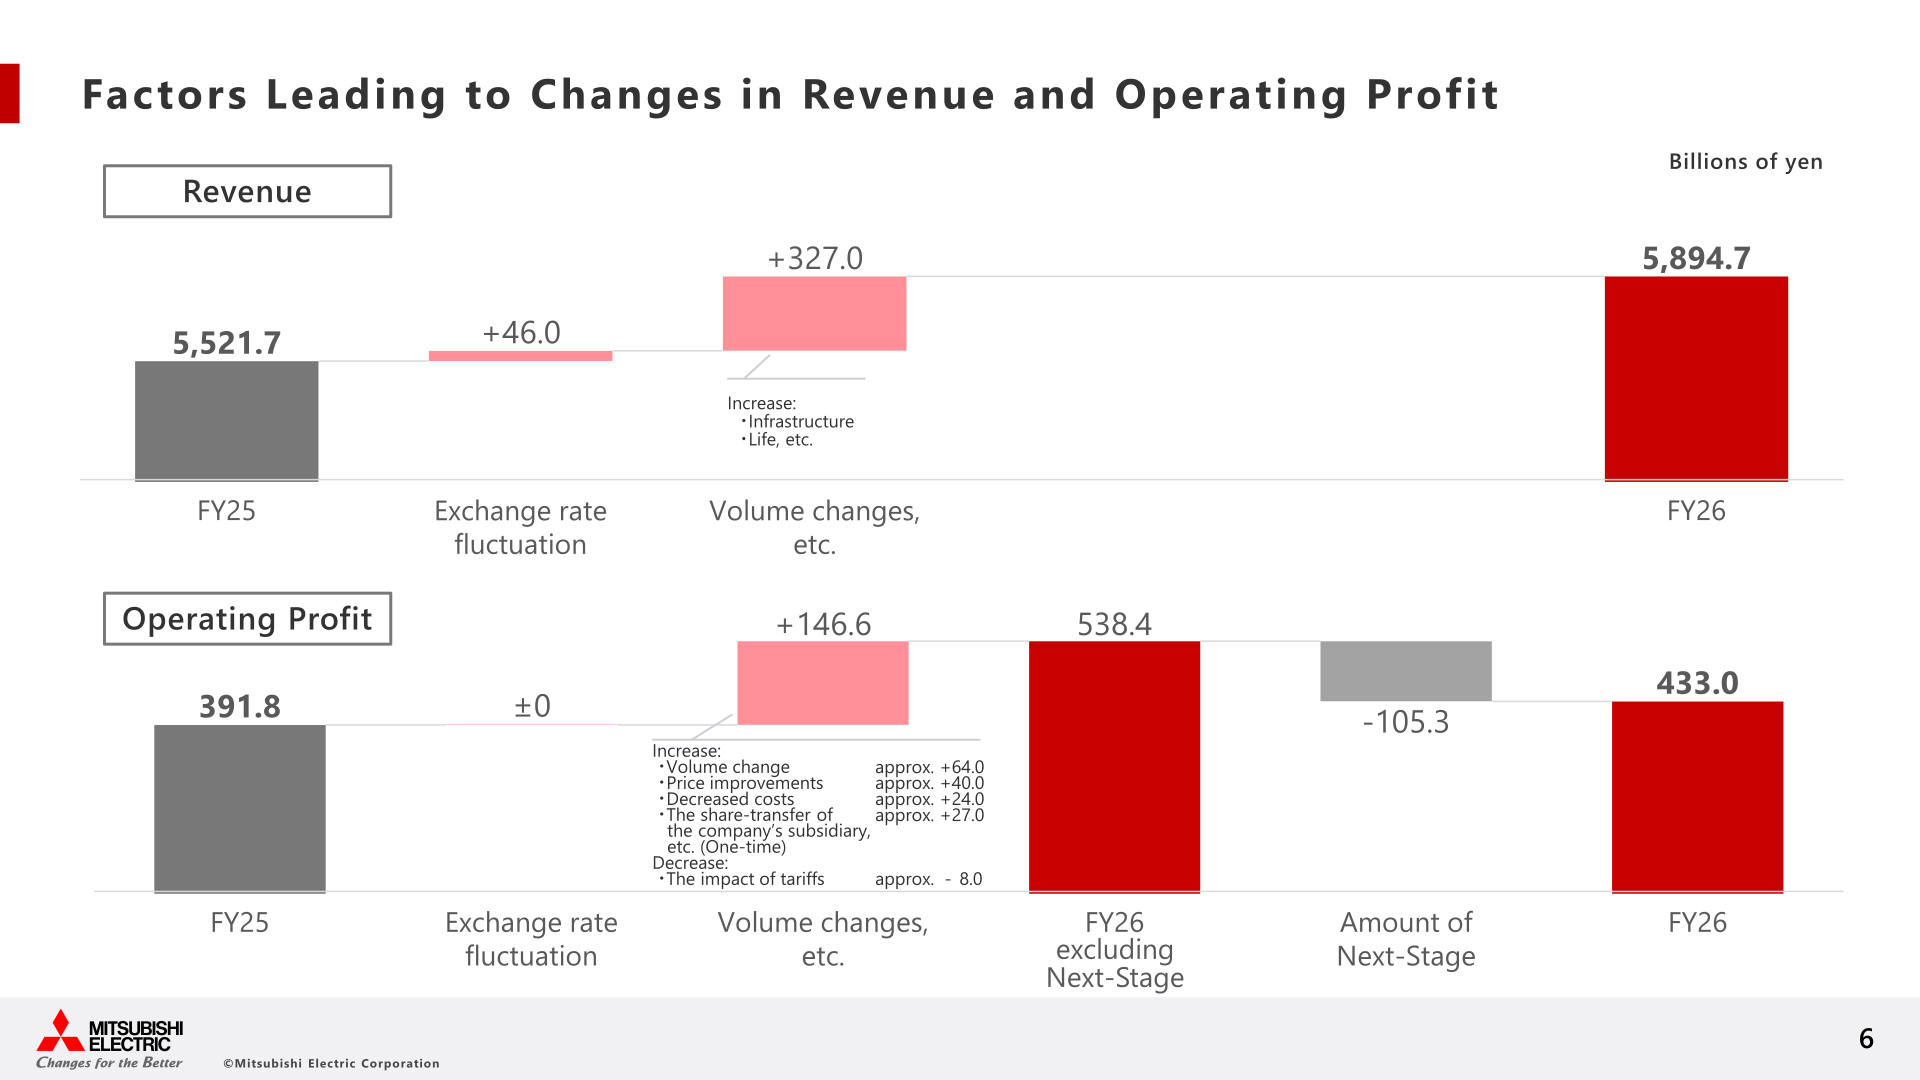
Note: Mitsubishi Electric labels the fiscal year ended March 31, 2026 as “FY26” in its own materials; the tables and figures below follow the company’s labels. Mitsubishi Electric Corporation reported record consolidated results for the fiscal year ended March 31, 2026 (FY2026), with revenue of ¥5,894.7 billion, up ¥373.0 billion year on year, and operating profit excluding the one-time Next-Stage program cost of ¥538.4 billion, up ¥146.6 billion year on year. Including the ¥105.3 billion Next-Stage program expense, operating profit was ¥433.0 billion (+¥41.2 billion YoY) and net profit attributable to Mitsubishi Electric Corp. stockholders was ¥407.7 billion (+¥83.6 billion YoY). Both revenue and operating profit reached record highs mainly due to expanded scale in the Infrastructure and Life segments and the factory automation systems business, as well as improvements in product prices in the Industry & Mobility and Life segments. For FY2027, the company forecasts revenue of ¥6,200.0 billion and adjusted operating profit of ¥590.0 billion, both of which are expected to be record highs.
Consolidated Results (Full-Year Actual)
The table below summarizes Mitsubishi Electric’s consolidated financial results for FY2026 compared with FY2025, as disclosed in the results briefing materials. The Next-Stage figure of -¥105.3 billion relates to the company’s “Next-Stage Support Program for Employees,” which was treated as a one-time cost within operating profit for FY2026.
| Item (Billions of yen) | FY2026 | FY2025 | YoY Change |
|---|---|---|---|
| Revenue | 5,894.7 | 5,521.7 | +373.0 (107%) |
| Operating profit excluding Next-Stage | 538.4 | 391.8 | +146.6 (137%) |
| Operating profit margin excluding Next-Stage | 9.1% | 7.1% | +2.0pt |
| Amount of Next-Stage | -105.3 | – | -105.3 |
| Operating profit | 433.0 | 391.8 | +41.2 (111%) |
| Operating profit margin | 7.3% | 7.1% | +0.2pt |
| Profit before income taxes | 526.0 | 437.2 | +88.8 (120%) |
| Net profit attributable to Mitsubishi Electric Corp. stockholders | 407.7 | 324.0 | +83.6 (126%) |
According to the company, various measures aimed at improving financial performance were steadily implemented, resulting in year-on-year profit increases across all sub-segments excluding the air conditioning systems & home products business. The ¥146.6 billion year-on-year increase in operating profit (excluding Next-Stage) reflected volume changes of approximately +¥64.0 billion, price improvements of approximately +¥40.0 billion, decreased costs of approximately +¥24.0 billion, and a one-time gain of approximately +¥27.0 billion from the share-transfer of a subsidiary, partially offset by an approximately -¥8.0 billion impact from tariffs. Revenue growth of approximately +¥327.0 billion (in addition to an approximately +¥46.0 billion exchange-rate impact) was driven mainly by increases in the Infrastructure and Life segments.
Financial Position and Cash Flow
Total assets increased to ¥7,357.5 billion as of March 31, 2026 (+¥981.8 billion from March 31, 2025), and total equity increased to ¥4,629.9 billion (+¥553.6 billion), while the Mitsubishi Electric Corp. stockholders’ equity ratio was 60.9% (-1.0pt YoY) and the D/E ratio was 0.08 times (-0.01 YoY). Free cash flow was ¥231.5 billion (cash flows from operating activities of ¥575.9 billion and cash flows from investing activities of -¥344.4 billion). The company states that, while continuing to invest for future growth, the Mitsubishi Electric Group aims to generate stable free cash flow and deliver consistent returns to shareholders.
| Item | FY2026 / As of Mar 31, 2026 | FY2025 / As of Mar 31, 2025 | Change |
|---|---|---|---|
| Total assets (billions of yen) | 7,357.5 | 6,375.6 | +981.8 |
| Total liabilities (billions of yen) | 2,727.5 | 2,299.3 | +428.2 |
| Total equity (billions of yen) | 4,629.9 | 4,076.3 | +553.6 |
| Mitsubishi Electric Corp. stockholders’ equity (billions of yen) | 4,484.2 | 3,949.6 | +534.5 |
| Stockholders’ equity ratio | 60.9% | 61.9% | -1.0pt |
| D/E ratio (times) | 0.08 | 0.09 | -0.01 |
| Cash flows from operating activities (billions of yen) | 575.9 | 455.9 | +120.0 |
| Cash flows from investing activities (billions of yen) | -344.4 | -191.7 | -152.6 |
| Free cash flow (billions of yen) | 231.5 | 264.1 | -32.5 |
Segment Results
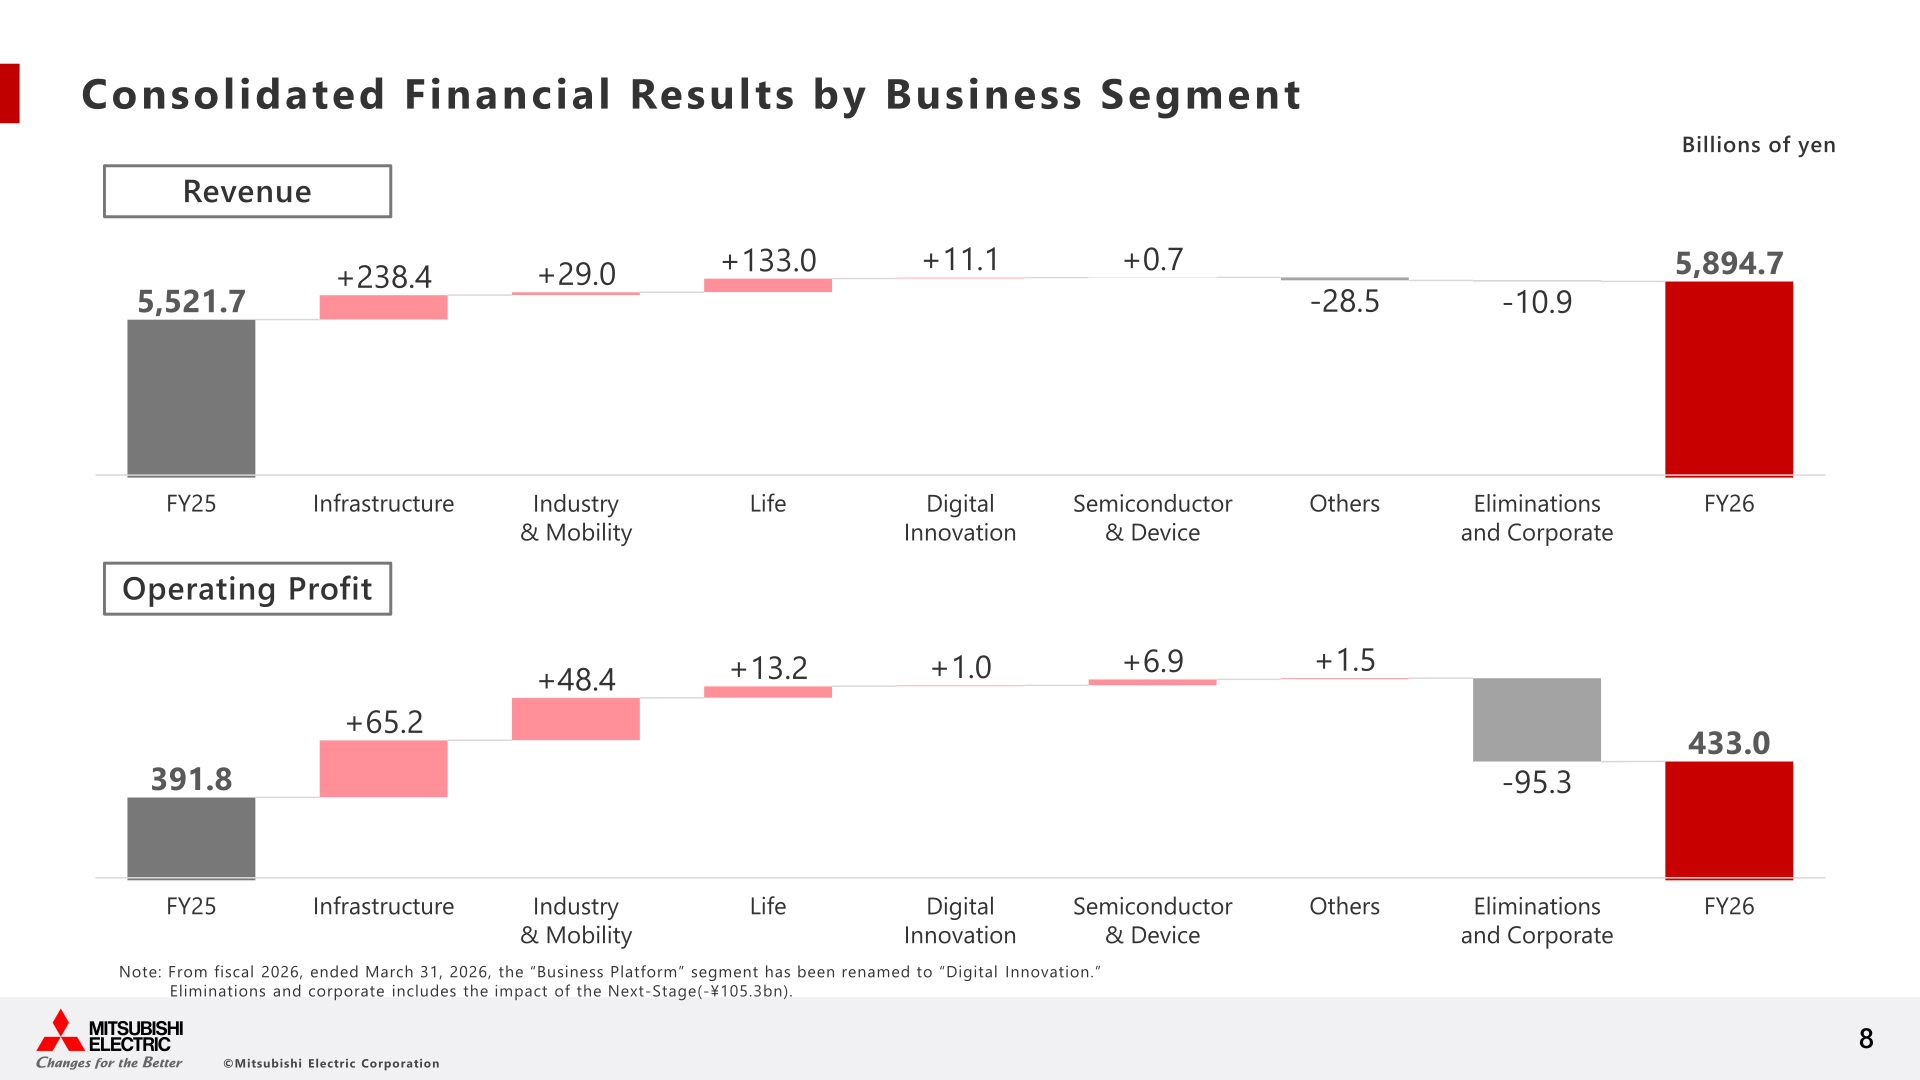
By segment, Infrastructure revenue rose to ¥1,463.4 billion (+¥238.4 billion YoY) with operating profit of ¥154.7 billion (+¥65.2 billion YoY), driven by robust capital expenditure in public utilities and transportation systems worldwide, an increase in the power generation and transmission/distribution businesses, and an increase in large-scale defense systems projects. Industry & Mobility revenue was ¥1,673.8 billion (+¥29.0 billion YoY) with operating profit of ¥131.0 billion (+¥48.4 billion YoY), as factory automation systems benefited from increased capital expenditure related to smartphones and AI-related semiconductors, while automotive equipment revenue declined due to lower sales volume of Japanese car manufacturers in China and a downsizing of the car multimedia business in North America, even as its operating profit rose on product-price improvements and reduced expenses. Life segment revenue was ¥2,318.2 billion (+¥133.0 billion YoY) with operating profit of ¥170.5 billion (+¥13.2 billion YoY); building systems grew partly due to an affiliated company in the Middle East becoming a consolidated subsidiary, while air conditioning systems & home products operating profit declined ¥3.3 billion YoY mainly due to foreign exchange rate changes, increased expenses, and rising material prices. Digital Innovation and Semiconductor & Device both posted higher revenue and operating profit, with Semiconductor & Device operating profit margin reaching 16.6% (+2.4pt YoY) on a shift in product mix.
| Segment / Sub-segment | Revenue FY2026 | Operating profit FY2026 | Op. margin FY2026 | Revenue FY2025 | Operating profit FY2025 | Op. margin FY2025 |
|---|---|---|---|---|---|---|
| Infrastructure | 1,463.4 | 154.7 | 10.6% | 1,224.9 | 89.4 | 7.3% |
| – Public Utility Systems | 568.6 | 68.8 | 12.1% | 474.9 | 33.5 | 7.1% |
| – Energy Systems | 473.3 | 45.3 | 9.6% | 396.1 | 27.5 | 6.9% |
| – Defense & Space Systems | 421.4 | 40.5 | 9.6% | 353.8 | 28.4 | 8.0% |
| Industry & Mobility | 1,673.8 | 131.0 | 7.8% | 1,644.8 | 82.6 | 5.0% |
| – Factory Automation Systems | 798.2 | 76.6 | 9.6% | 725.6 | 46.7 | 6.4% |
| – Automotive Equipment | 875.6 | 54.4 | 6.2% | 919.2 | 35.8 | 3.9% |
| Life | 2,318.2 | 170.5 | 7.4% | 2,185.1 | 157.2 | 7.2% |
| – Building Systems | 707.8 | 66.7 | 9.4% | 666.0 | 50.1 | 7.5% |
| – Air Conditioning Systems & Home Products | 1,610.3 | 103.8 | 6.4% | 1,519.1 | 107.1 | 7.1% |
| Digital Innovation | 158.0 | 11.9 | 7.6% | 146.8 | 10.8 | 7.4% |
| Semiconductor & Device | 287.1 | 47.5 | 16.6% | 286.3 | 40.6 | 14.2% |
| Others | 823.5 | 53.1 | 6.5% | 852.1 | 51.5 | 6.1% |
| Eliminations and corporate | -829.5 | -135.9 | – | -818.5 | -40.6 | – |
| Consolidated Total | 5,894.7 | 433.0 | 7.3% | 5,521.7 | 391.8 | 7.1% |
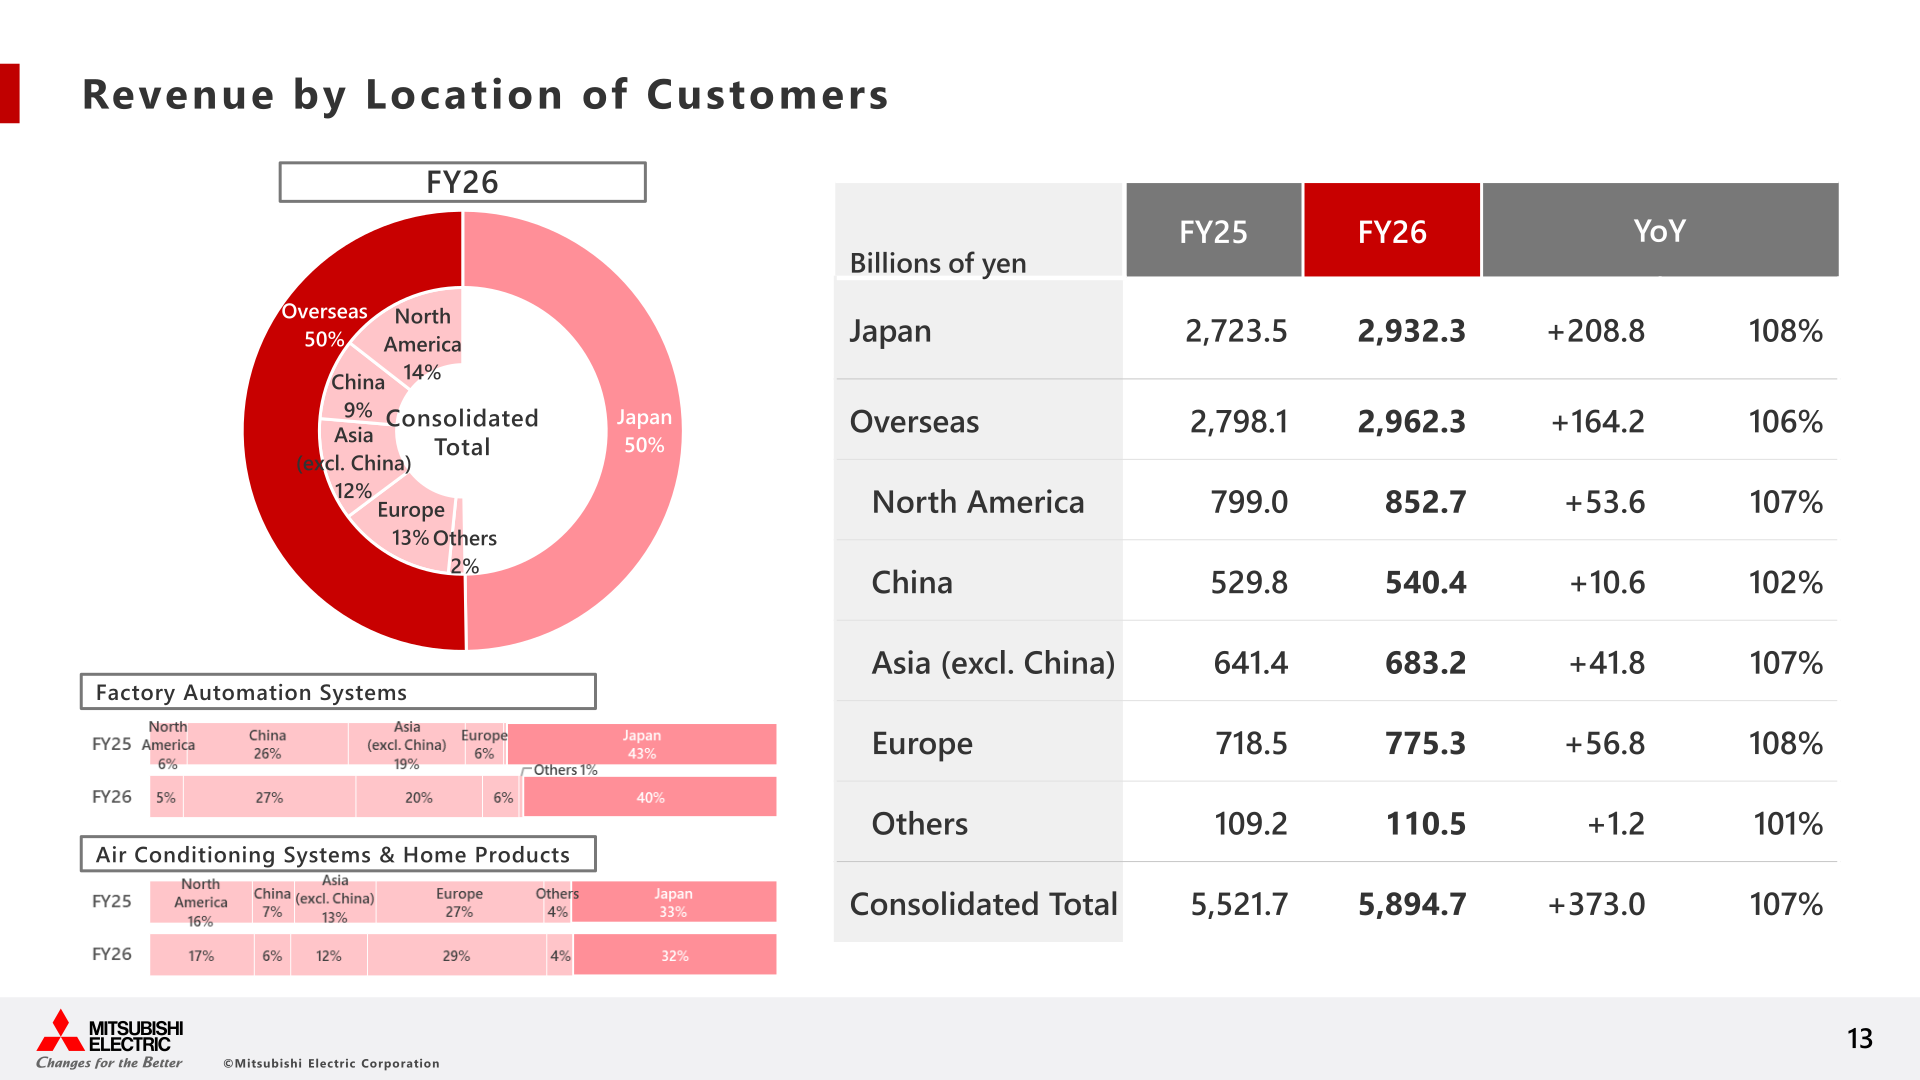
By location of customers, revenue from Japan increased to ¥2,932.3 billion (+¥208.8 billion YoY, 108%) and overseas revenue increased to ¥2,962.3 billion (+¥164.2 billion YoY, 106%), with North America at ¥852.7 billion (+¥53.6 billion), Europe at ¥775.3 billion (+¥56.8 billion), Asia excluding China at ¥683.2 billion (+¥41.8 billion), China at ¥540.4 billion (+¥10.6 billion), and Others at ¥110.5 billion (+¥1.2 billion). Overseas revenue accounted for 50% of consolidated revenue in FY2026.
FY2027 Forecast
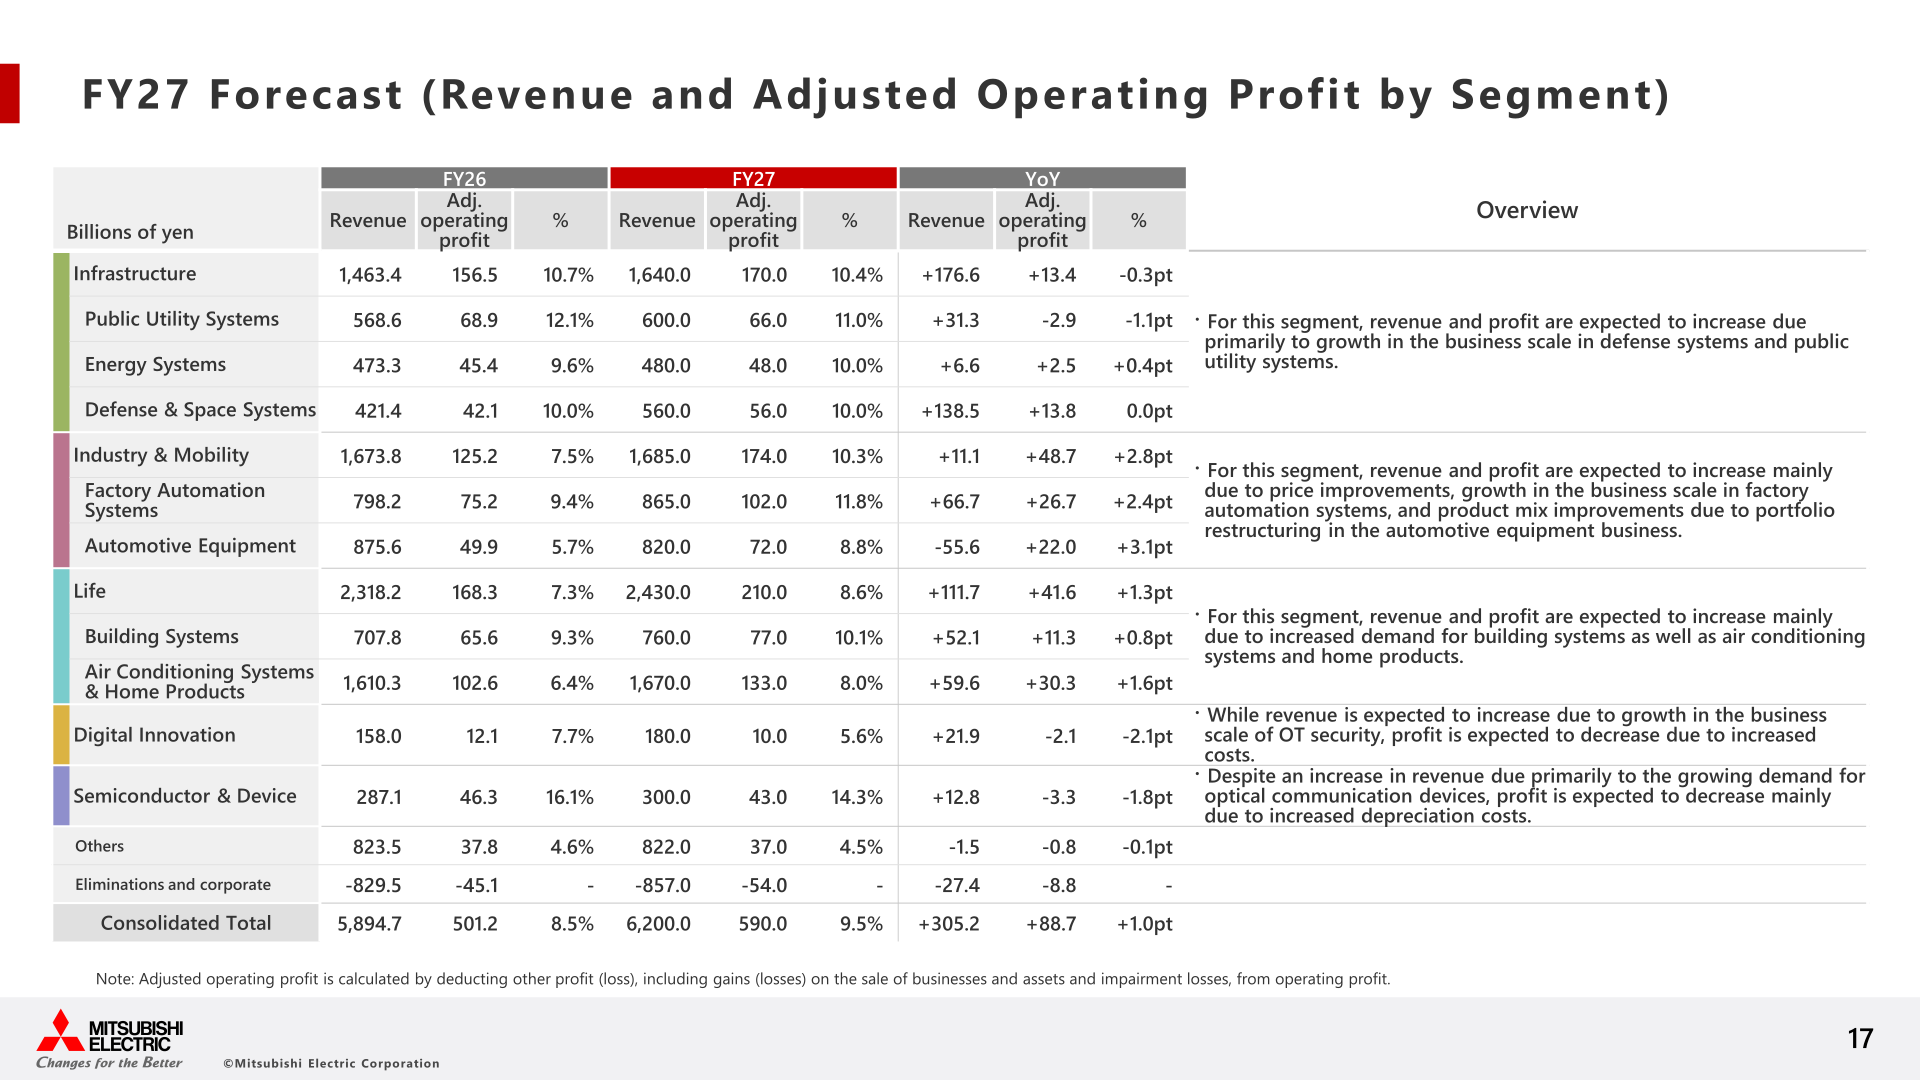
For FY2027, Mitsubishi Electric forecasts revenue of ¥6,200.0 billion (105% of FY2026), adjusted operating profit of ¥590.0 billion (118% of FY2026, margin 9.5%, +1.0pt YoY), profit before income taxes of ¥640.0 billion (122% of FY2026), and net profit attributable to Mitsubishi Electric Corp. stockholders of ¥475.0 billion (117% of FY2026). Both revenue and adjusted operating profit are expected to reach record highs, driven primarily by an expansion in the defense and factory automation systems businesses and the Life segment. Given the situation in the Middle East, the impact of price hikes in raw materials derived from crude oil and in logistics costs has been reflected in the forecast. The forecast assumes exchange rates of ¥150/USD, ¥175/EUR and ¥21.5/CNY for FY2027, versus ¥151/USD, ¥176/EUR and ¥21.4/CNY in FY2026; the company estimates an annual operating profit sensitivity of approximately ¥5.0 billion per ¥1 change in the USD rate, approximately ¥4.0 billion per ¥1 change in the EUR rate, and approximately ¥2.0 billion per ¥0.1 change in the CNY rate.
The +¥88.7 billion year-on-year increase in adjusted operating profit reflects business growth in Defense & Space Systems, Life, and factory automation systems, among other businesses (approximately +¥53.0 billion), together with volume change, price improvements, and the impact of the Next-Stage program (two further components of approximately +¥45.0 billion each), partially offset by higher material costs (approximately -¥54.0 billion). Note: the FY2027 forecast is presented on an “adjusted operating profit” basis, which the company calculates by deducting other profit (loss) — including gains/losses on the sale of businesses and assets and impairment losses — from operating profit; this differs from the plain “operating profit” figures used in the FY2026 actual segment results table above, which is why the FY2026 segment figures shown in the forecast table below differ slightly from those in the actual-results table.
| Segment / Sub-segment | Revenue FY2027 (Forecast) | Adj. operating profit FY2027 (Forecast) | Op. margin FY2027 | Revenue FY2026 | Adj. operating profit FY2026 | Op. margin FY2026 |
|---|---|---|---|---|---|---|
| Infrastructure | 1,640.0 | 170.0 | 10.4% | 1,463.4 | 156.5 | 10.7% |
| – Public Utility Systems | 600.0 | 66.0 | 11.0% | 568.6 | 68.9 | 12.1% |
| – Energy Systems | 480.0 | 48.0 | 10.0% | 473.3 | 45.4 | 9.6% |
| – Defense & Space Systems | 560.0 | 56.0 | 10.0% | 421.4 | 42.1 | 10.0% |
| Industry & Mobility | 1,685.0 | 174.0 | 10.3% | 1,673.8 | 125.2 | 7.5% |
| – Factory Automation Systems | 865.0 | 102.0 | 11.8% | 798.2 | 75.2 | 9.4% |
| – Automotive Equipment | 820.0 | 72.0 | 8.8% | 875.6 | 49.9 | 5.7% |
| Life | 2,430.0 | 210.0 | 8.6% | 2,318.2 | 168.3 | 7.3% |
| – Building Systems | 760.0 | 77.0 | 10.1% | 707.8 | 65.6 | 9.3% |
| – Air Conditioning Systems & Home Products | 1,670.0 | 133.0 | 8.0% | 1,610.3 | 102.6 | 6.4% |
| Digital Innovation | 180.0 | 10.0 | 5.6% | 158.0 | 12.1 | 7.7% |
| Semiconductor & Device | 300.0 | 43.0 | 14.3% | 287.1 | 46.3 | 16.1% |
| Others | 822.0 | 37.0 | 4.5% | 823.5 | 37.8 | 4.6% |
| Eliminations and corporate | -857.0 | -54.0 | – | -829.5 | -45.1 | – |
| Consolidated Total | 6,200.0 | 590.0 | 9.5% | 5,894.7 | 501.2 | 8.5% |
By segment, Infrastructure revenue and profit are expected to increase due primarily to growth in business scale in defense systems and public utility systems. Industry & Mobility revenue and profit are expected to increase mainly due to price improvements, growth in the business scale of factory automation systems, and product mix improvements from portfolio restructuring in the automotive equipment business. Life segment revenue and profit are expected to increase mainly due to increased demand for building systems as well as air conditioning systems and home products. Digital Innovation revenue is expected to increase on growth in OT security, but profit is expected to decrease due to increased costs. Semiconductor & Device revenue is expected to increase on growing demand for optical communication devices, but profit is expected to decrease mainly due to increased depreciation costs.
Shareholder Returns
The materials state that, while continuing to invest for future growth, the Mitsubishi Electric Group aims to generate stable free cash flow and deliver consistent returns to shareholders. Specific dividend per share, payout ratio, or share buyback figures are not disclosed in this presentation. This cannot be confirmed from the materials.
This article is an analysis based on publicly available information and is not a recommendation to buy or sell any specific securities. Investment decisions are your own responsibility.
![[Obayashi] Investors’ Guide 2026 — The Complete 24-Article Breakdown](https://japan-equity.com/wp-content/uploads/2026/07/hub_cover-1024x1024.png)
![[Obayashi] IR & SR Policy — Feeding Dialogue Back into Management](https://japan-equity.com/wp-content/uploads/2026/07/p32_sq-1024x1024.jpg)
![[Obayashi] Real Estate Development — 18.7% Margin, ¥287.7bn Unrealized Gains](https://japan-equity.com/wp-content/uploads/2026/07/p20_sq-1024x1024.jpg)
![[Obayashi] Domestic Civil Engineering — Resilience Spending Supports 9.6% Margin](https://japan-equity.com/wp-content/uploads/2026/07/p11_sq-1024x1024.jpg)
![[Obayashi] Share Price & External Ratings — vs TOPIX, ESG Index Inclusion](https://japan-equity.com/wp-content/uploads/2026/07/p40_sq-1024x1024.jpg)
![[Construction] ¥75.5tn Investment, Shrinking Workforce — Big-5 Market Share](https://japan-equity.com/wp-content/uploads/2026/07/p12_sq-1024x1024.jpg)



![[Obayashi] Capital Policy & Shareholder Returns — ROE 10%+, DOE ~5%, ¥100bn Buyback](https://japan-equity.com/wp-content/uploads/2026/07/p27_sq-1024x1024.jpg)
![[Obayashi] Reducing Cross-Shareholdings — ¥285.2bn Sold in Five Years](https://japan-equity.com/wp-content/uploads/2026/07/p29_sq-1024x1024.jpg)
![[Obayashi] ¥750bn Investment Plan — ¥300bn to Development, ¥190bn to Tech/DX](https://japan-equity.com/wp-content/uploads/2026/07/p30_sq-1024x1024.jpg)
![[Obayashi] MTP2022 KPIs — Operating Profit ~2x Target, ROE 14.4%](https://japan-equity.com/wp-content/uploads/2026/07/p25_sq-1024x1024.jpg)
![[Obayashi] Cash Allocation — ¥420bn Investment CF Over Five Years](https://japan-equity.com/wp-content/uploads/2026/07/p26_sq-1024x1024.jpg)
![[Obayashi] Green Energy — 44 Plants, 344MW, and the Green Hydrogen Challenge](https://japan-equity.com/wp-content/uploads/2026/07/p21_sq-1024x1024.jpg)
![[Obayashi] Tackling the Labor Shortage — Robotics Construction®](https://japan-equity.com/wp-content/uploads/2026/07/p14_sq-1024x1024.jpg)
