
This article is based on publicly available IR materials and is not a recommendation to buy or sell any specific securities.
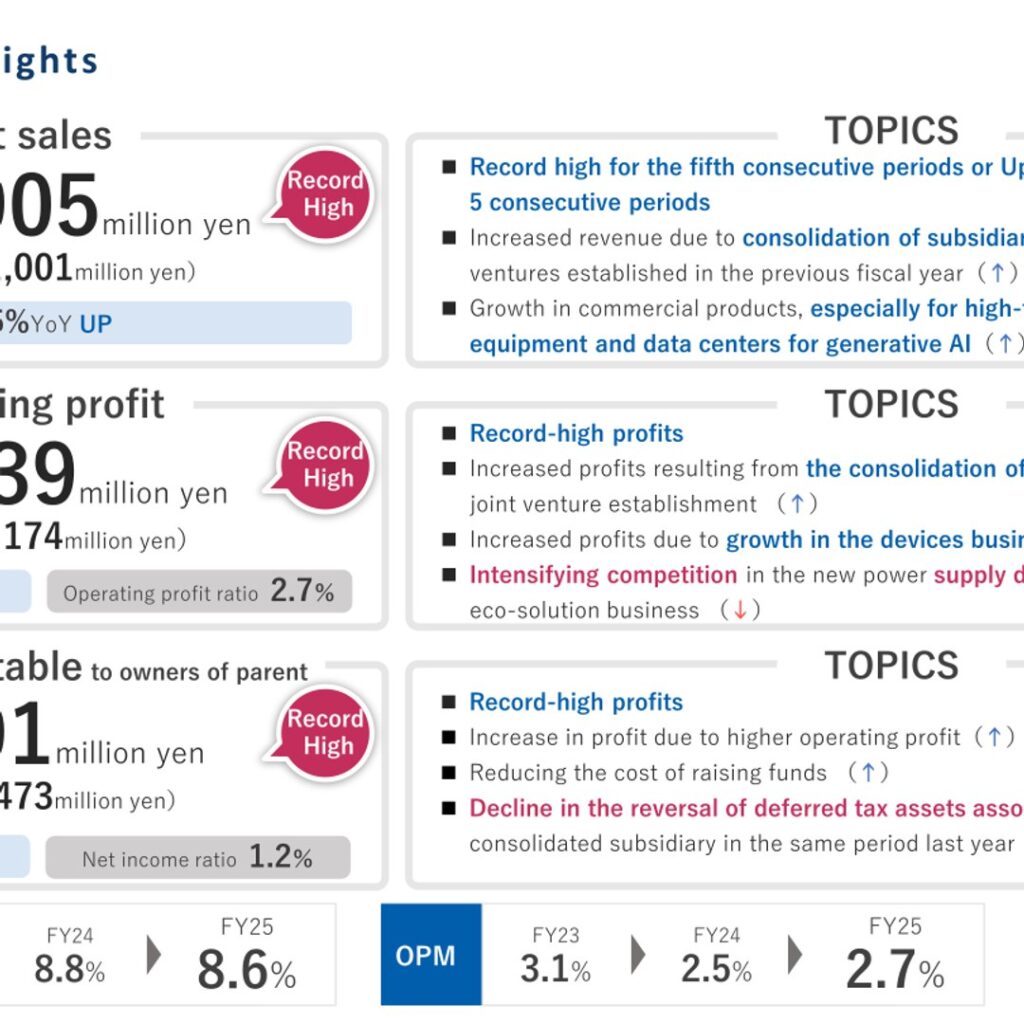
Restar Corporation (TSE Prime: 3156), an electronics trading group that positions itself as an “Electronics Value Platformer,” reported record-high results for FY25, the fiscal year ended March 2026. Net sales rose 12.5% year on year to 630,905 million yen and operating profit rose 18.1% to 16,739 million yen, both record highs, while profit attributable to owners of parent edged up 2.9% to 7,691 million yen — a record high for the fifth consecutive period. Growth was driven by the devices business and by the consolidation of subsidiaries through M&A and joint ventures. For the following year (FY26), the company forecasts net sales of 700,000 million yen and profit attributable to owners of parent of 10,000 million yen.
Note: The company’s materials label the completed fiscal year (ended March 2026) as “FY25” and the next fiscal year (ending March 2027) as “FY26.” On this site that completed year is classified as FY2025; the body text and tables below follow the company’s own labels.
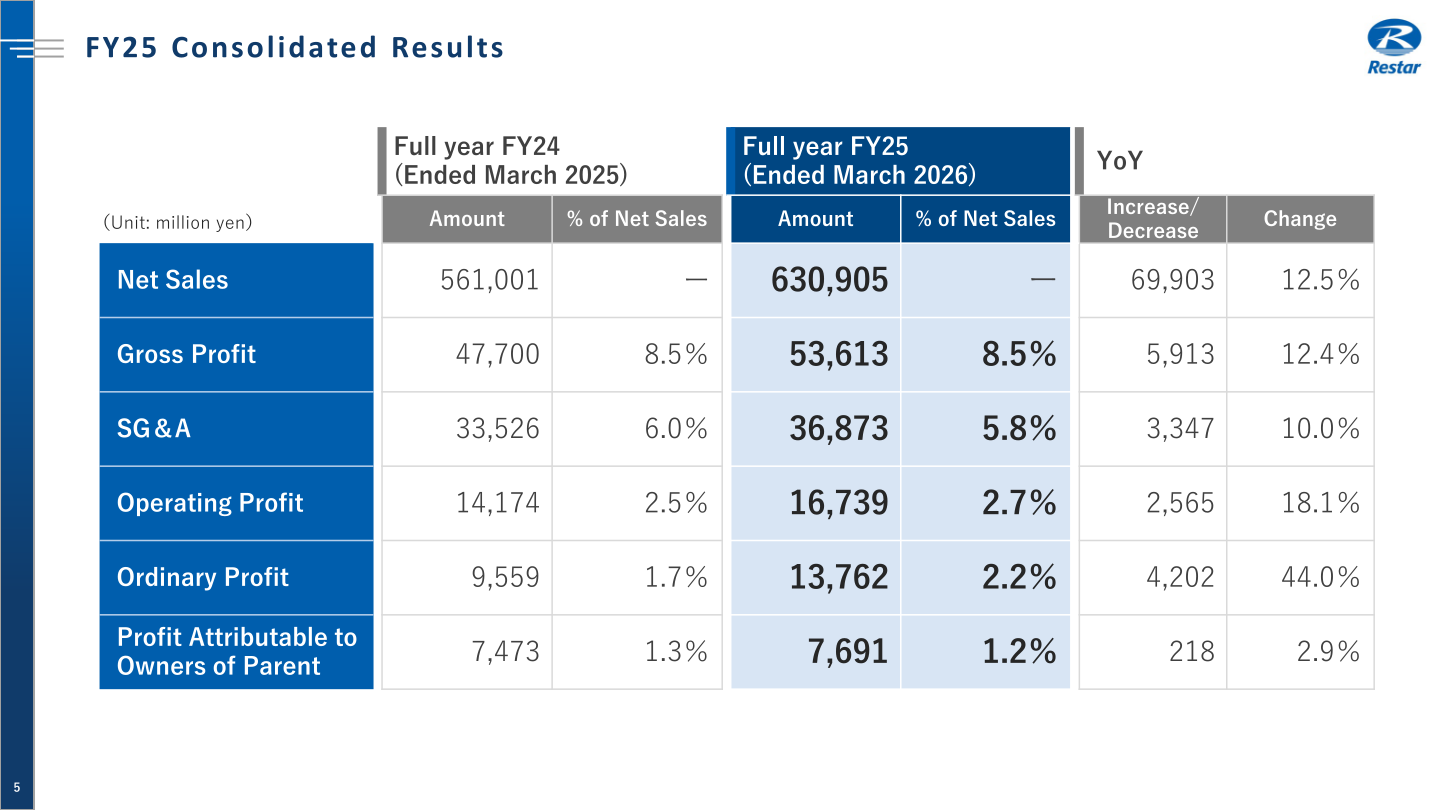
Consolidated Results (Full-Year Actual)
All four headline profit lines and net sales reached record highs. Ordinary profit jumped 44.0% year on year to 13,762 million yen, helped by a lower cost of raising funds. Operating profit margin was 2.7% and the net income ratio was 1.2%. ROE was 8.6%, ROIC 5.1% and the operating profit margin 2.7% for FY25.
| Item | FY24 (Ended Mar 2025) | FY25 (Ended Mar 2026) | Increase/Decrease | Change |
|---|---|---|---|---|
| Net Sales | 561,001 | 630,905 | 69,903 | 12.5% |
| Gross Profit | 47,700 | 53,613 | 5,913 | 12.4% |
| SG&A | 33,526 | 36,873 | 3,347 | 10.0% |
| Operating Profit | 14,174 | 16,739 | 2,565 | 18.1% |
| Ordinary Profit | 9,559 | 13,762 | 4,202 | 44.0% |
| Profit Attributable to Owners of Parent | 7,473 | 7,691 | 218 | 2.9% |
Unit: million yen. Source: Financial Results Briefing Materials (FY25), P.5.
Segment Results
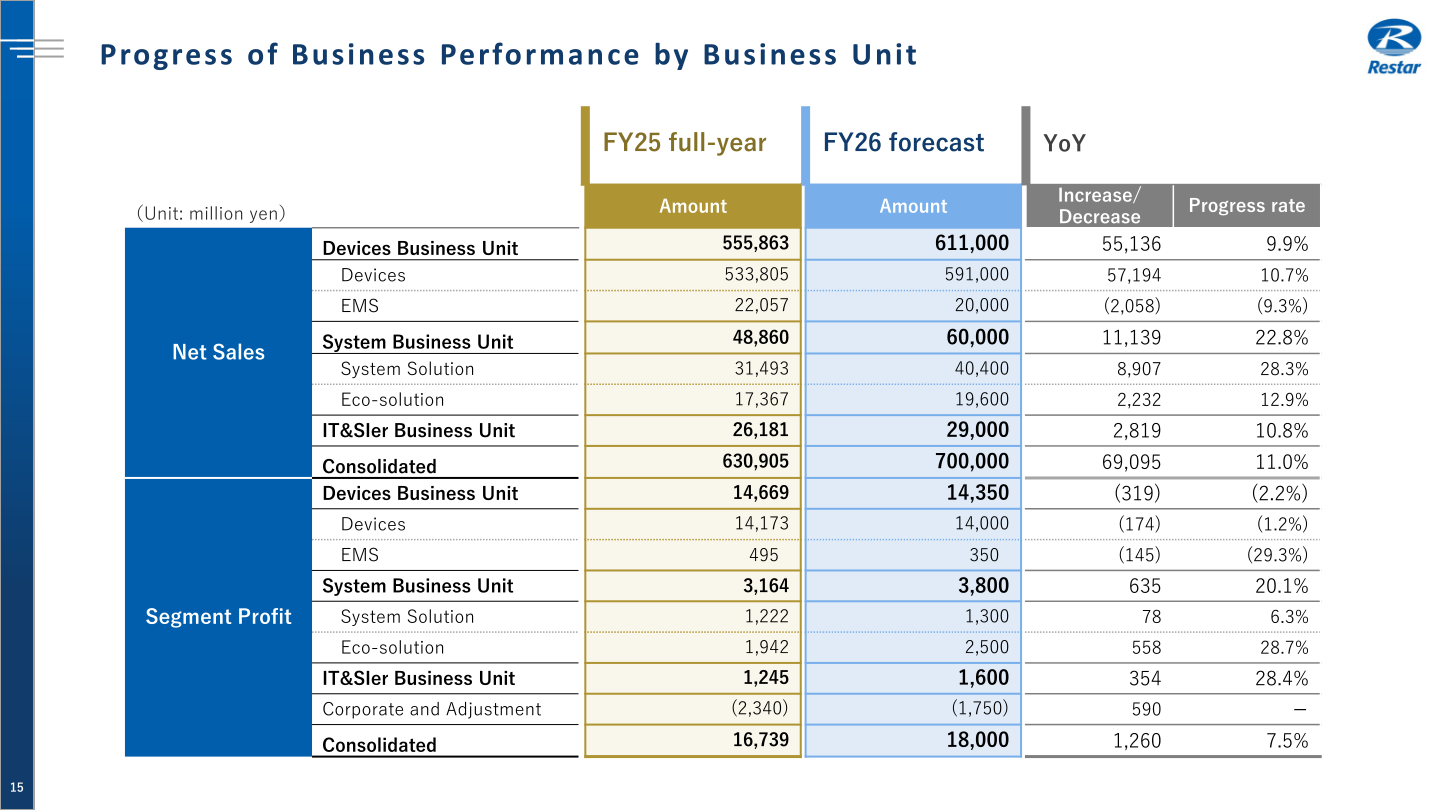
In the Devices Business Unit, sales rose on the consolidation of subsidiaries (Restar Dexerials Hong Kong, Korea and Taiwan) and strong demand for products for data centers serving generative AI, high-performance cameras and PC-related equipment; EMS sales declined on the absence of new smartphone-model demand. The System Business Unit saw lower sales, with the Eco-solution business hit by intensifying competition in the new-electricity supply-demand adjustment market. Figures below are on a consolidated basis (unit: million yen).
| Business Unit / Segment | Metric | FY24 (Ended Mar 2025) | FY25 (Ended Mar 2026) |
|---|---|---|---|
| Devices Business Unit | Net Sales | 495,243 | 555,863 |
| – Devices | Net Sales | 466,453 | 533,805 |
| – EMS | Net Sales | 28,789 | 22,057 |
| Devices Business Unit | Segment Profit | 11,213 | 14,669 |
| – Devices | Segment Profit | 10,491 | 14,173 |
| – EMS | Segment Profit | 721 | 495 |
| System Business Unit | Net Sales | 52,678 | 48,860 |
| – System Solution | Net Sales | 32,025 | 31,493 |
| – Eco-solution | Net Sales | 20,652 | 17,367 |
| System Business Unit | Segment Profit | 4,197 | 3,164 |
| – System Solution | Segment Profit | 716 | 1,222 |
| – Eco-solution | Segment Profit | 3,480 | 1,942 |
For the IT&SIer Business Unit, figures on the company’s consolidated basis were net sales of 26,181 million yen and segment profit of 1,245 million yen for FY25 (P.9, P.15). The unit’s own reference values (excerpted from PCI Holdings, INC.) were net sales of 25,747 million yen (FY24) rising to 26,835 million yen (FY25) and segment profit of 1,151 million yen (FY24) rising to 1,558 million yen (FY25).
FY26 Forecast
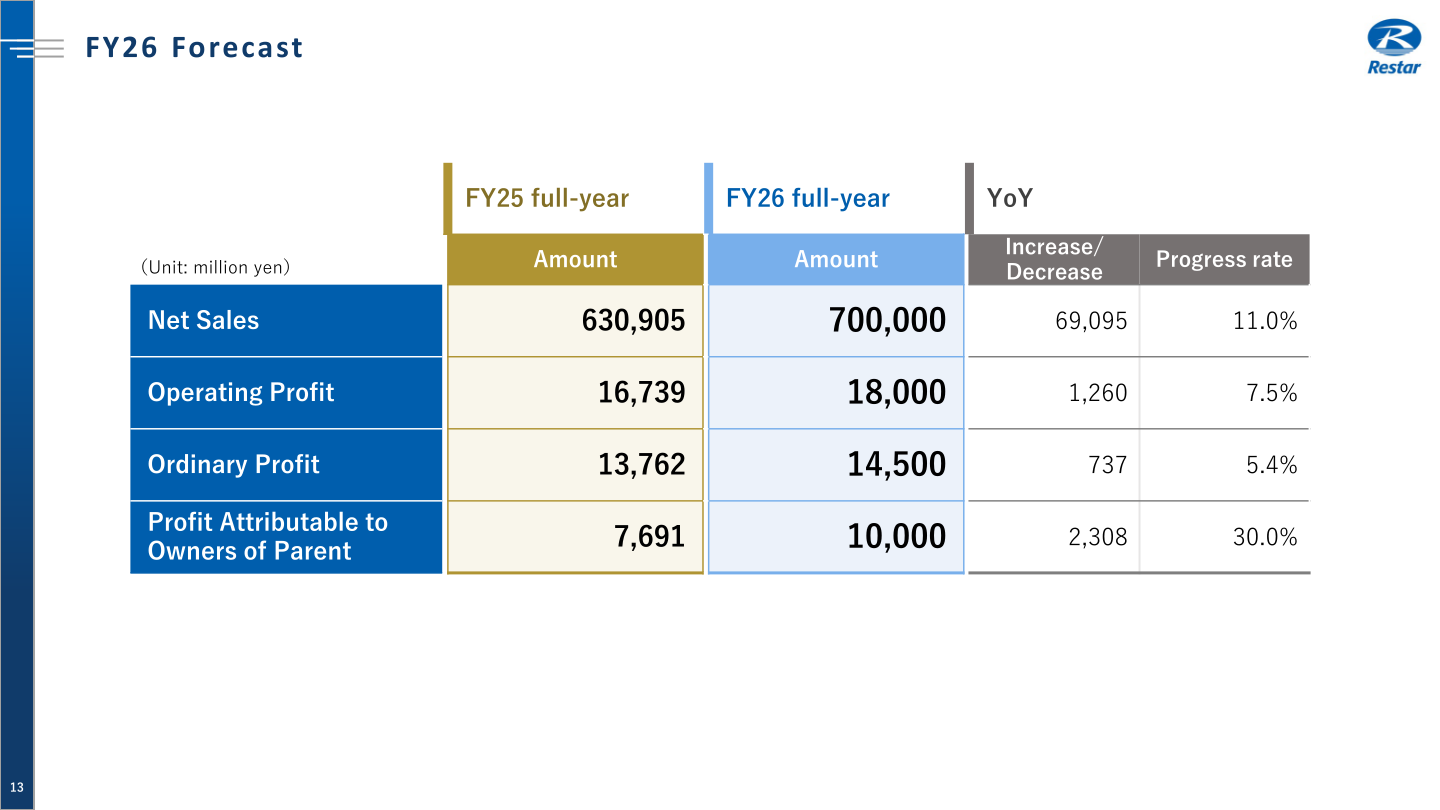
For FY26 (the fiscal year ending March 2027), Restar forecasts further growth across all headline lines, with profit attributable to owners of parent projected to rise 30.0% to 10,000 million yen. Management targets net sales of 1 trillion yen over the longer term.
| Item | FY25 Full-Year (Actual) | FY26 Full-Year (Forecast) | Increase/Decrease | Change |
|---|---|---|---|---|
| Net Sales | 630,905 | 700,000 | 69,095 | 11.0% |
| Operating Profit | 16,739 | 18,000 | 1,260 | 7.5% |
| Ordinary Profit | 13,762 | 14,500 | 737 | 5.4% |
| Profit Attributable to Owners of Parent | 7,691 | 10,000 | 2,308 | 30.0% |
Unit: million yen. Source: Financial Results Briefing Materials (FY25), P.13.
| Business Unit / Segment | Metric | FY25 (Actual) | FY26 (Forecast) |
|---|---|---|---|
| Devices Business Unit | Net Sales | 555,863 | 611,000 |
| – Devices | Net Sales | 533,805 | 591,000 |
| – EMS | Net Sales | 22,057 | 20,000 |
| System Business Unit | Net Sales | 48,860 | 60,000 |
| – System Solution | Net Sales | 31,493 | 40,400 |
| – Eco-solution | Net Sales | 17,367 | 19,600 |
| IT&SIer Business Unit | Net Sales | 26,181 | 29,000 |
| Consolidated | Net Sales | 630,905 | 700,000 |
| Devices Business Unit | Segment Profit | 14,669 | 14,350 |
| System Business Unit | Segment Profit | 3,164 | 3,800 |
| IT&SIer Business Unit | Segment Profit | 1,245 | 1,600 |
| Corporate and Adjustment | Segment Profit | (2,340) | (1,750) |
| Consolidated | Operating Profit | 16,739 | 18,000 |
Shareholder Returns
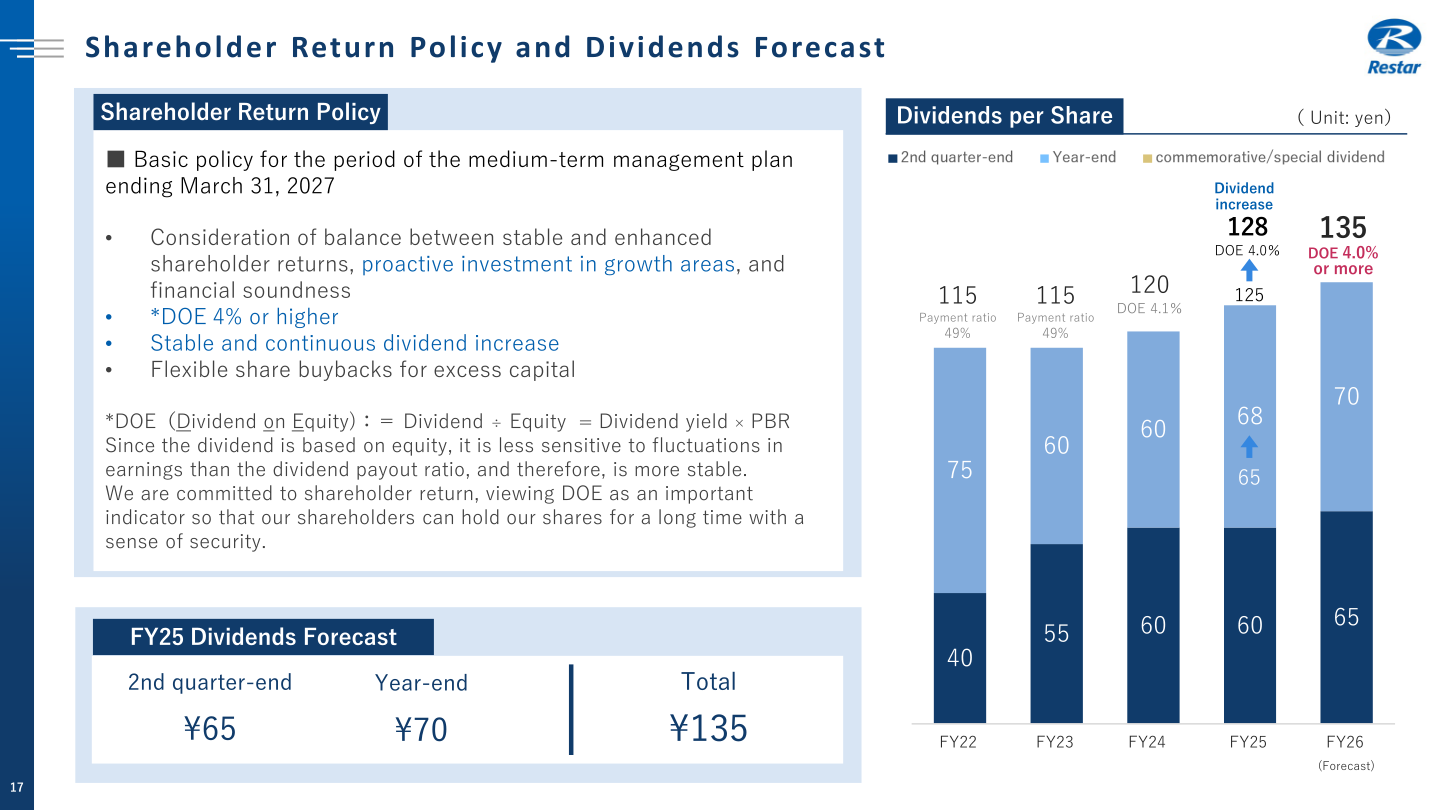
For FY25, Restar’s dividend per share was 135 yen (interim 65 yen plus year-end 70 yen), equivalent to a DOE (dividend on equity) of 4.0% or more, up from 115 yen in FY24 (payout ratio 49%). Under the medium-term management plan ending March 2027, the basic shareholder-return policy is to balance stable and enhanced returns with proactive growth investment and financial soundness, targeting DOE of 4% or higher, stable and continuous dividend increases, and flexible share buybacks for excess capital.
Medium-Term Management Plan (Final Year)
FY26 (ending March 2027) is the final year of the current medium-term management plan. In the plan revised and disclosed on 2026/5/14, the final-year targets were lowered to ROE of 10.5%, ROIC of 5.5% and an operating profit margin of 2.6% or more, from the earlier plan (disclosed 2025/5/13) of ROE 11.0%, ROIC 6.0% and an operating profit margin of 3.5% or more. The revision reflects factors in the Devices BU (delayed recovery in industrial machinery, deterioration in product mix, a revised timing of global-business partnerships and a revised EMS growth strategy) and in the System BU (stagnating automotive and consumer segments, slowing growth in system equipment such as payment terminals, and changes in the power-industry environment).
This article is an analysis based on publicly available information and is not a recommendation to buy or sell any specific securities. Investment decisions are your own responsibility.
















