
This article is based on publicly available IR materials and is not a recommendation to buy or sell any specific securities.
Note: The Monogatari Corporation’s fiscal year ends in June. This article covers the fiscal year ended June 30, 2026 — which the company labels “FY6/26” and is its most recently completed full year. In line with this site’s convention it is classified here as “FY2025”; all figures, tables and labels below follow the company’s own “FY6/25” (prior year), “FY6/26” (results) and “FY6/27” (forecast) notation.
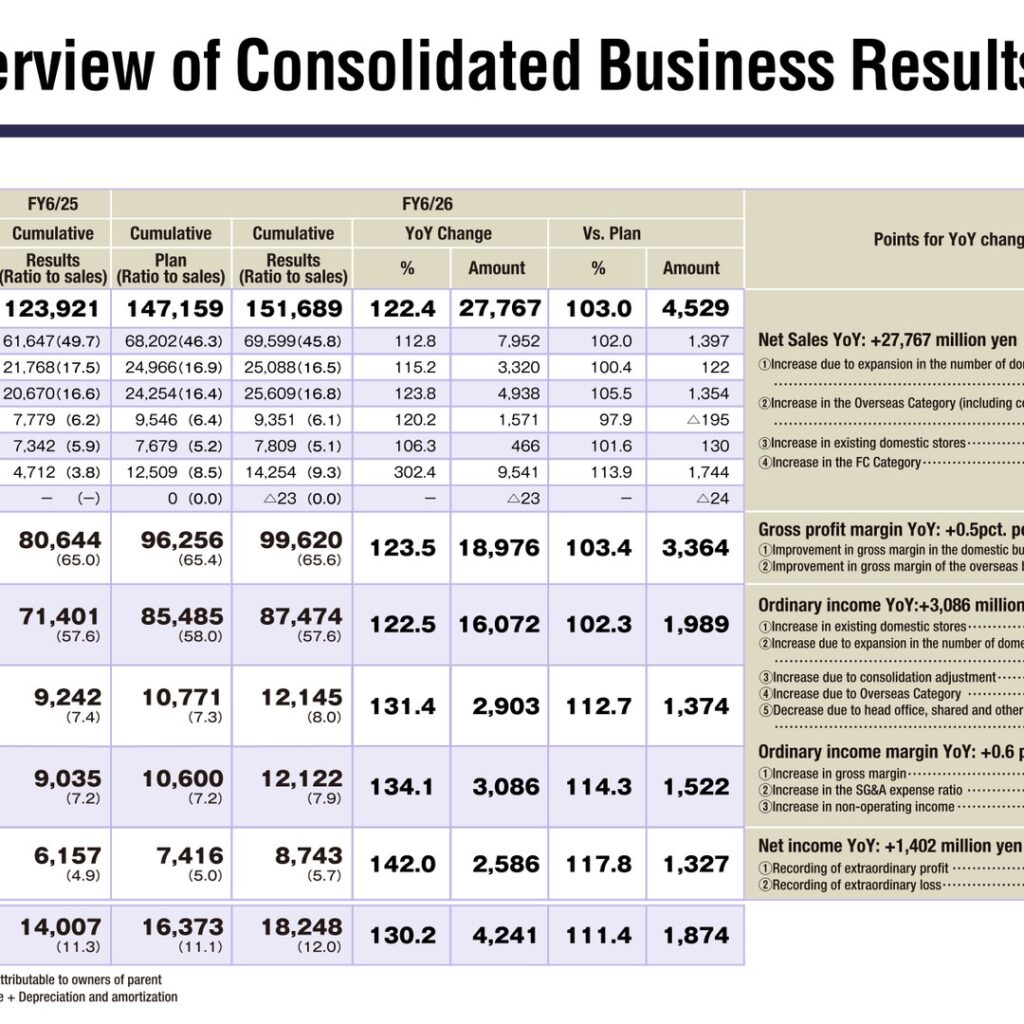
The Monogatari Corporation reported full-year net sales of 151,689 million yen for FY6/26, up 22.4% year on year, with operating income of 12,145 million yen (up 31.4%), ordinary income of 12,122 million yen (up 34.1%) and net income of 8,743 million yen (up 42.0%). Growth was driven by higher same-store sales in Japan (up 5.0% year on year), an increase in the number of domestic and overseas restaurants, and an improvement in the gross profit margin. Overseas Category net sales rose to 14,254 million yen, more than tripling from the prior year.
Consolidated Results (Full-Year Actual)
Net sales increased 27,767 million yen year on year. The company attributes this to expansion in the number of domestic stores (+12,772 million yen), growth in the Overseas Category including consolidation adjustment (+9,517 million yen), higher sales at existing domestic stores (+5,047 million yen) and the FC Category (+428 million yen). The gross profit margin improved 0.5 percentage points. Net income included extraordinary income of 148 million yen from insurance income and an extraordinary loss of 582 million yen relating to disposal of non-current assets and restaurant closures. EBITDA is defined by the company as ordinary income plus depreciation and amortization.
| Item (¥mn) | FY6/25 | FY6/26 | YoY Change |
|---|---|---|---|
| Net sales | 123,921 | 151,689 | +27,767 |
| Gross profit | 80,644 | 99,620 | +18,976 |
| SG&A expenses | 71,401 | 87,474 | +16,072 |
| Operating income | 9,242 | 12,145 | +2,903 |
| Ordinary income | 9,035 | 12,122 | +3,086 |
| Net income | 6,157 | 8,743 | +2,586 |
| EBITDA | 14,007 | 18,248 | +4,241 |
Segment Results
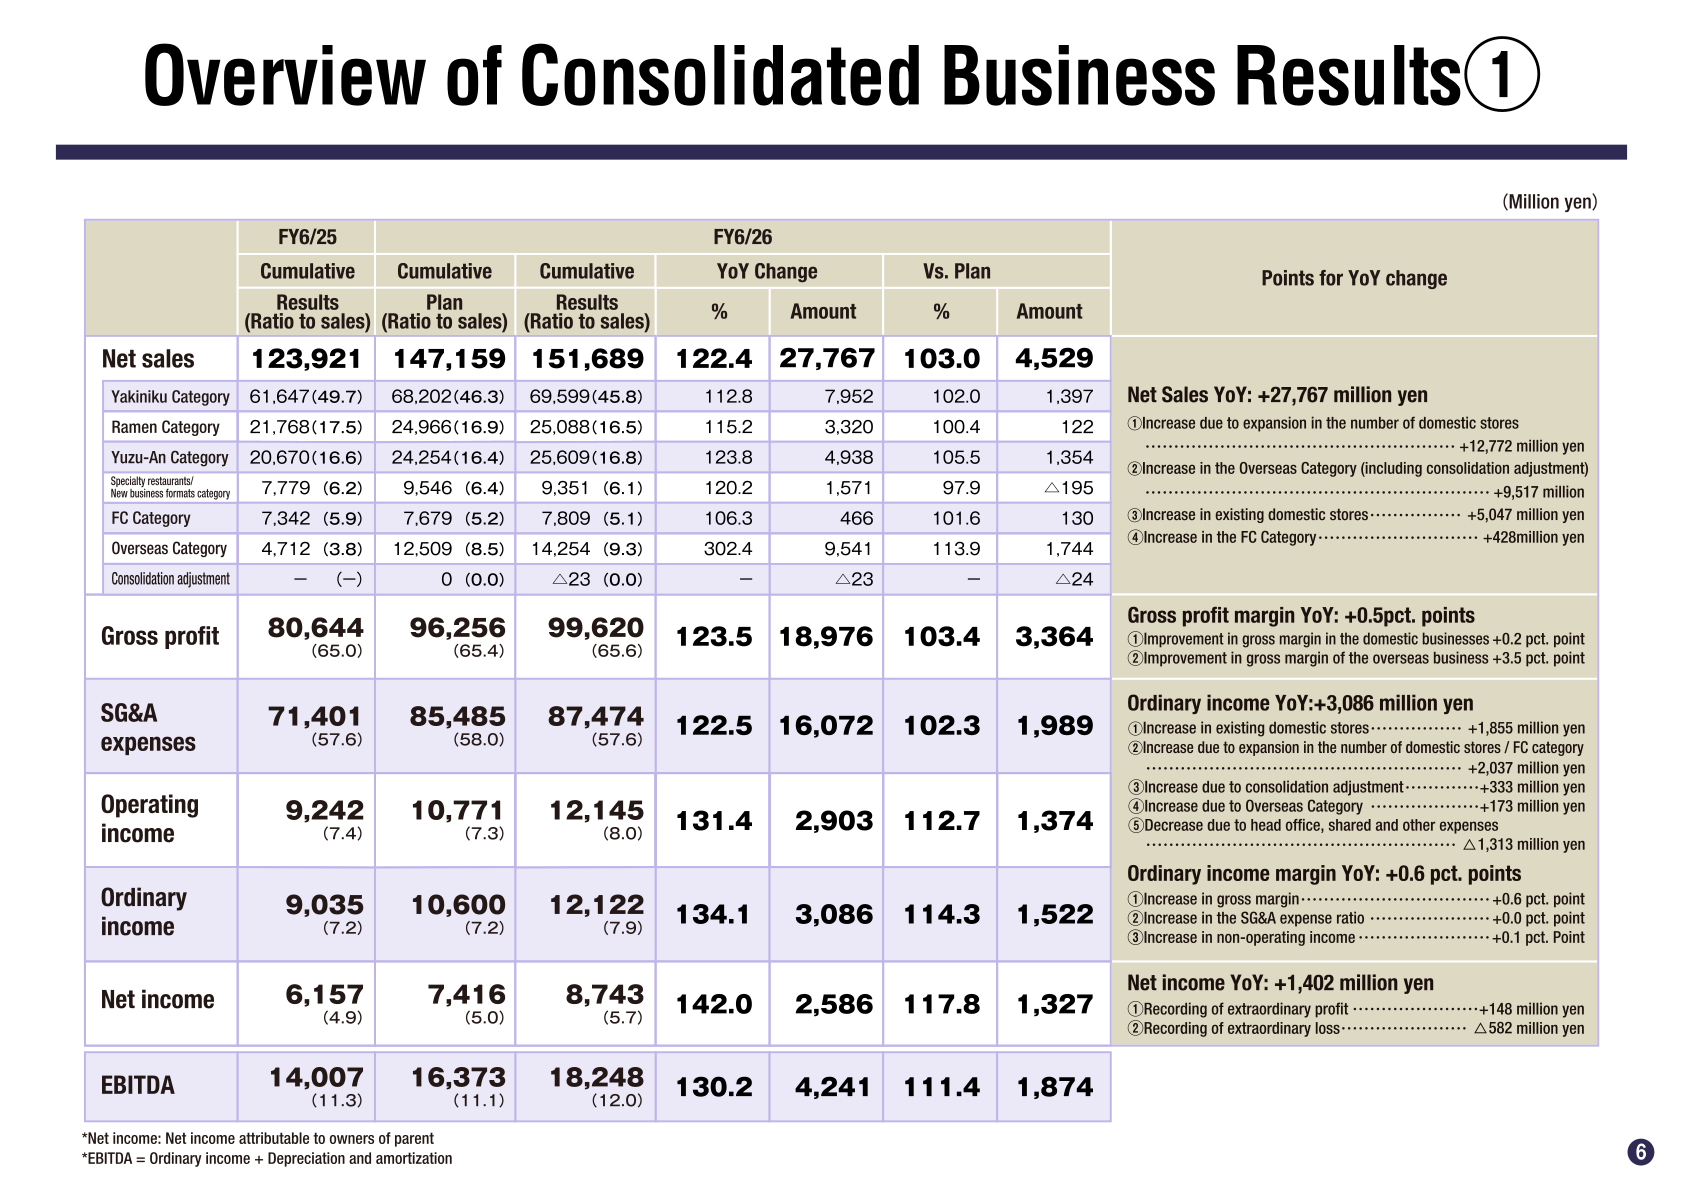
By category, net sales rose in every business. The Yakiniku Category (mainly Yakiniku King) reached 69,599 million yen, the Ramen Category (mainly Marugen Ramen) 25,088 million yen, and the Yuzu-An Category 25,609 million yen. The Overseas Category grew to 14,254 million yen from 4,712 million yen, reflecting the start of consolidation of the U.S. business into the income statement. Same-store sales in Japan were up 5.0% year on year, with the Yakiniku, Ramen, Yuzu-An and Specialty Restaurants/New Business Formats categories all up year on year. The percentage in the right-hand column is the company’s ratio to the prior year (prior year = 100).
| Category — Net sales (¥mn) | FY6/25 | FY6/26 | vs. FY6/25 (prior yr=100) |
|---|---|---|---|
| Yakiniku Category | 61,647 | 69,599 | 112.8 |
| Ramen Category | 21,768 | 25,088 | 115.2 |
| Yuzu-An Category | 20,670 | 25,609 | 123.8 |
| Specialty restaurants / New business formats | 7,779 | 9,351 | 120.2 |
| FC Category | 7,342 | 7,809 | 106.3 |
| Overseas Category | 4,712 | 14,254 | 302.4 |
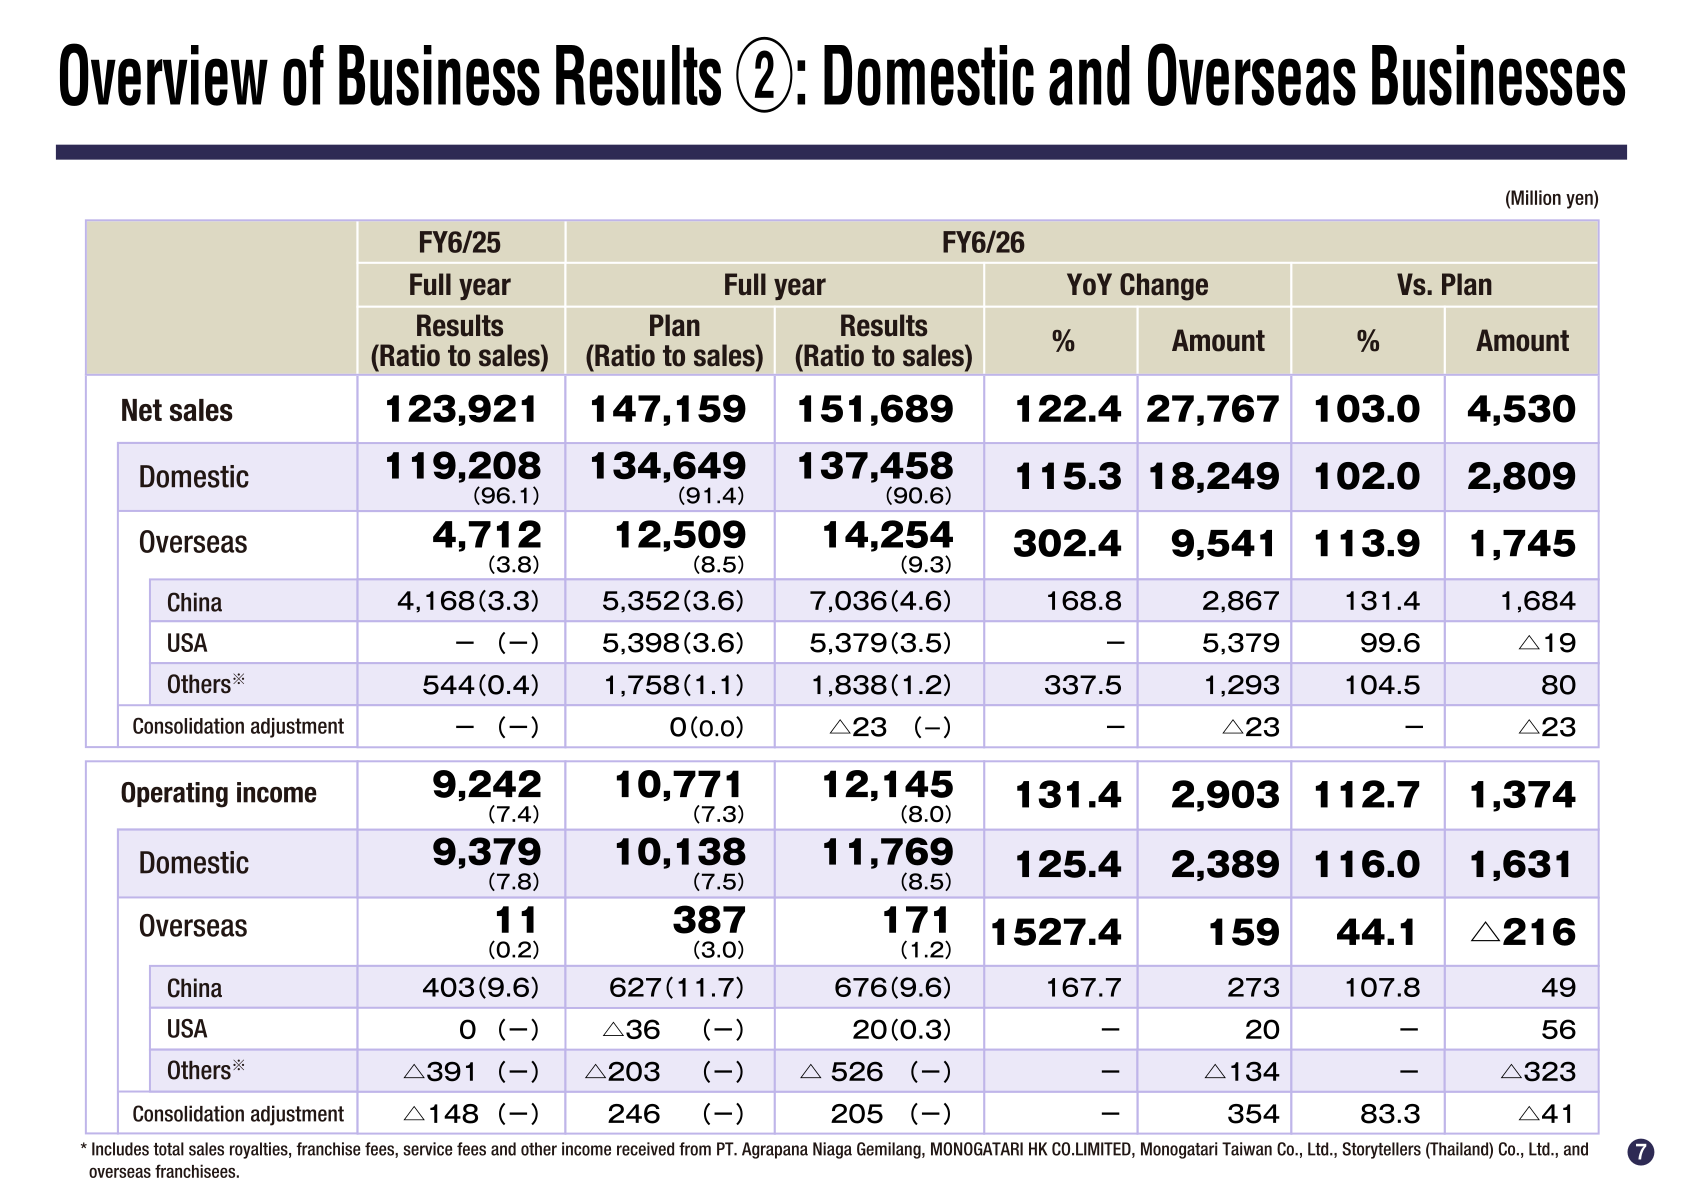
Split by geography, domestic net sales were 137,458 million yen (up 18,249 million yen) and overseas net sales were 14,254 million yen (up 9,541 million yen). Within overseas, China contributed 7,036 million yen, the USA 5,379 million yen (newly consolidated) and Others 1,838 million yen. Domestic operating income rose to 11,769 million yen from 9,379 million yen, while overseas operating income rose to 171 million yen from 11 million yen.
| Geography — Net sales (¥mn) | FY6/25 | FY6/26 | YoY Change |
|---|---|---|---|
| Domestic | 119,208 | 137,458 | +18,249 |
| Overseas | 4,712 | 14,254 | +9,541 |
| China | 4,168 | 7,036 | +2,867 |
| USA | — | 5,379 | +5,379 |
| Others | 544 | 1,838 | +1,293 |
Full-Year Forecast (FY6/27)
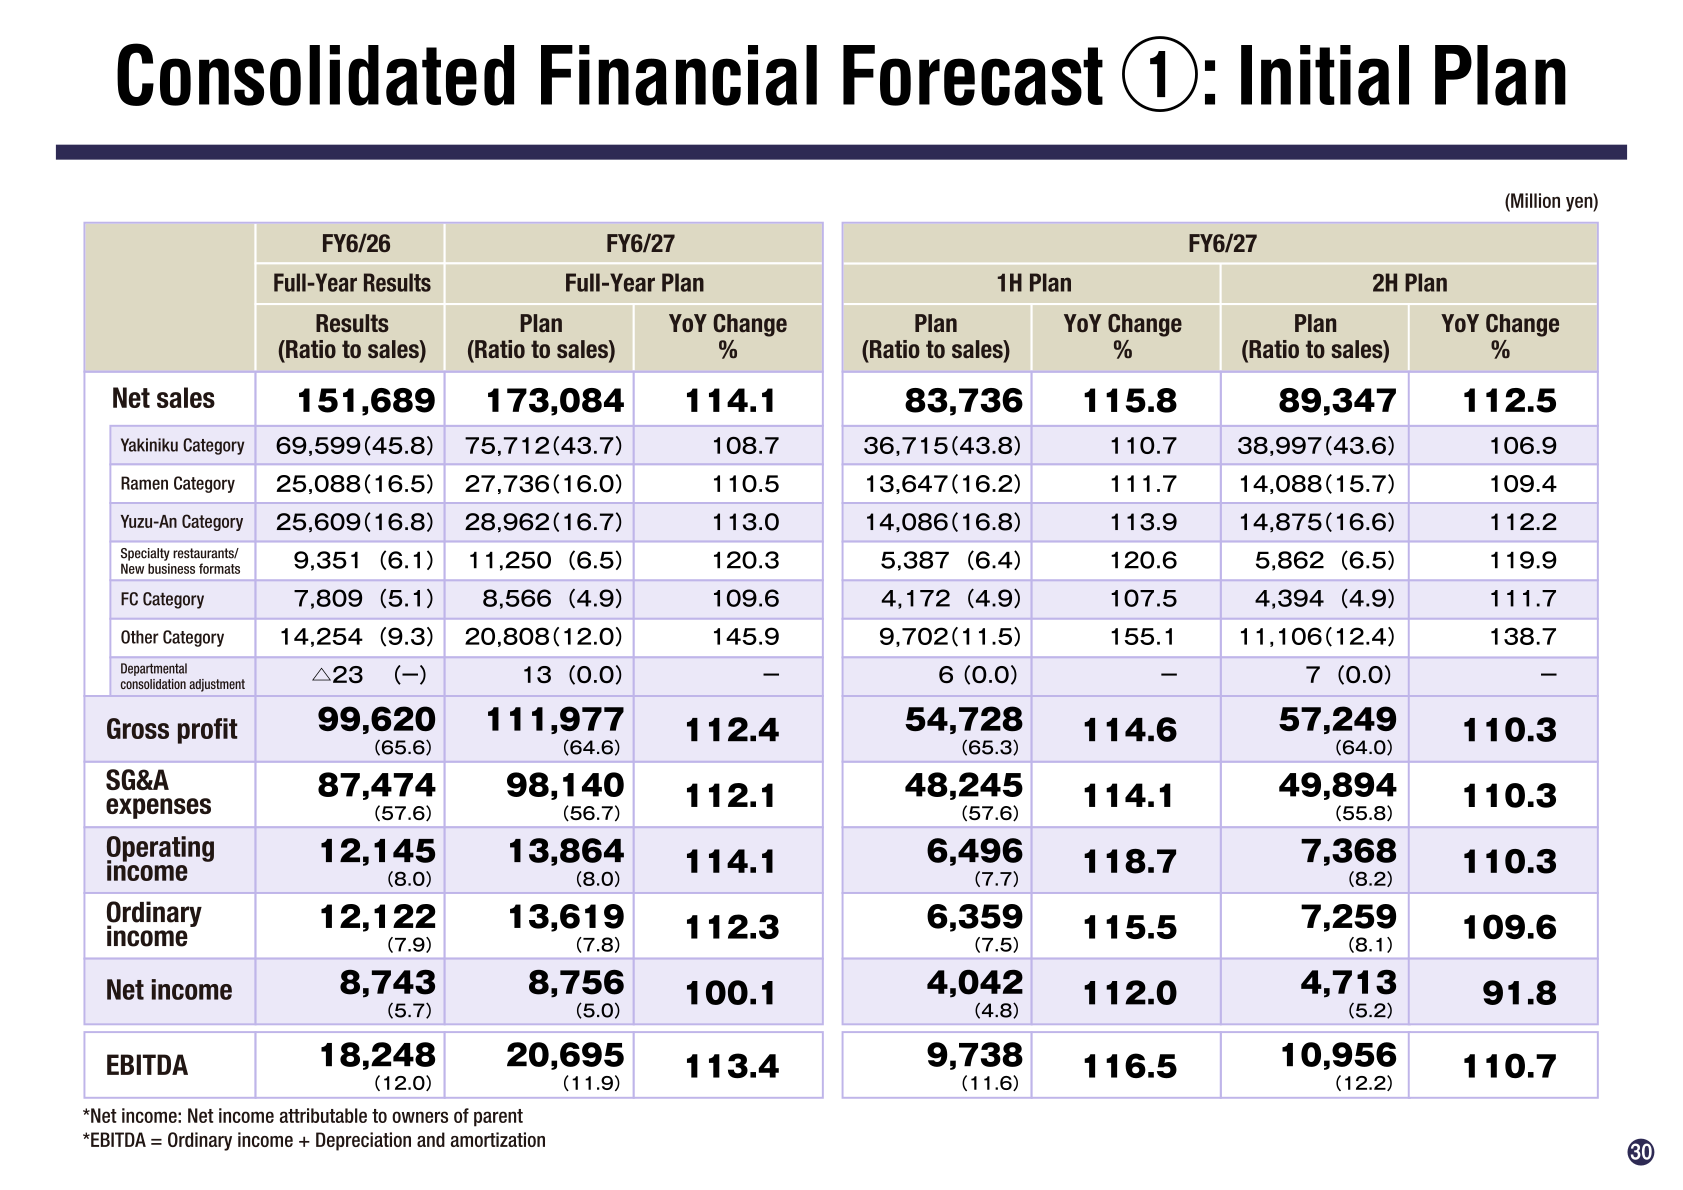
For FY6/27, the company’s initial plan calls for net sales of 173,084 million yen (up 14.1%), operating income of 13,864 million yen (up 14.1%), ordinary income of 13,619 million yen (up 12.3%) and net income of 8,756 million yen (up 0.1%). Overseas Category net sales are planned at 20,808 million yen (up 45.9%). The percentage column is the company’s ratio to the prior year (prior year = 100).
| Item (¥mn) | FY6/26 (Actual) | FY6/27 (Plan) | vs. FY6/26 (prior yr=100) |
|---|---|---|---|
| Net sales | 151,689 | 173,084 | 114.1 |
| Gross profit | 99,620 | 111,977 | 112.4 |
| SG&A expenses | 87,474 | 98,140 | 112.1 |
| Operating income | 12,145 | 13,864 | 114.1 |
| Ordinary income | 12,122 | 13,619 | 112.3 |
| Net income | 8,743 | 8,756 | 100.1 |
| EBITDA | 18,248 | 20,695 | 113.4 |
Shareholder Returns
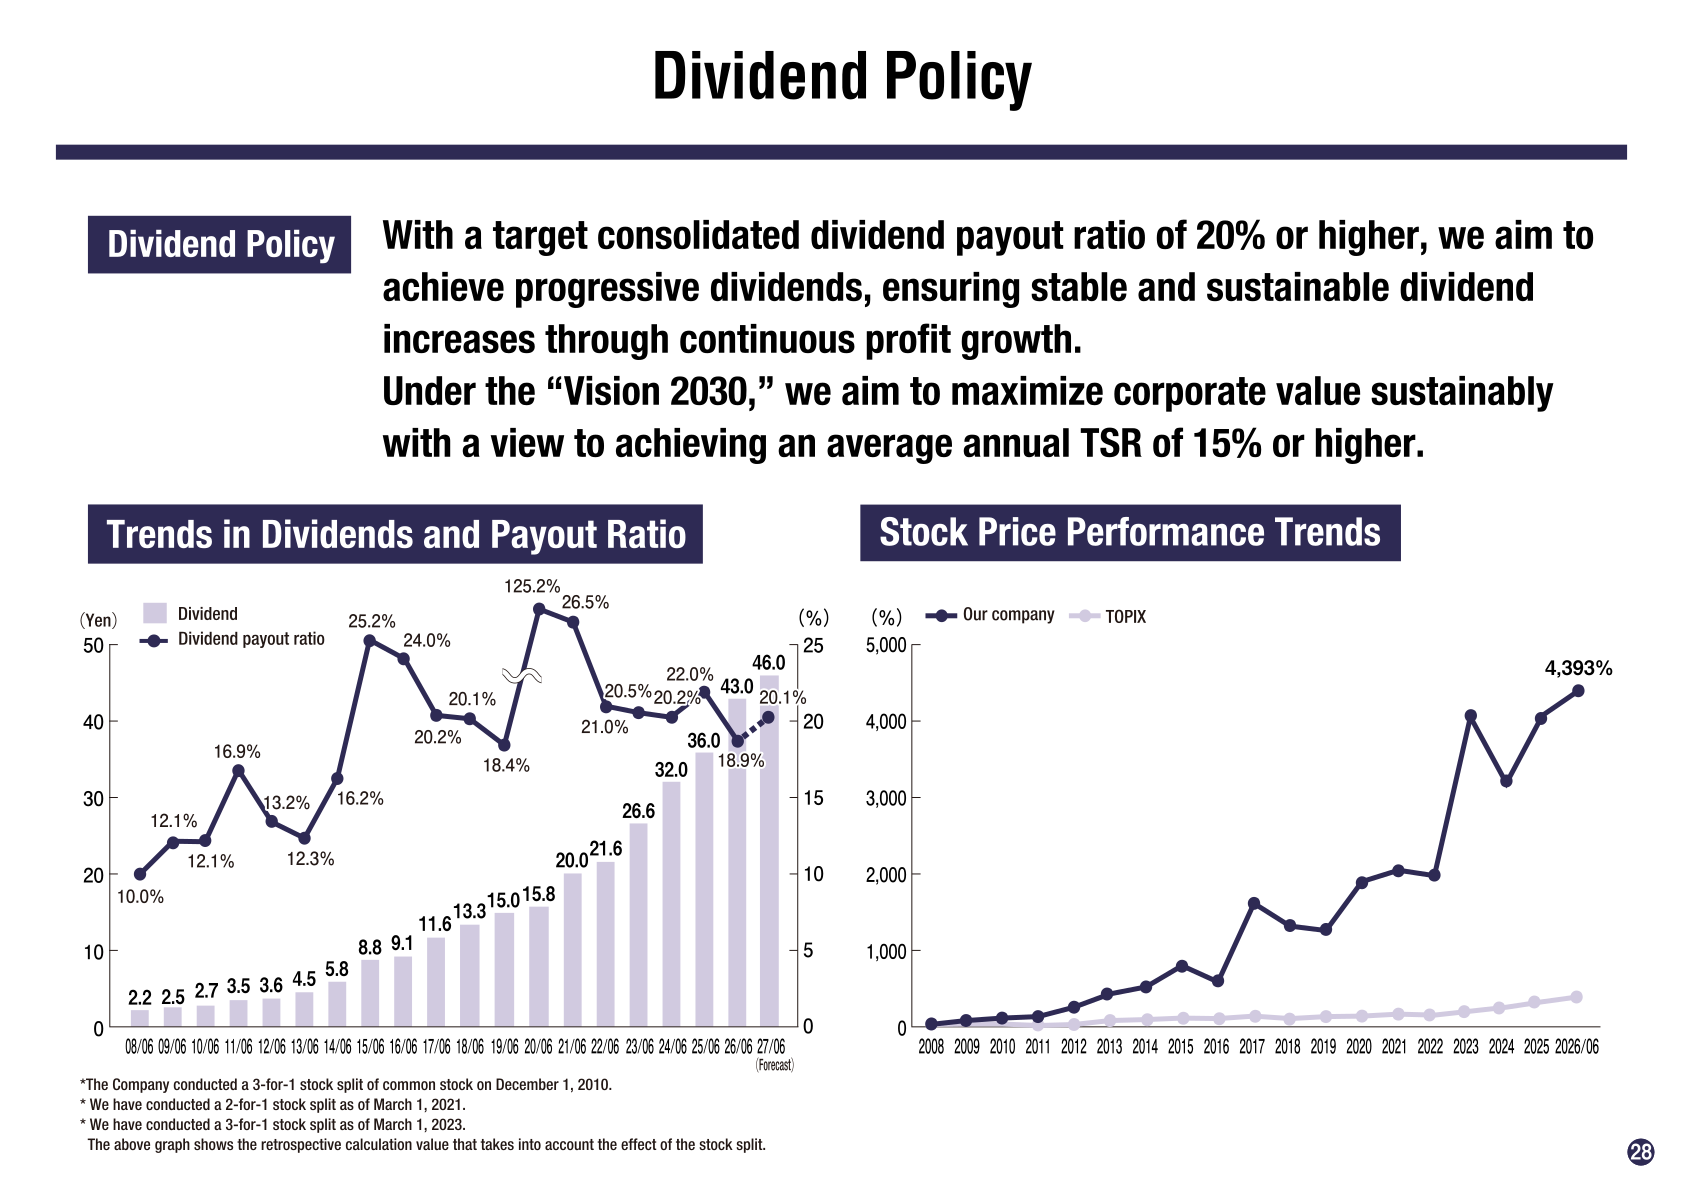
The annual dividend for FY6/26 was 43.00 yen per share, for a consolidated payout ratio of 18.9%. For FY6/27, the company plans an annual dividend of 46.00 yen per share (consolidated payout ratio of 20.1%), marking the 19th consecutive year of dividend increases since its listing. The dividend policy targets a consolidated payout ratio of 20% or higher and progressive (stable and sustainable) dividend increases through continuous profit growth. Under “Vision 2030,” the company also aims for an average annual TSR of 15% or higher.
Medium-Term Plan / Topics
Under its long-term management vision “Vision 2030” and its three-year Medium-term Management Plan covering FY6/26 to FY6/28, the company targets, for the fiscal year ending June 2030, consolidated net sales of 220 billion yen, Group restaurant sales (directly operated plus franchise) of 300 billion yen, an ordinary income margin of 10.0%, ROE and ROIC of 15.0% or higher, and ROA of 7.0% or higher. During FY6/26 the company opened 122 new restaurants (including 95 overseas). As of June 30, 2026 it operated 919 restaurants across nine countries and regions — 808 in Japan (548 directly managed, 260 FC) and 111 overseas (73 directly managed, 38 FC and others).
This article is an analysis based on publicly available information and is not a recommendation to buy or sell any specific securities. Investment decisions are your own responsibility.
















