
This article is based on publicly available IR materials and is not a recommendation to buy or sell any specific securities.
Note: Qol Holdings closes its fiscal year on March 31. On this site the latest completed fiscal year is classified as FY2025; it corresponds to the year ended March 31, 2026, which the company labels “FY3/2026.” Figures, table labels and segment names below follow the company’s presentation.
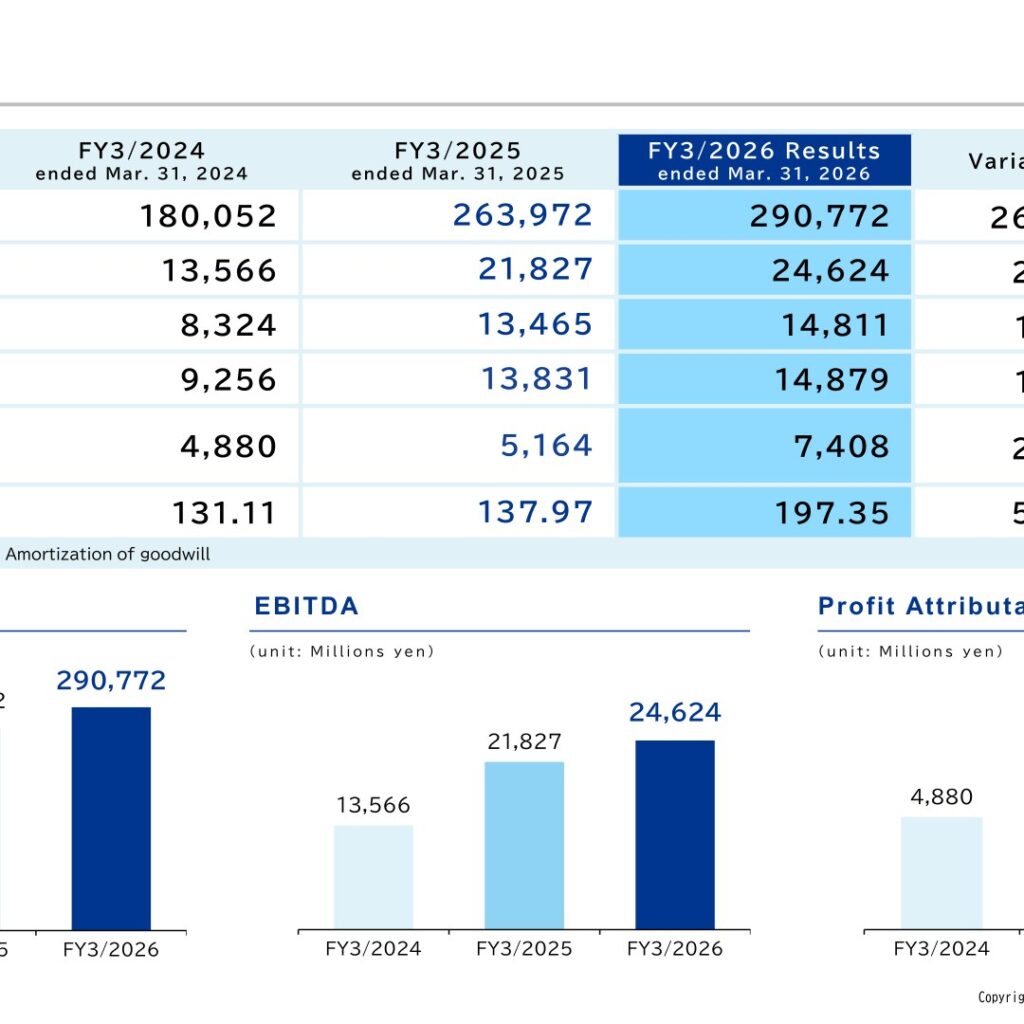
Qol Holdings reported record-high consolidated net sales and profit for the fiscal year ended March 31, 2026 (FY3/2026). Net sales rose 10.2% to ¥290,772 million and operating profit rose 10.0% to ¥14,811 million, while profit attributable to owners of parent jumped 43.5% to ¥7,408 million. Growth was led by the Pharmaceutical Manufacturing Business, boosted by raising the company’s stake in DAIICHI SANKYO ESPHA CO., LTD. to 80% in April 2025. Alongside results, the company announced a new Medium-Term Management Plan targeting ¥500 billion in net sales by 2030.
Consolidated Results (Full-Year Actual)
Net sales, EBITDA, operating profit, ordinary profit and profit attributable to owners of parent all increased year on year, with net sales and profit reaching record highs. EBITDA is defined by the company as operating profit + depreciation + amortization of goodwill. (Unit: millions of yen.)
| Item | FY3/2026 | FY3/2025 | Change (%) |
|---|---|---|---|
| Net sales | 290,772 | 263,972 | 10.2% |
| EBITDA* | 24,624 | 21,827 | 12.8% |
| Operating profit | 14,811 | 13,465 | 10.0% |
| Ordinary profit | 14,879 | 13,831 | 7.6% |
| Profit attributable to owners of parent | 7,408 | 5,164 | 43.5% |
| Net income per share (yen) | 197.35 | 137.97 | 43.0% |
Segment Results
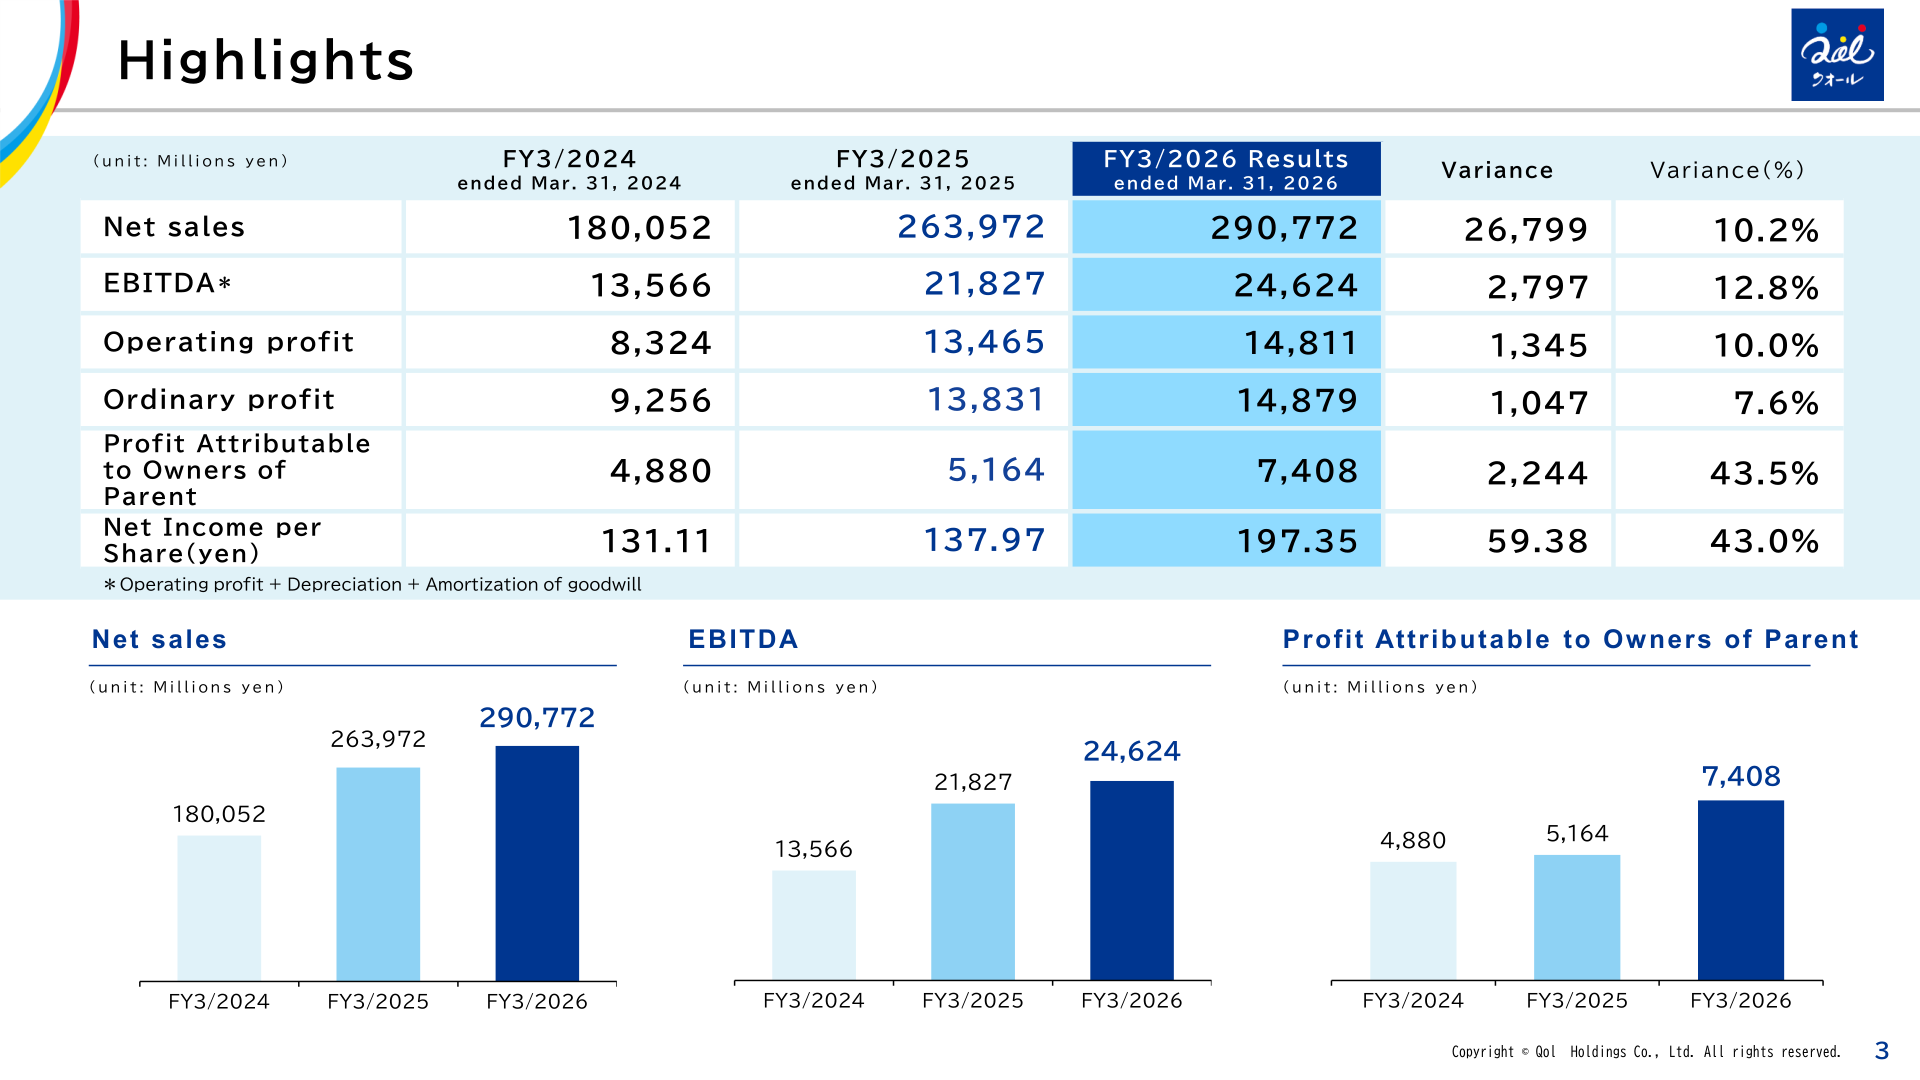
The Pharmacy Business posted higher sales but lower profit. The BPO Contracting Businesses and the Pharmaceutical Manufacturing Business both grew sales and profit; Pharmaceutical Manufacturing led the way with net sales up 25.8% and segment profit up 32.0%, driven by AG (authorized generic) product launches and the increased stake in DAIICHI SANKYO ESPHA. (Unit: millions of yen.)
| Segment | Metric | FY3/2026 | FY3/2025 | YoY |
|---|---|---|---|---|
| Pharmacy Business | Net sales | 177,461 | 171,641 | 3.4% |
| Pharmacy Business | Segment profit | 9,730 | 10,028 | (3.0%) |
| BPO Contracting Businesses | Net sales | 14,300 | 13,603 | 5.1% |
| BPO Contracting Businesses | Segment profit | 1,898 | 1,706 | 11.3% |
| Pharmaceutical Manufacturing Business | Net sales | 99,010 | 78,726 | 25.8% |
| Pharmaceutical Manufacturing Business | Segment profit | 6,960 | 5,272 | 32.0% |
FY3/2027 Forecast
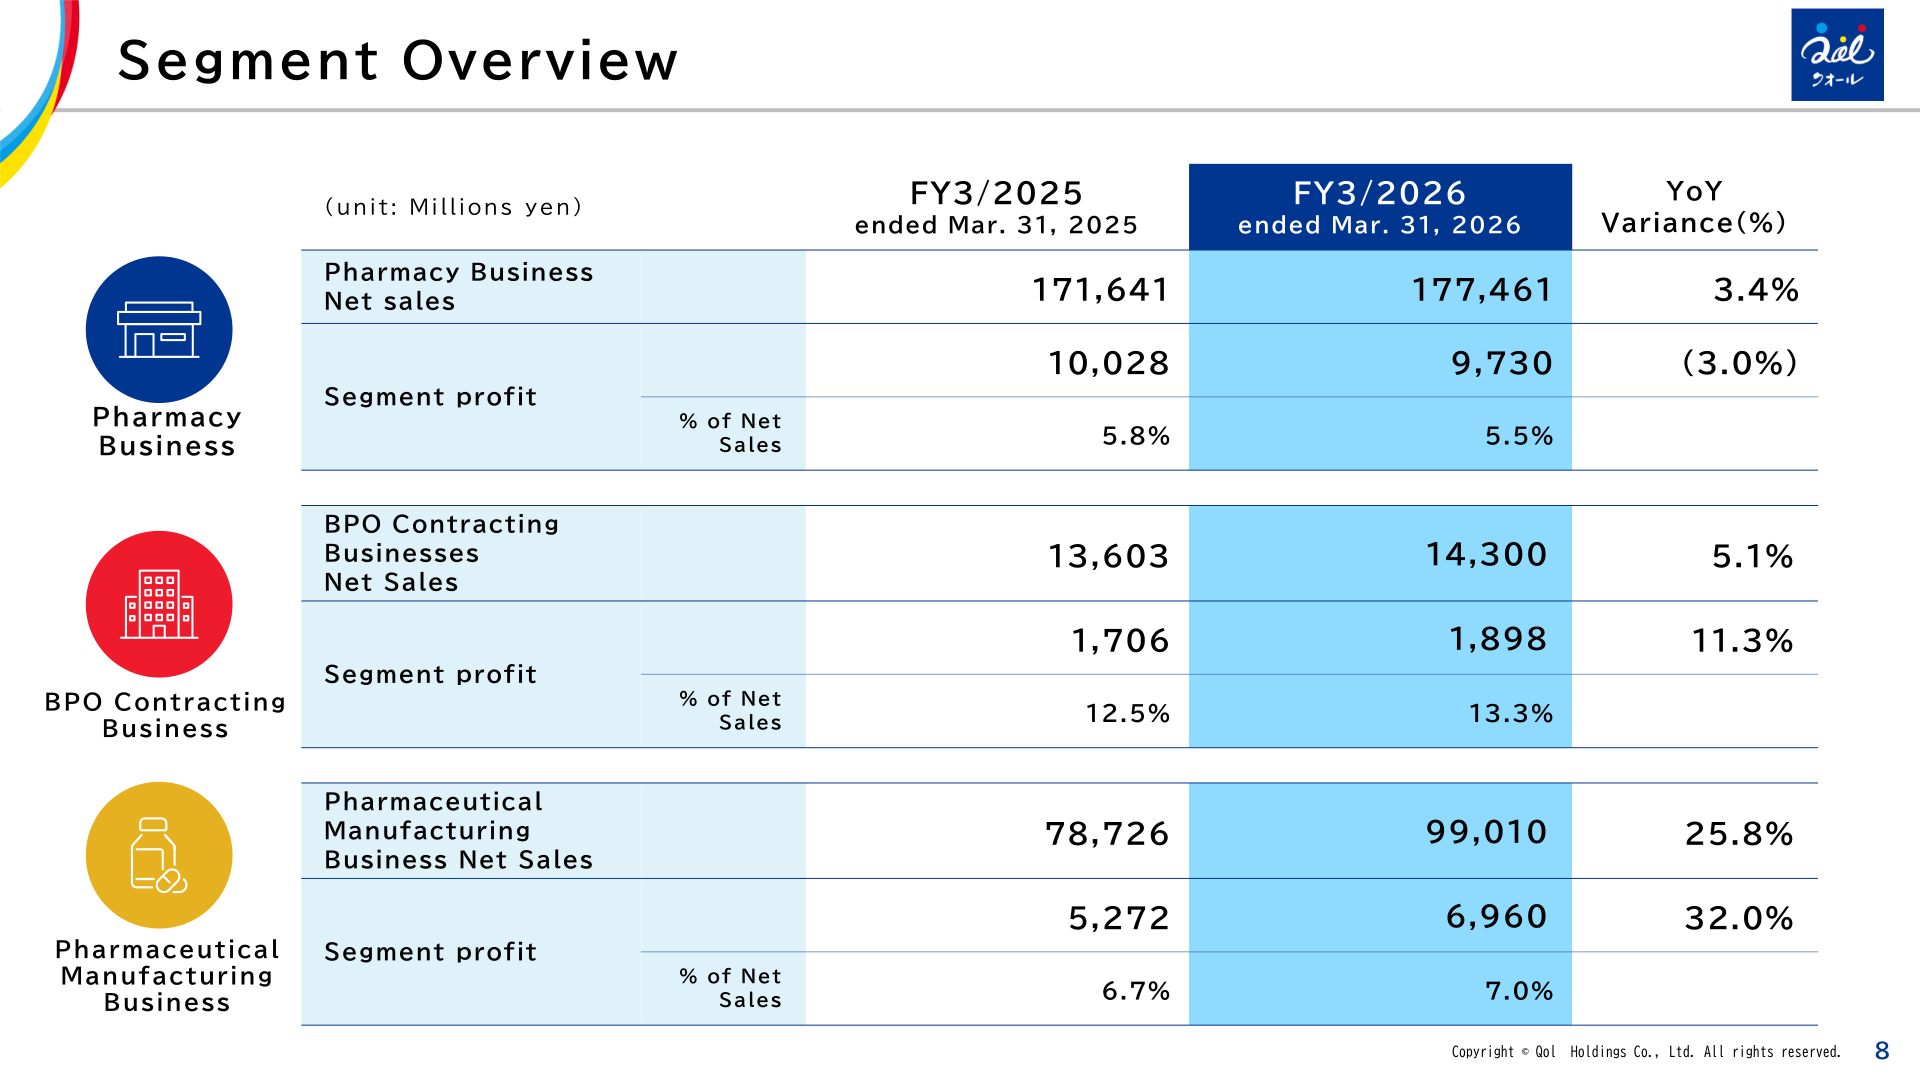
For the fiscal year ending March 31, 2027 (FY3/2027), the company forecasts further growth in sales and all profit lines. (Unit: millions of yen.)
| Item | FY3/2027 (Forecast) | FY3/2026 (Actual) | Change (%) |
|---|---|---|---|
| Net sales | 315,000 | 290,772 | 8.3% |
| Operating profit | 16,500 | 14,811 | 11.4% |
| Ordinary profit | 16,500 | 14,879 | 10.9% |
| Profit attributable to owners of parent | 7,800 | 7,408 | 5.3% |
| EBITDA | 28,700 | 24,624 | 16.6% |
| Net income per share (yen) | 207.76 | 197.35 | — |
By segment, the FY3/2027 forecast calls for growth across all three businesses, with the largest gains in BPO Contracting and Pharmaceutical Manufacturing. (Unit: millions of yen.)
| Segment | Metric | FY3/2027 (Forecast) | YoY |
|---|---|---|---|
| Pharmacy Business | Net sales | 184,861 | 4.2% |
| Pharmacy Business | Segment profit | 10,140 | 4.2% |
| BPO Contracting Businesses | Net sales | 17,470 | 22.2% |
| BPO Contracting Businesses | Segment profit | 2,399 | 26.4% |
| Pharmaceutical Manufacturing Business | Net sales | 112,662 | 13.8% |
| Pharmaceutical Manufacturing Business | Segment profit | 9,012 | 29.5% |
Shareholder Returns
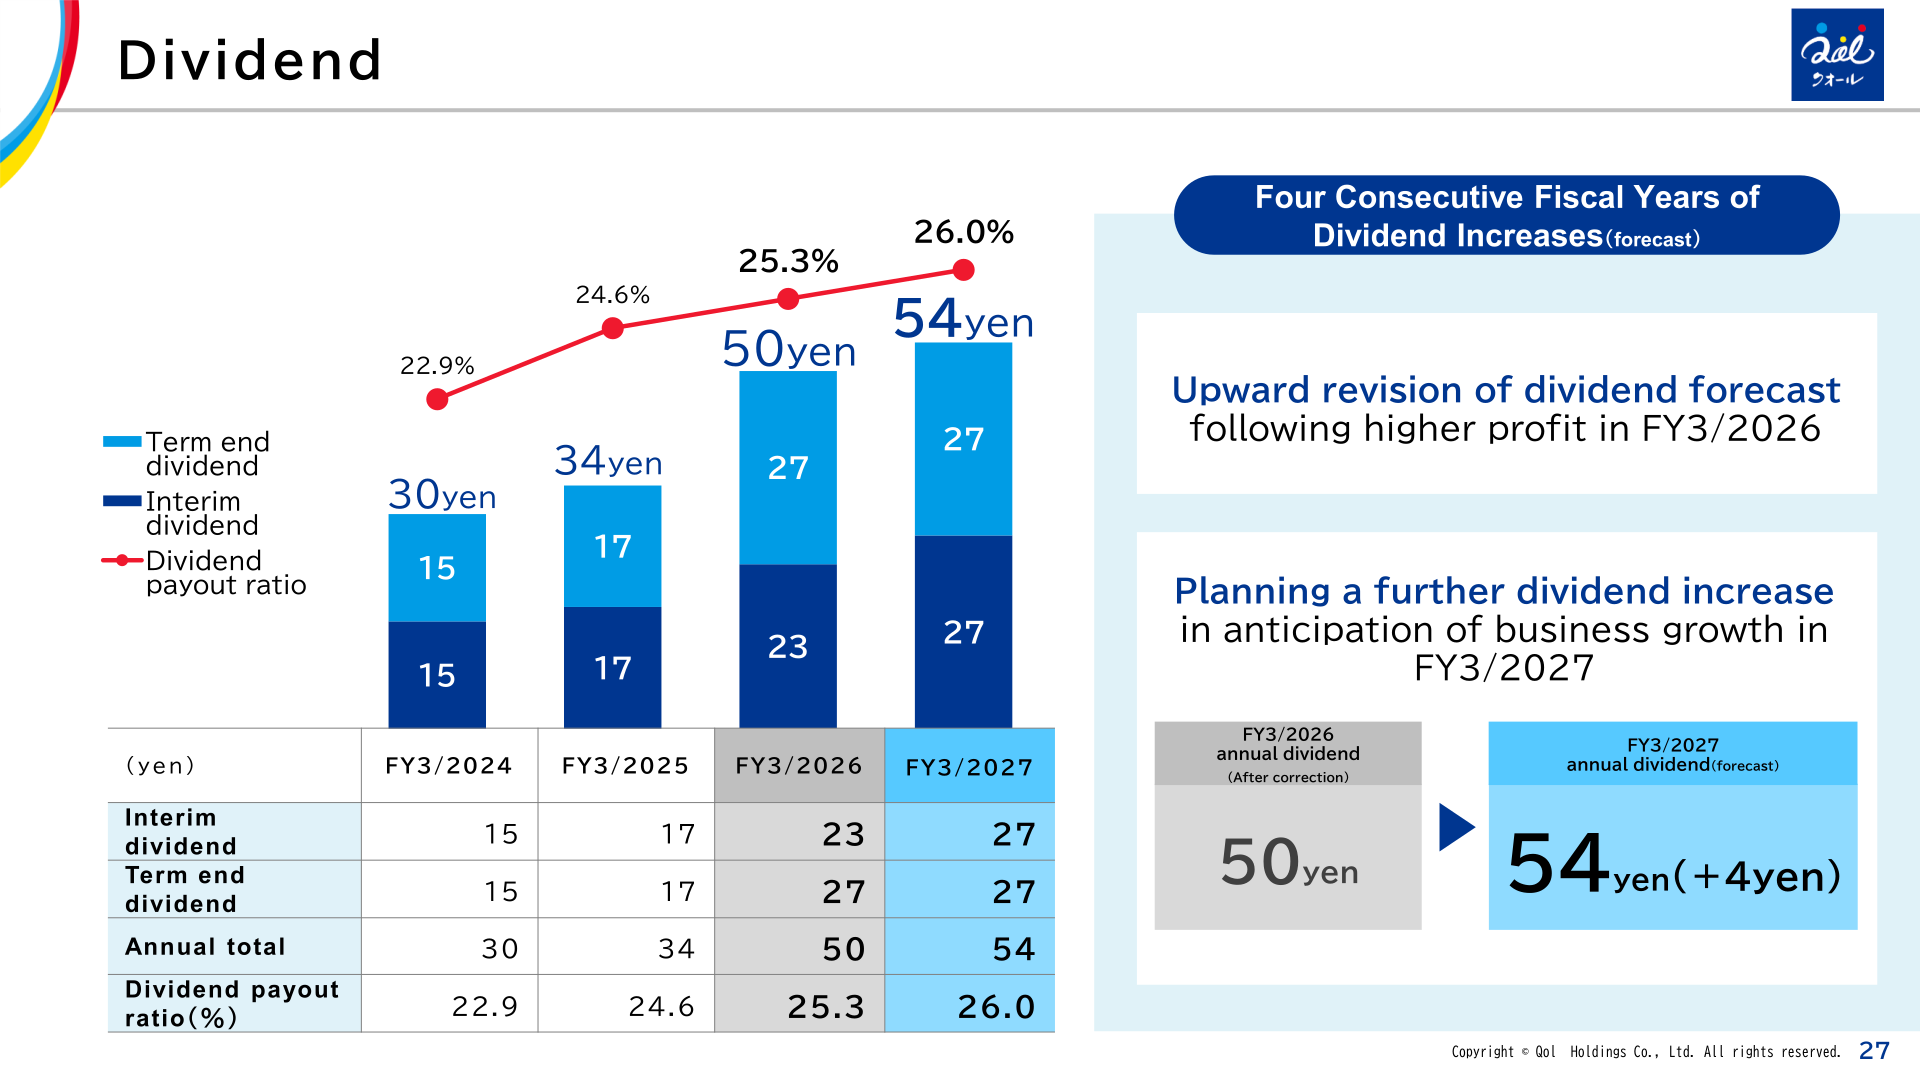
The annual dividend for FY3/2026 was ¥50 per share (interim ¥23 + term-end ¥27), and the company forecasts a ¥54 annual dividend for FY3/2027 (interim ¥27 + term-end ¥27), which would mark a fourth consecutive fiscal year of dividend increases. The dividend payout ratio was 25.3% in FY3/2026 and is forecast at 26.0% for FY3/2027. Under a progressive dividend policy, the company targets a dividend payout ratio of 30% or more by FY2030.
| Item | FY3/2024 | FY3/2025 | FY3/2026 | FY3/2027 (Forecast) |
|---|---|---|---|---|
| Interim dividend (yen) | 15 | 17 | 23 | 27 |
| Term-end dividend (yen) | 15 | 17 | 27 | 27 |
| Annual total (yen) | 30 | 34 | 50 | 54 |
| Dividend payout ratio (%) | 22.9 | 24.6 | 25.3 | 26.0 |
Medium-Term Management Plan (2030 Targets)
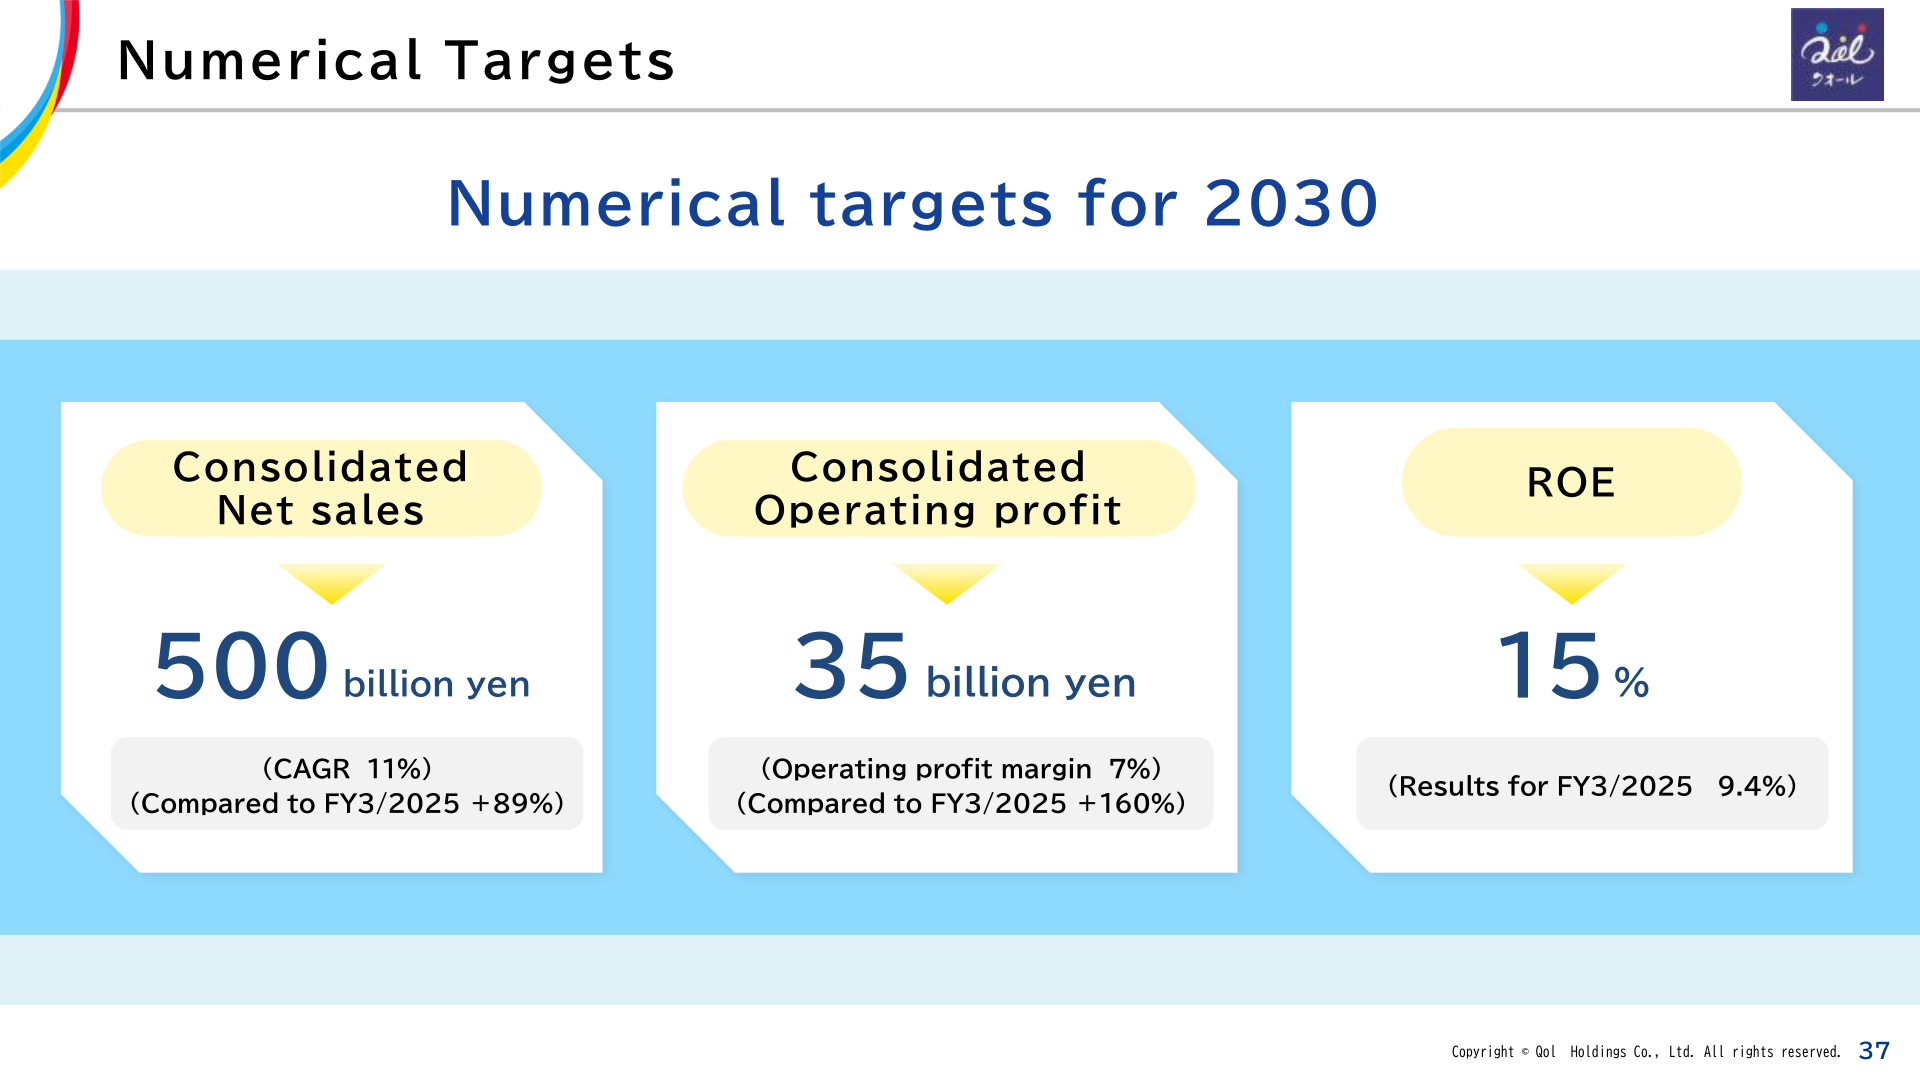
The company set numerical targets for 2030 (the fiscal year ending March 31, 2031). Over the five-year cumulative period FY2026–FY2030, it plans operating cash flow of ¥144 billion, allocating ¥77 billion to existing-business investment, ¥48 billion to growth investment (large-scale M&A, product introduction, etc.) and ¥19 billion to shareholder returns.
| Metric | 2030 Target (FY3/2031) |
|---|---|
| Consolidated net sales | 500 billion yen (CAGR 11%; +89% vs FY3/2025) |
| Consolidated operating profit | 35 billion yen (operating profit margin 7%; +160% vs FY3/2025) |
| ROE | 15% (FY3/2025 result: 9.4%) |
This article is an analysis based on publicly available information and is not a recommendation to buy or sell any specific securities. Investment decisions are your own responsibility.
















