
This article is based on publicly available IR materials and is not a recommendation to buy or sell any specific securities.
Note: JP-HOLDINGS, INC. labels this fiscal year “FY 3/26” (the fiscal year ended March 31, 2026); on this site it is classified as FY2025, and the labels used in the text and tables below follow the company’s materials.
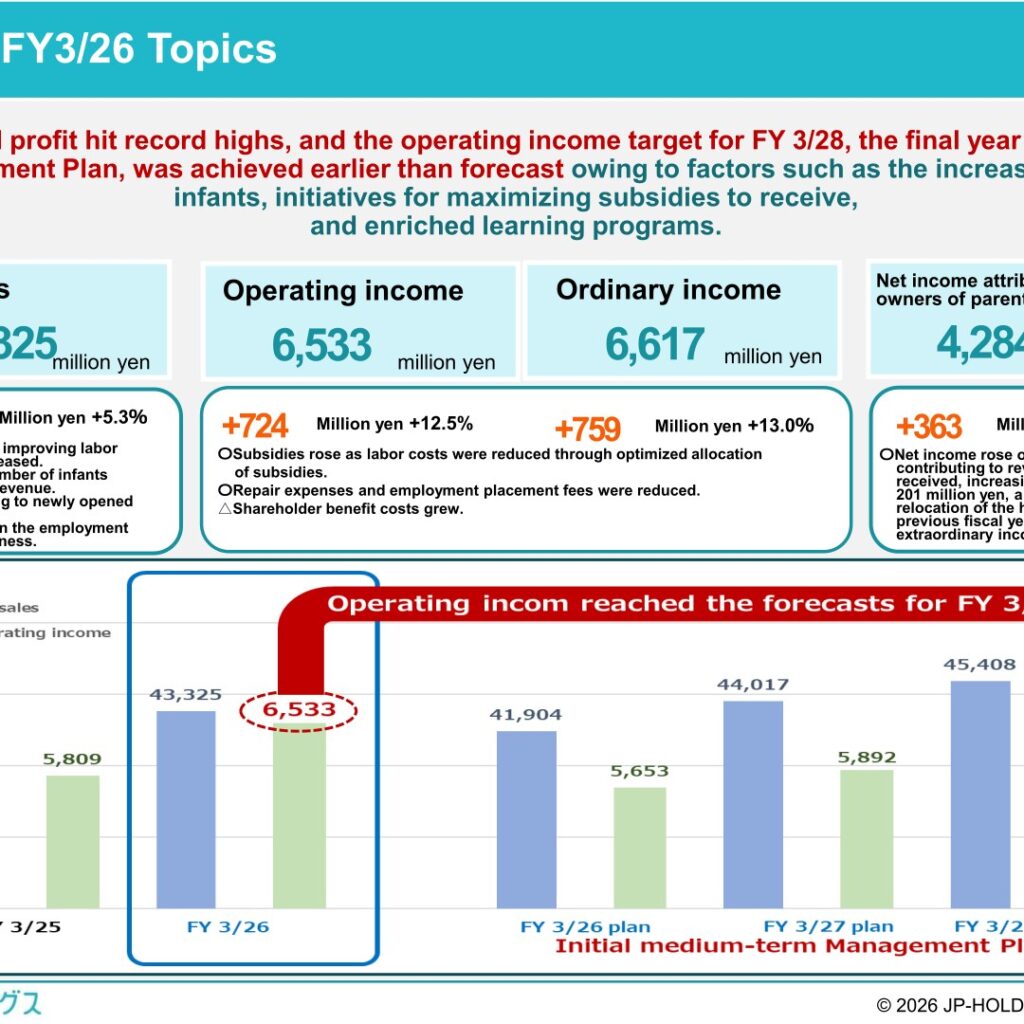
JP-HOLDINGS, INC. (Prime Market, 2749), the operator of the Japan Nursery Service group of nursery schools, school clubs and children’s houses, reported record highs for both sales and profit in FY 3/26. Net sales rose 5.3% year on year to 43,325 million yen and operating income rose 12.5% to 6,533 million yen, lifting the operating income margin to 15.1%. The company states that the operating income target set for FY 3/28, the final year of its Medium-term Management Plan, was achieved earlier than forecast, and it has rolled the plan forward to cover FY 3/27 to FY 3/29.
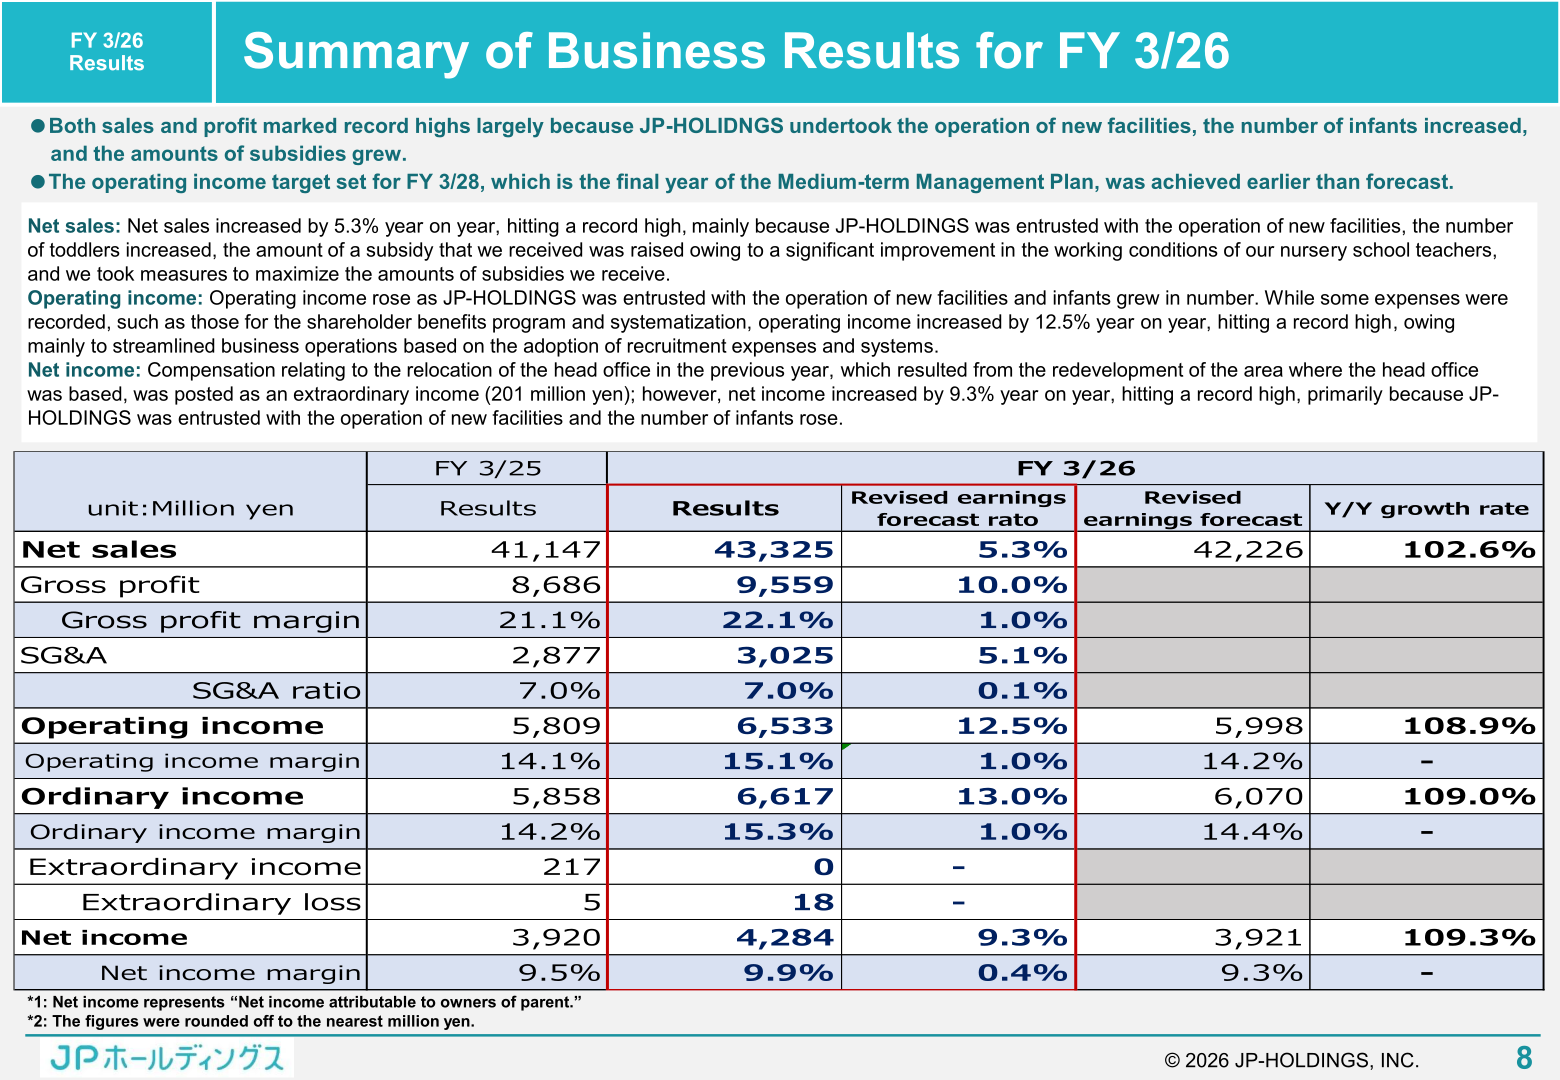
Consolidated Results (Full-Year Actual)
The company attributes the increase in net sales to being entrusted with the operation of new facilities, an increase in the number of infants, a higher subsidy reflecting a significant improvement in the working conditions of its nursery school teachers, and measures taken to maximize the amounts of subsidies received. Operating income increased despite expenses for the shareholder benefits program and systematization adopted at the end of the previous fiscal year. Net income attributable to owners of parent rose 9.3% even though the previous fiscal year included 201 million yen of extraordinary income from compensation relating to the relocation of the head office.
| Item (unit: million yen) | FY 3/25 Results | FY 3/26 Results | Y/Y Change |
|---|---|---|---|
| Net sales | 41,147 | 43,325 | 5.3% |
| Gross profit | 8,686 | 9,559 | 10.0% |
| Gross profit margin | 21.1% | 22.1% | 1.0% |
| SG&A | 2,877 | 3,025 | 5.1% |
| SG&A ratio | 7.0% | 7.0% | 0.1% |
| Operating income | 5,809 | 6,533 | 12.5% |
| Operating income margin | 14.1% | 15.1% | 1.0% |
| Ordinary income | 5,858 | 6,617 | 13.0% |
| Ordinary income margin | 14.2% | 15.3% | 1.0% |
| Extraordinary income | 217 | 0 | – |
| Extraordinary loss | 5 | 18 | – |
| Net income | 3,920 | 4,284 | 9.3% |
| Net income margin | 9.5% | 9.9% | 0.4% |
Results also came in above the company’s own plans. Against the revised earnings forecast for FY 3/26 of 42,226 million yen in net sales, 5,998 million yen in operating income, 6,070 million yen in ordinary income and 3,921 million yen in net income, the actual results reached 102.6%, 108.9%, 109.0% and 109.3% respectively. Compared with the earnings forecasts made at the beginning of the term, the company states that sales rose 3.4%, operating income grew 15.6% and ordinary income increased 16.0%. Note that in the results table on page 8 of the presentation the headings of the two right-hand columns appear transposed relative to the values shown; the year-on-year growth rates above follow the figures confirmed elsewhere in the same material.
Drivers of the Year-on-Year Change
The company breaks down the 2,178 million yen increase in net sales and the 724 million yen increase in operating income as follows (unit: million yen, rounded down to the nearest million yen).
| Net sales factor | Y/Y increase/decrease |
|---|---|
| Undertaking of operation of new facilities | +649 |
| Increase of infants | +227 |
| Increase of facilities managed as a designated administrator, leasing of dormitories, etc. | +158 |
| Improvement of treatment and revision to unit prices | +1,266 |
| Fees and lessons | +35 |
| Merchandizing and others | +2 |
| Transfer of the business of dispatching foreign workers (part of the worker dispatch business) | -159 |
| Total increase in net sales | +2,178 |
| Total increase in cost of sales | +1,306 |
| Total increase in gross profit | +872 |
| Total SGA | +147 |
| Operating income | +724 |
Balance Sheet and Cash Flows
Total assets stood at 38,209 million yen at the end of March 2026, while total liabilities fell to 15,273 million yen on the repayment of long-term loans payable. Net assets rose to 22,935 million yen and the shareholders’ equity ratio improved to 60.0% from 51.9%.
| Item (unit: million yen) | End of Mar. 2025 | End of Mar. 2026 | Change |
|---|---|---|---|
| Total current assets | 26,862 | 27,963 | 1,100 |
| (Cash and deposits) | 20,743 | 22,619 | 1,875 |
| Total fixed assets | 10,760 | 10,245 | △514 |
| Total assets | 37,622 | 38,209 | 586 |
| Total current liabilities | 11,175 | 10,814 | △361 |
| Total fixed liabilities | 6,938 | 4,458 | △2,479 |
| (Long-term loans-payable) | 5,300 | 2,797 | △2,502 |
| Total liabilities | 18,114 | 15,273 | △2,840 |
| Total net assets | 19,508 | 22,935 | 3,427 |
| Shareholders’ equity ratio | 51.9% | 60.0% | – |
| Cash flows from operating activities | 4,205 | 6,268 | 2,062 |
| Cash flows from investing activities | △162 | 49 | 212 |
| Free cash flow | 4,043 | 6,317 | 2,274 |
| Cash flows from financing activities | △4,243 | △4,441 | △197 |
Facilities
As of March 31, 2026 the group operated 345 facilities in total: 203 nursery schools, 6 childcare centers, 118 school clubs, 16 children’s houses and 2 community centers. Openings on April 1, 2025 comprised 25 school clubs and children’s houses, alongside conversions of existing licensed nursery schools into 5 bilingual nursery schools, 2 sports nursery schools and 2 certified childcare centers. Following further openings and conversions on April 1, 2026, the total reached 357 facilities as of the end of April 2026, including 12 school clubs certified by the Tokyo Metropolitan Government and 1 international school.
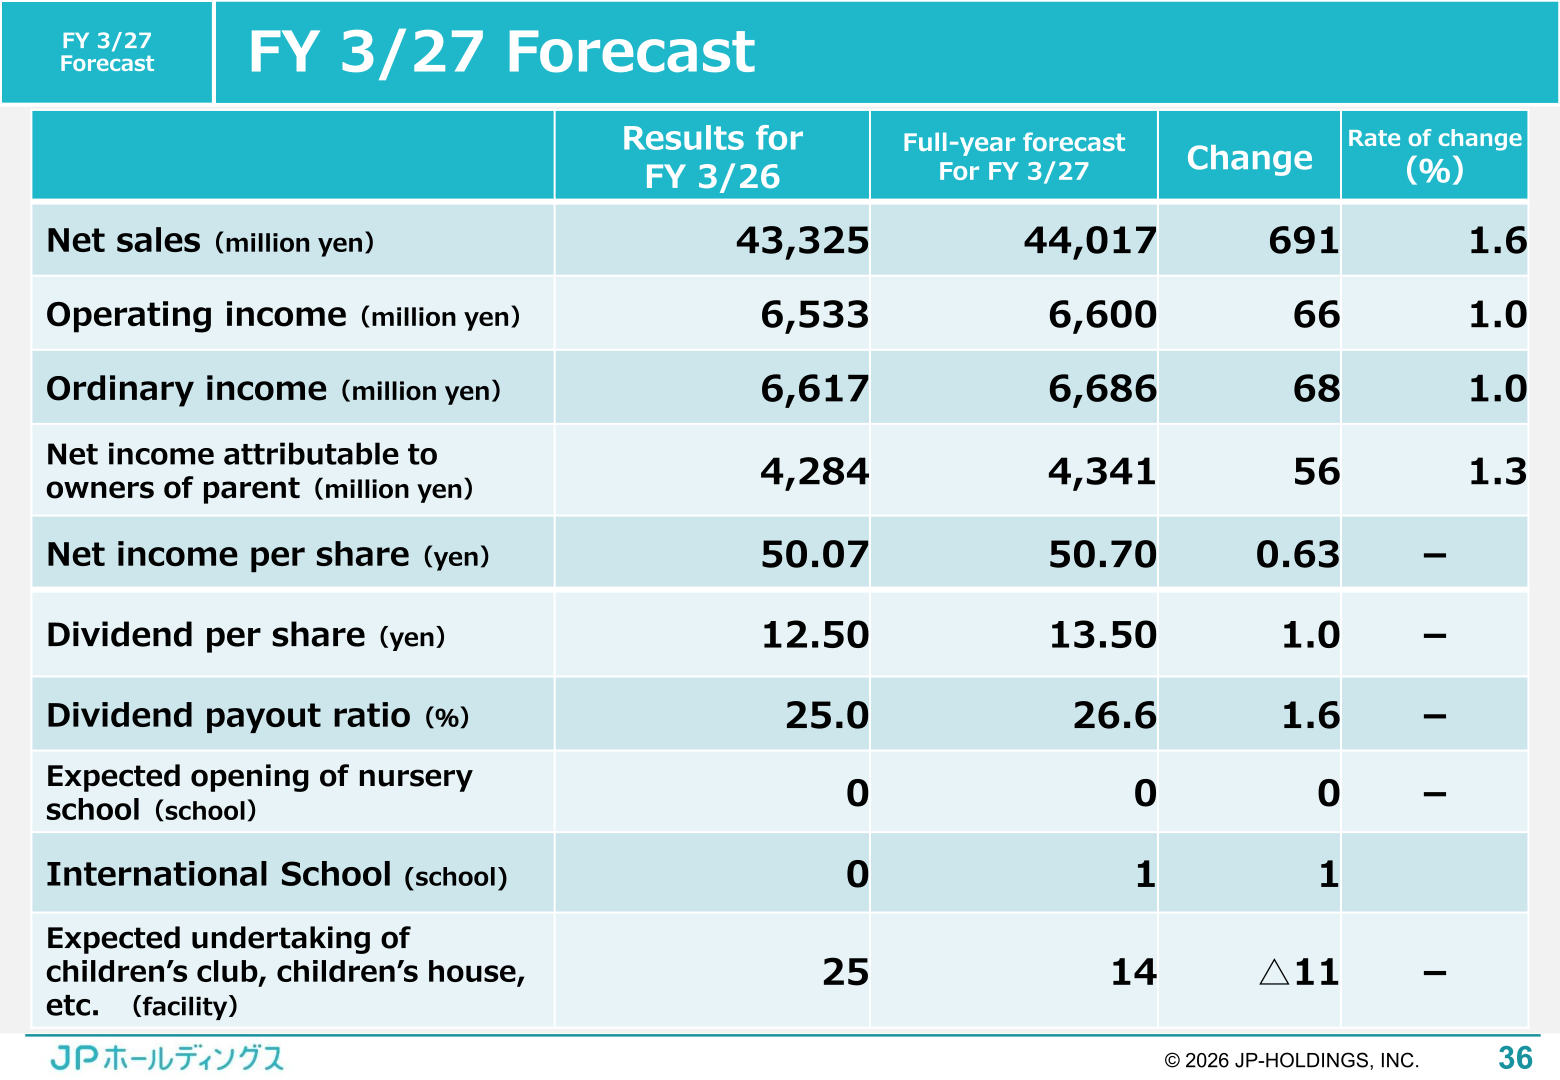
FY 3/27 Forecast
For FY 3/27 the company forecasts modest growth across the income statement. It cites as positive factors an increased number of new school clubs and children’s houses entrusted to it, new education programs, and expected new increases in subsidies; and as negative factors the ongoing decline in the number of births, a decline in subsidies given for helping deal with soaring prices, higher prices of rice and other ingredients, and intensifying regional competition.
| Item | Results for FY 3/26 | Full-year forecast for FY 3/27 | Change | Rate of change (%) |
|---|---|---|---|---|
| Net sales (million yen) | 43,325 | 44,017 | 691 | 1.6 |
| Operating income (million yen) | 6,533 | 6,600 | 66 | 1.0 |
| Ordinary income (million yen) | 6,617 | 6,686 | 68 | 1.0 |
| Net income attributable to owners of parent (million yen) | 4,284 | 4,341 | 56 | 1.3 |
| Net income per share (yen) | 50.07 | 50.70 | 0.63 | - |
| Dividend per share (yen) | 12.50 | 13.50 | 1.0 | - |
| Dividend payout ratio (%) | 25.0 | 26.6 | 1.6 | - |
| Expected opening of nursery school (school) | 0 | 0 | 0 | - |
| International School (school) | 0 | 1 | 1 | |
| Expected undertaking of children’s club, children’s house, etc. (facility) | 25 | 14 | △11 | - |
Shareholder Returns
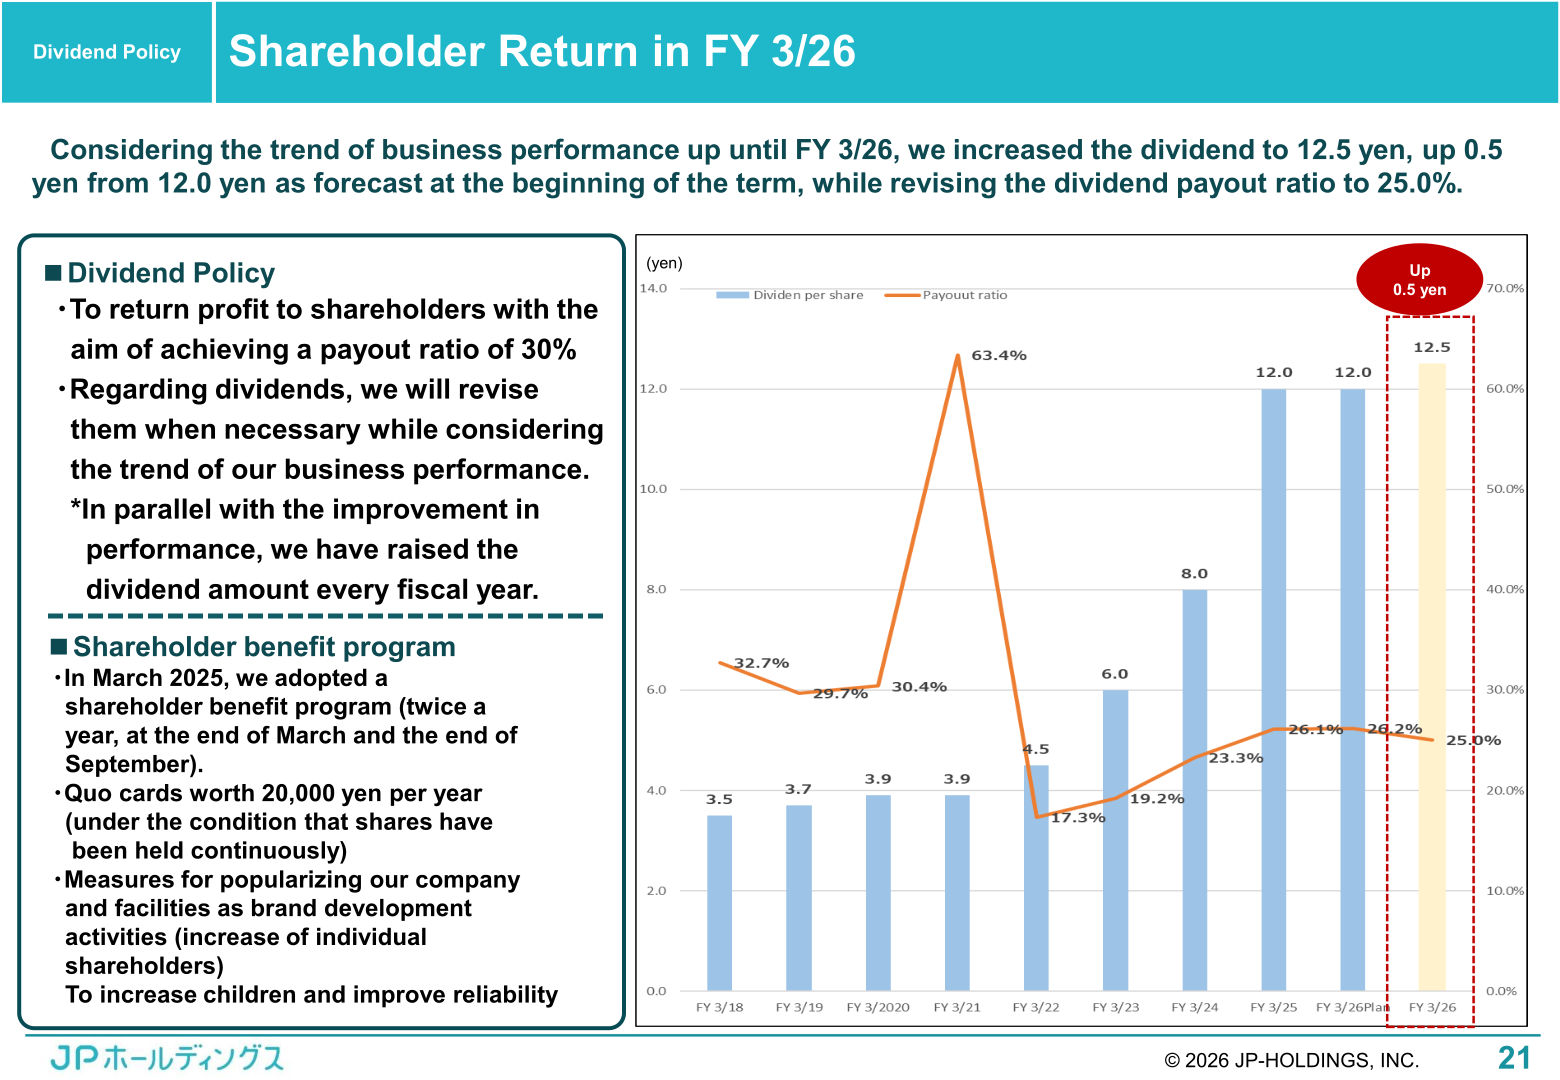
For FY 3/26 the dividend was increased to 12.5 yen per share, up 0.5 yen from the 12.0 yen forecast at the beginning of the term, with the dividend payout ratio revised to 25.0%. The term-end dividend for FY 3/26 is the dividend per share approved at the 34th annual meeting of shareholders. For FY 3/27 the company plans a dividend of 13.5 yen per share, up 1.0 yen year on year, for a payout ratio of 26.6%. Its stated policy is to return profit to shareholders with the aim of achieving a payout ratio of 30%, revising dividends when necessary in light of business performance. A shareholder benefit program adopted in March 2025 provides QUO cards worth 20,000 yen per year, twice a year at the end of March and the end of September, on condition that shares have been held continuously.
Rolling of the Medium-Term Management Plan
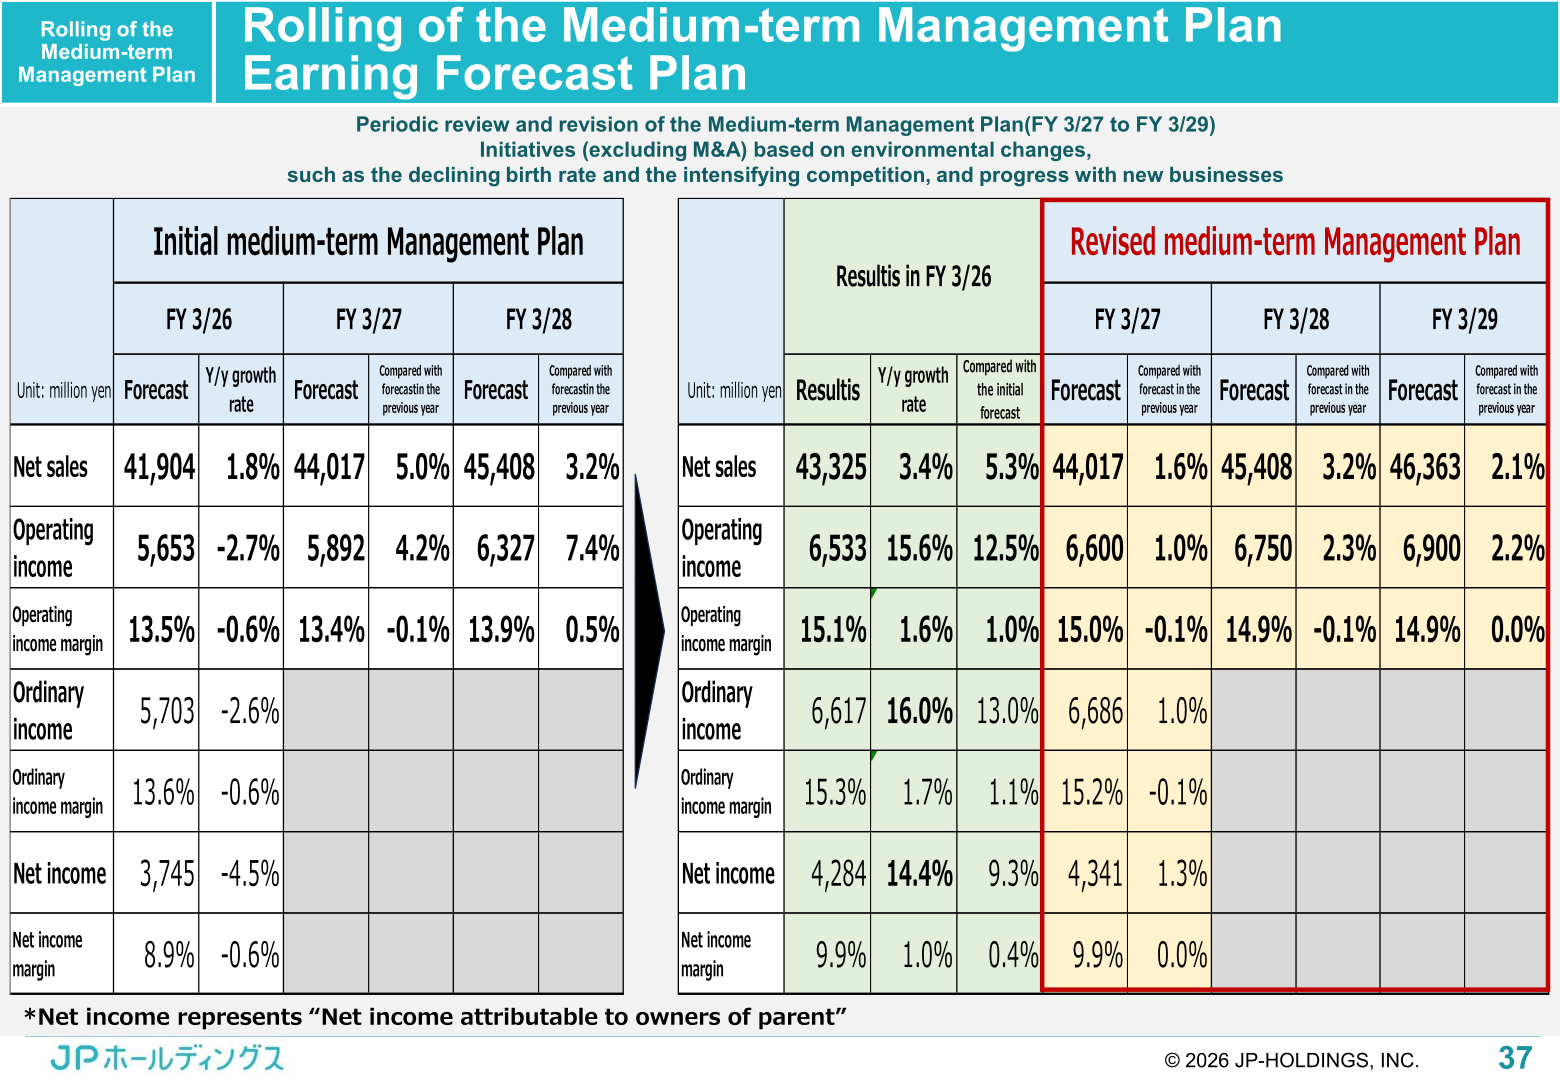
Because the operating income target for FY 3/28 was reached two years ahead of plan, the company has revised the Medium-term Management Plan to cover FY 3/27 to FY 3/29, excluding M&A, in light of the declining birth rate, intensifying competition and progress with new businesses. Under the revised plan, the FY 3/29 consolidated forecast is net sales of 46,363 million yen, up 7% from FY 3/26, operating income of 6,900 million yen and an operating income margin of 14.9%. Quantitative targets include ROE of 18% or higher, PBR of 3 or over and a payout ratio of 30%, with a long-term management vision of consolidated net sales of 100 billion yen. Priority initiatives are the monetization of new businesses and expansion of business scale (overseas expansion, the ALT business and international schools), structural reform to maintain revenue from the childcare business together with more entrusted school clubs and school clubs certified by the Tokyo Metropolitan Government, and more active promotion of M&A.
| Item (unit: million yen) | FY 3/26 Results | FY 3/27 Forecast | FY 3/28 Forecast | FY 3/29 Forecast |
|---|---|---|---|---|
| Net sales | 43,325 | 44,017 | 45,408 | 46,363 |
| Compared with forecast in the previous year | – | 1.6% | 3.2% | 2.1% |
| Operating income | 6,533 | 6,600 | 6,750 | 6,900 |
| Operating income margin | 15.1% | 15.0% | 14.9% | 14.9% |
| Ordinary income | 6,617 | 6,686 | – | – |
| Ordinary income margin | 15.3% | 15.2% | – | – |
| Net income | 4,284 | 4,341 | – | – |
| Net income margin | 9.9% | 9.9% | – | – |
Capital Cost and Capital Efficiency
The company reports ROE of 20.2%, above its cost of shareholders’ equity of 5.09%, giving a positive equity spread. PBR exceeds 1, standing at 2.98 at the end of March 2025 and 2.71 on April 6, 2026. The shareholders’ equity ratio rose to 60.0% at the end of March 2026. The company notes that its PER is low compared with competitors’ and that it will strengthen measures including IR activities, and that under a Du Pont analysis financial leverage is forecast to decline, so it intends to create new businesses as soon as possible in order to improve profit margin further.
This article is an analysis based on publicly available information and is not a recommendation to buy or sell any specific securities. Investment decisions are your own responsibility.
















