
This article is based on publicly available IR materials and is not a recommendation to buy or sell any specific securities.
Note: This article covers the fiscal year ended February 28, 2026, which the company labels “FY2026/02”; our site classifies the most recent completed fiscal year as FY2025. All period labels, units and figures in the text and tables below follow the company’s materials.
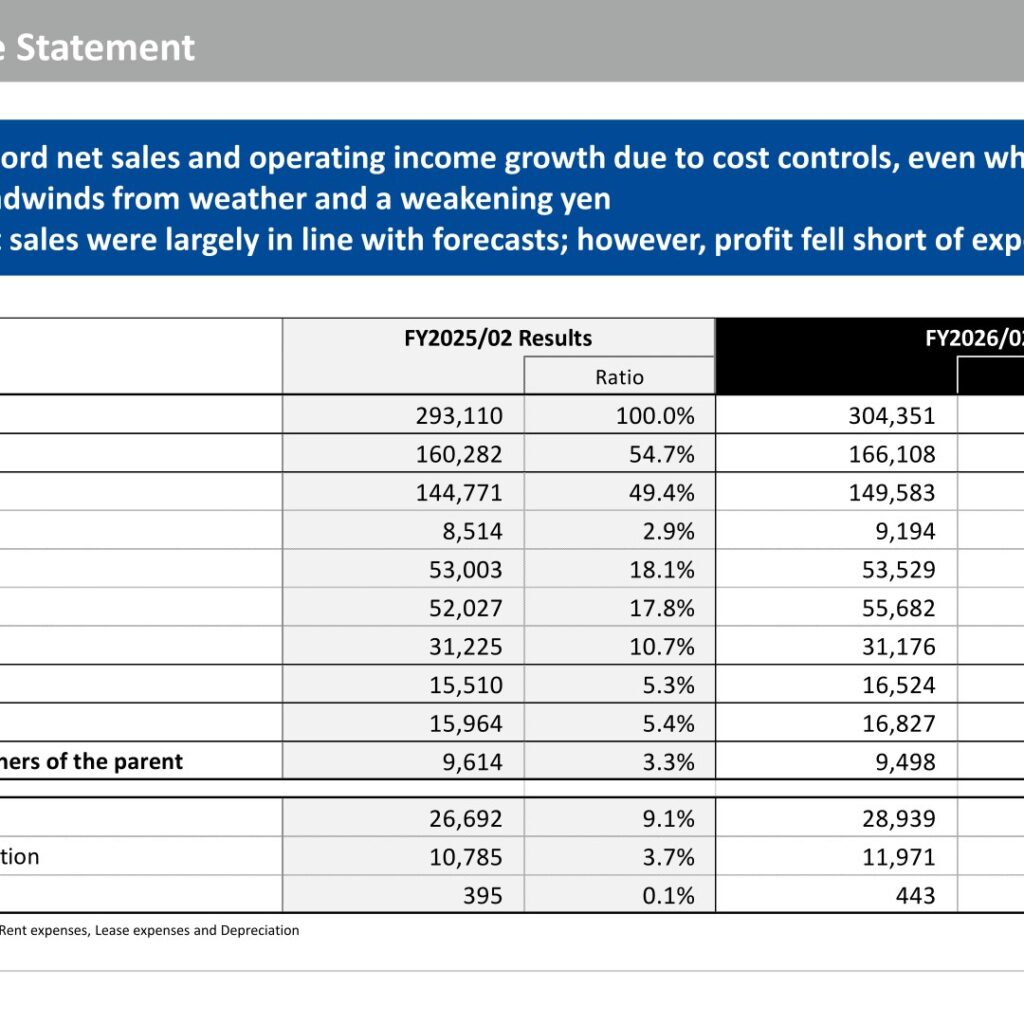
and ST HD Co., Ltd. (2685), the Tokyo-based apparel and lifestyle group formerly named Adastria, reported net sales of 304,351 million yen for FY2026/02, which the company describes as record net sales, alongside operating profit of 16,524 million yen. The company states that record net sales and operating income growth were achieved on cost controls even while facing headwinds from weather and a weakening yen, and that net sales were largely in line with forecasts while profit fell short of expectations. Net income attributable to owners of the parent declined to 9,498 million yen after impairment losses on goodwill, intangible assets and store assets were recorded as extraordinary losses. The results were presented on April 6, 2026 in the “FY2026/02 Financial Results” deck.
Consolidated Results (Full-Year Actual)
The consolidated income statement is shown below in millions of yen. In the company’s materials the “YoY” column is expressed as a ratio to the previous year (100.0% = unchanged), not as a rate of increase. Gross profit margin was 54.6%, down 0.1 percentage point year on year, which the company attributes to inventory clearance discounts and an increase in points granted, offset by improved mark-ups from cost reduction initiatives, higher e-commerce sales through the open platform and downsizing of the wholesale business. The SG&A expense ratio was 49.1%, down 0.3 percentage point, and the operating profit margin was 5.4% with EBITDA margin of 9.5%.
| Item (Millions of yen) | FY2025/02 Results | FY2026/02 Results | YoY |
|---|---|---|---|
| Net sales | 293,110 | 304,351 | 103.8% |
| Gross profit | 160,282 | 166,108 | 103.6% |
| SG&A expenses | 144,771 | 149,583 | 103.3% |
| Advertising & promotion | 8,514 | 9,194 | 108.0% |
| Personnel | 53,003 | 53,529 | 101.0% |
| Rent & depreciation | 52,027 | 55,682 | 107.0% |
| Others | 31,225 | 31,176 | 99.8% |
| Operating profit | 15,510 | 16,524 | 106.5% |
| Ordinary profit | 15,964 | 16,827 | 105.4% |
| Net income attributable to owners of the parent | 9,614 | 9,498 | 98.8% |
| EBITDA | 26,692 | 28,939 | 108.4% |
| Depreciation and amortization | 10,785 | 11,971 | 111.0% |
| Amortization of goodwill | 395 | 443 | 112.0% |
By business, the company breaks net sales of 304.3 billion yen (+3.8% YoY) into Platform Business of 14.0 billion yen, Global Business of 23.8 billion yen and Brand Retail Business of 279.8 billion yen (Platform and Brand Retail are stated before elimination). Non-operating items included foreign exchange profit of 200 million yen and interest expenses of 310 million yen. Extraordinary profit included the sale of the Fukuoka distribution center of 3.4 billion yen, while extraordinary losses included impairment of goodwill and intangible assets of 2.5 billion yen and impairment of store assets of 1.1 billion yen. The company puts total extraordinary losses at 4.7 billion yen for FY2026/02 and 1.7 billion yen for FY2027/02.
Results by Business and Group Company
The company presents net sales and operating profit for the combined New Adastria, and ST and and ST HD entities together with its group companies. It notes that consolidated sales increased but profit decreased for those three companies, that domestic group company sales increased 5% excluding the impact of one company added through M&A and two companies reduced through absorption mergers, and that overseas group company sales increased 17% excluding the impact of the U.S. withdrawal. Food-service subsidiary zetton’s effective sales increase on a 12-month basis was 4.0% and the company swung to a net profit.
| Item (Millions of yen) | FY2025/02 Results | FY2026/02 Results | YoY |
|---|---|---|---|
| Net sales | 293,110 | 304,351 | 103.8% |
| New Adastria + and ST + and ST HD | 231,464 | 242,718 | 104.9% |
| Domestic subsidiaries | 27,603 | 27,326 | 99.0% |
| Overseas subsidiaries | 23,920 | 23,858 | 99.7% |
| zetton (Food & Beverage Subsidiary) | 14,606 | 14,759 | 101.0% |
| Consolidation adjustment | ▲ 4,483 | ▲ 4,311 | 96.1% |
| Operating profit (Excl. HD Impact) | 15,510 | 16,524 | 106.5% |
| New Adastria + and ST + and ST HD | 14,306 | 12,951 | 90.5% |
| Domestic subsidiaries | 1,346 | 2,203 | 163.6% |
| Overseas subsidiaries | 535 | 1,388 | 259.1% |
| zetton (Food & Beverage Subsidiary) | ▲ 411 | 23 | – |
| Consolidation adjustment | ▲ 265 | ▲ 42 | – |
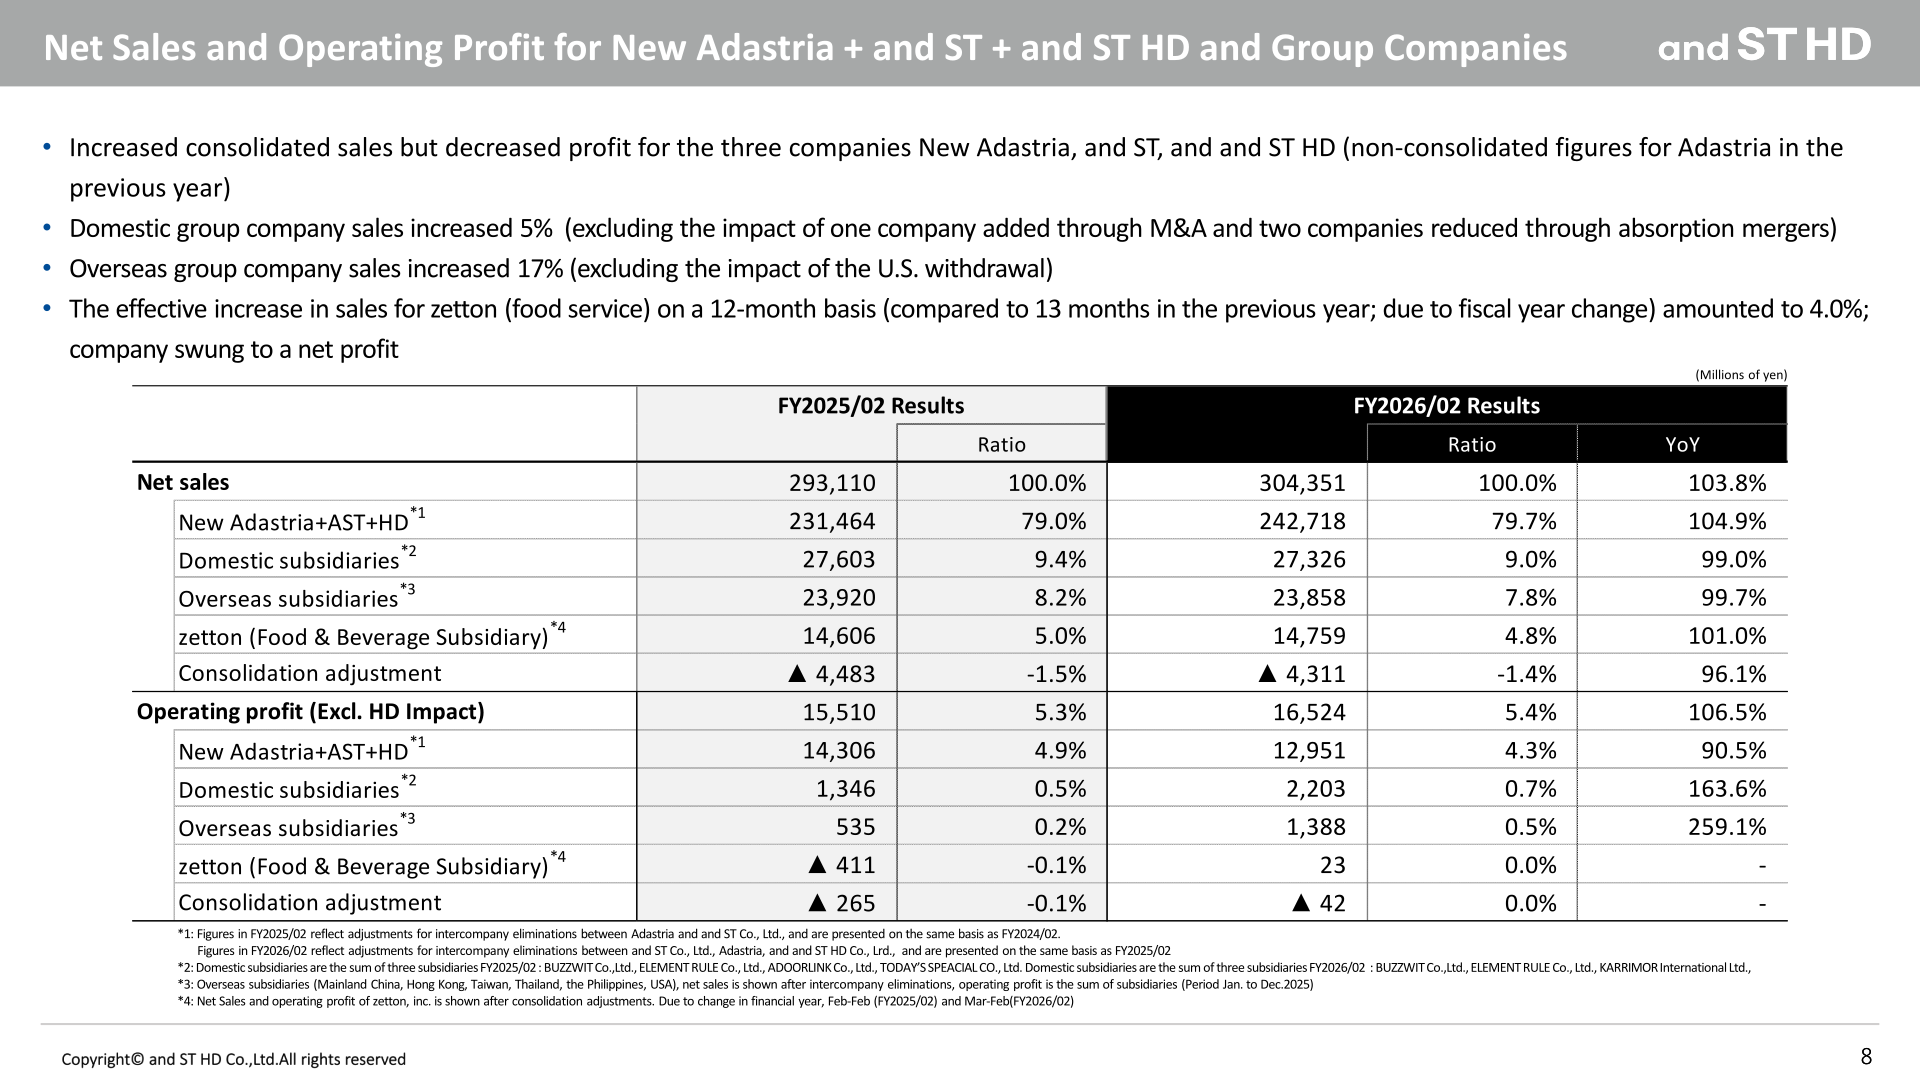
For the New Adastria + and ST + and ST HD grouping, net sales were 242,718 million yen (104.9% YoY), gross profit 128,156 million yen with a gross margin of 52.8% (down 0.2 point), SG&A expenses 115,204 million yen with an SG&A ratio of 47.5% (up 0.7 point), operating profit 12,951 million yen (90.5% YoY) with an operating margin of 5.3% (down 0.9 point), and ordinary profit 14,545 million yen (94.8% YoY). Based on monthly releases, total-store sales excluding wholesale were 105.9% year on year and same-store sales 102.1%.
Global Business
Overseas subsidiaries are consolidated on a January-to-December basis. The company reports that mainland China saw higher sales and a significantly narrowed operating loss on strong e-commerce, Taiwan grew sales and profit with continued new store openings and brand launches, Hong Kong increased sales but saw profit decline on slow summer-item sales and voluntary restraints on promotions in December following a large-scale fire, Thailand grew on three new stores, and the sale of the U.S. business was completed in July, narrowing the operating loss. Net sales are shown after elimination of internal transactions and operating profit before elimination.
| Global Business (Millions of yen) | FY2024/12 Results | FY2025/12 Results | YoY (JPY) |
|---|---|---|---|
| Net sales | 23,920 | 23,858 | 99.7% |
| Mainland China | 4,268 | 5,062 | 118.6% |
| Hong Kong | 4,756 | 4,820 | 101.3% |
| Taiwan | 7,518 | 9,413 | 125.2% |
| Thailand | 355 | 518 | 145.9% |
| The Phillipines | 25 | 143 | 568.3% |
| USA | 6,995 | 3,900 | 55.7% |
| Operating profit | 535 | 1,388 | 259.1% |
| Mainland China | ▲ 486 | ▲ 126 | – |
| Hong Kong | 444 | 210 | 47.3% |
| Taiwan | 1,470 | 1,816 | 123.5% |
| Thailand | ▲ 117 | ▲ 138 | – |
| The Phillipines | ▲ 46 | ▲ 79 | – |
| USA | ▲ 727 | ▲ 292 | – |
Brand Retail Business
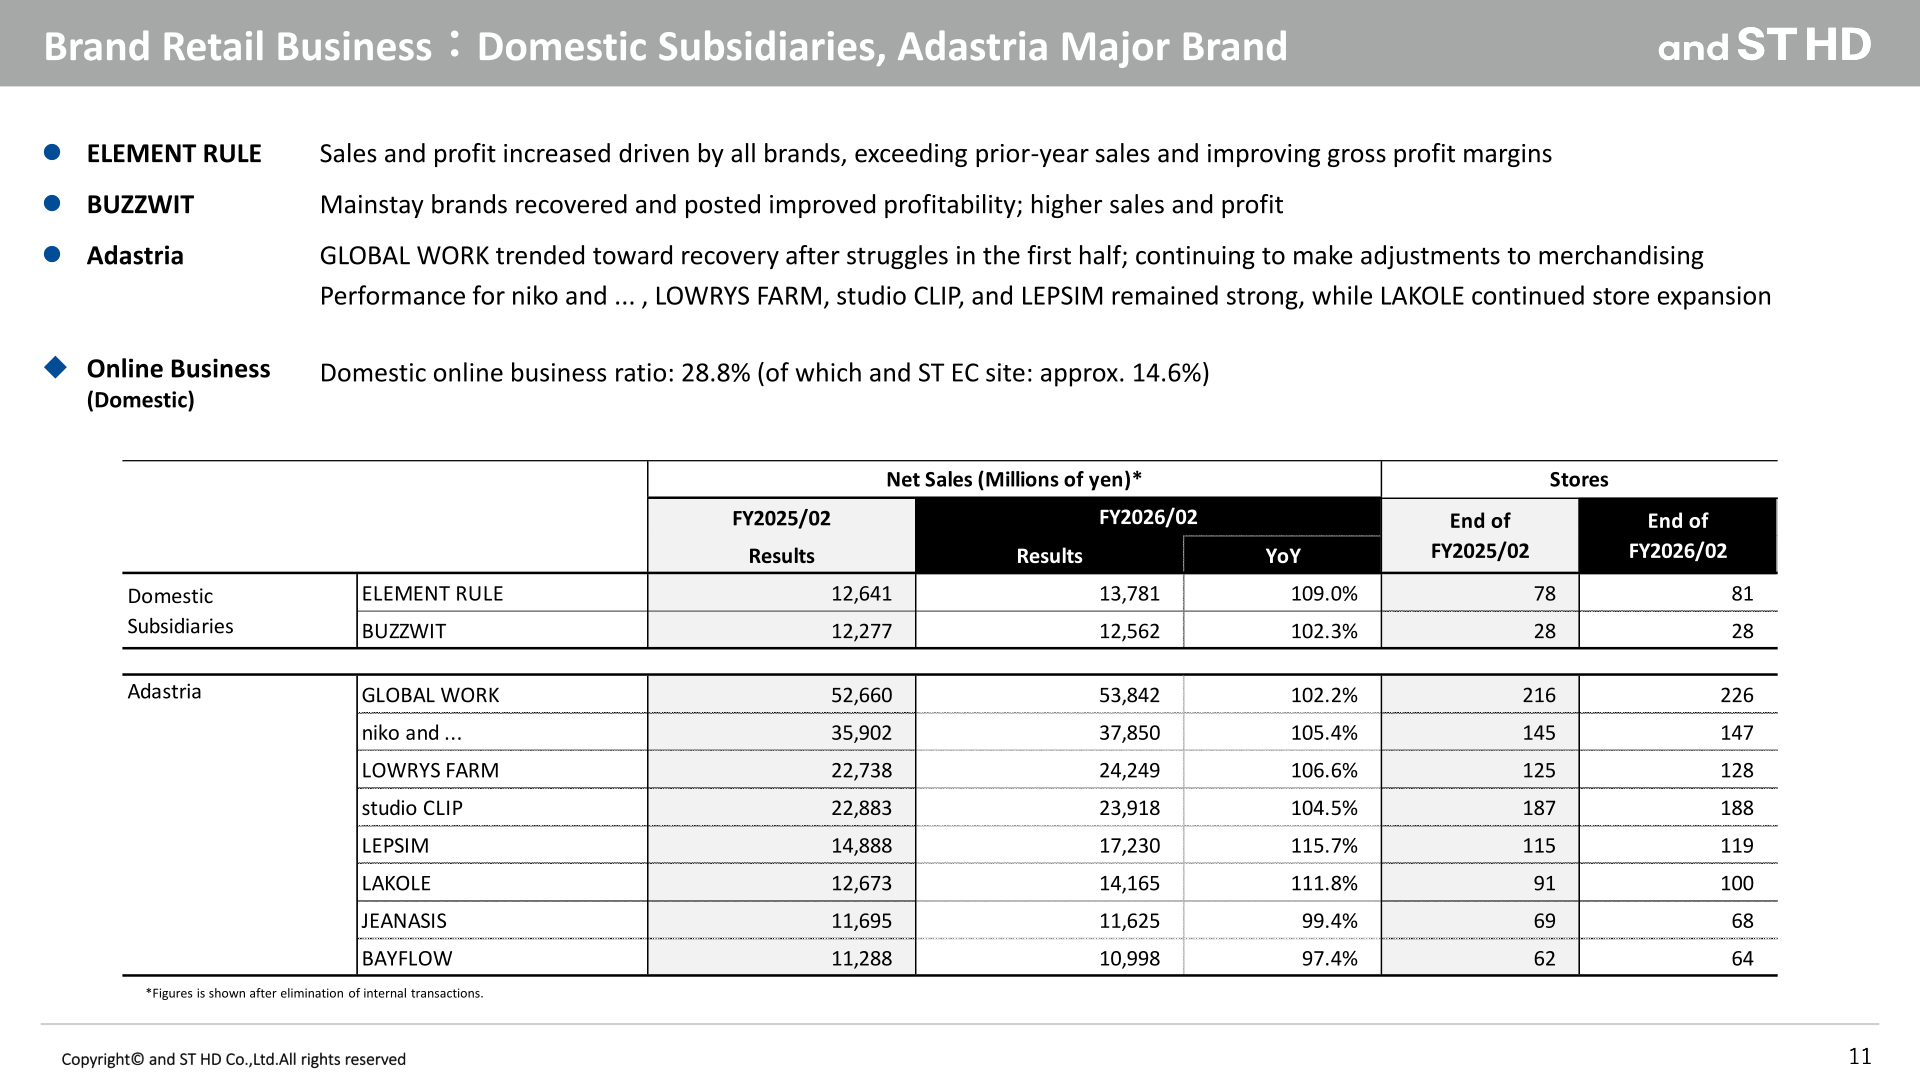
Net sales by major brand and by domestic subsidiary are shown below (after elimination of internal transactions), together with store counts. The company reports that ELEMENT RULE saw sales growth across all five brands, that BUZZWIT posted higher sales and profit as mainstay brands recovered, and that flagship brand GLOBAL WORK trended toward recovery after struggling in the first half while niko and … , LOWRYS FARM, studio CLIP and LEPSIM remained strong and LAKOLE continued store expansion. The domestic online business ratio was 28.8%, of which the and ST e-commerce site accounted for approximately 14.6%.
| Brand / Company (Millions of yen) | FY2025/02 Results | FY2026/02 Results | YoY | Stores end of FY2025/02 | Stores end of FY2026/02 |
|---|---|---|---|---|---|
| ELEMENT RULE | 12,641 | 13,781 | 109.0% | 78 | 81 |
| BUZZWIT | 12,277 | 12,562 | 102.3% | 28 | 28 |
| GLOBAL WORK | 52,660 | 53,842 | 102.2% | 216 | 226 |
| niko and … | 35,902 | 37,850 | 105.4% | 145 | 147 |
| LOWRYS FARM | 22,738 | 24,249 | 106.6% | 125 | 128 |
| studio CLIP | 22,883 | 23,918 | 104.5% | 187 | 188 |
| LEPSIM | 14,888 | 17,230 | 115.7% | 115 | 119 |
| LAKOLE | 12,673 | 14,165 | 111.8% | 91 | 100 |
| JEANASIS | 11,695 | 11,625 | 99.4% | 69 | 68 |
| BAYFLOW | 11,288 | 10,998 | 97.4% | 62 | 64 |
On the consolidated balance sheet, total assets stood at 139,688 million yen at the end of February 2026, up 6,579 million yen (104.9%) from a year earlier. Cash and deposits were 24,912 million yen and inventories 30,526 million yen, up 5.0% year on year, which the company describes as appropriate given spring/summer merchandise in the domestic businesses, M&A and the overseas business. Property, plant and equipment decreased to 24,727 million yen following the sale of the Fukuoka Distribution Center, goodwill fell to 566 million yen on impairment, and net assets were 81,823 million yen for a net asset ratio of 58.6%, up 0.6 point. Consolidated store count was 1,674 stores (including 140 online stores) at the end of FY2026/02, against 1,630 (141) a year earlier, with a plan of 1,752 (143) at the end of FY2027/02.
FY2027/02 Forecast (Year Ending February 28, 2027)
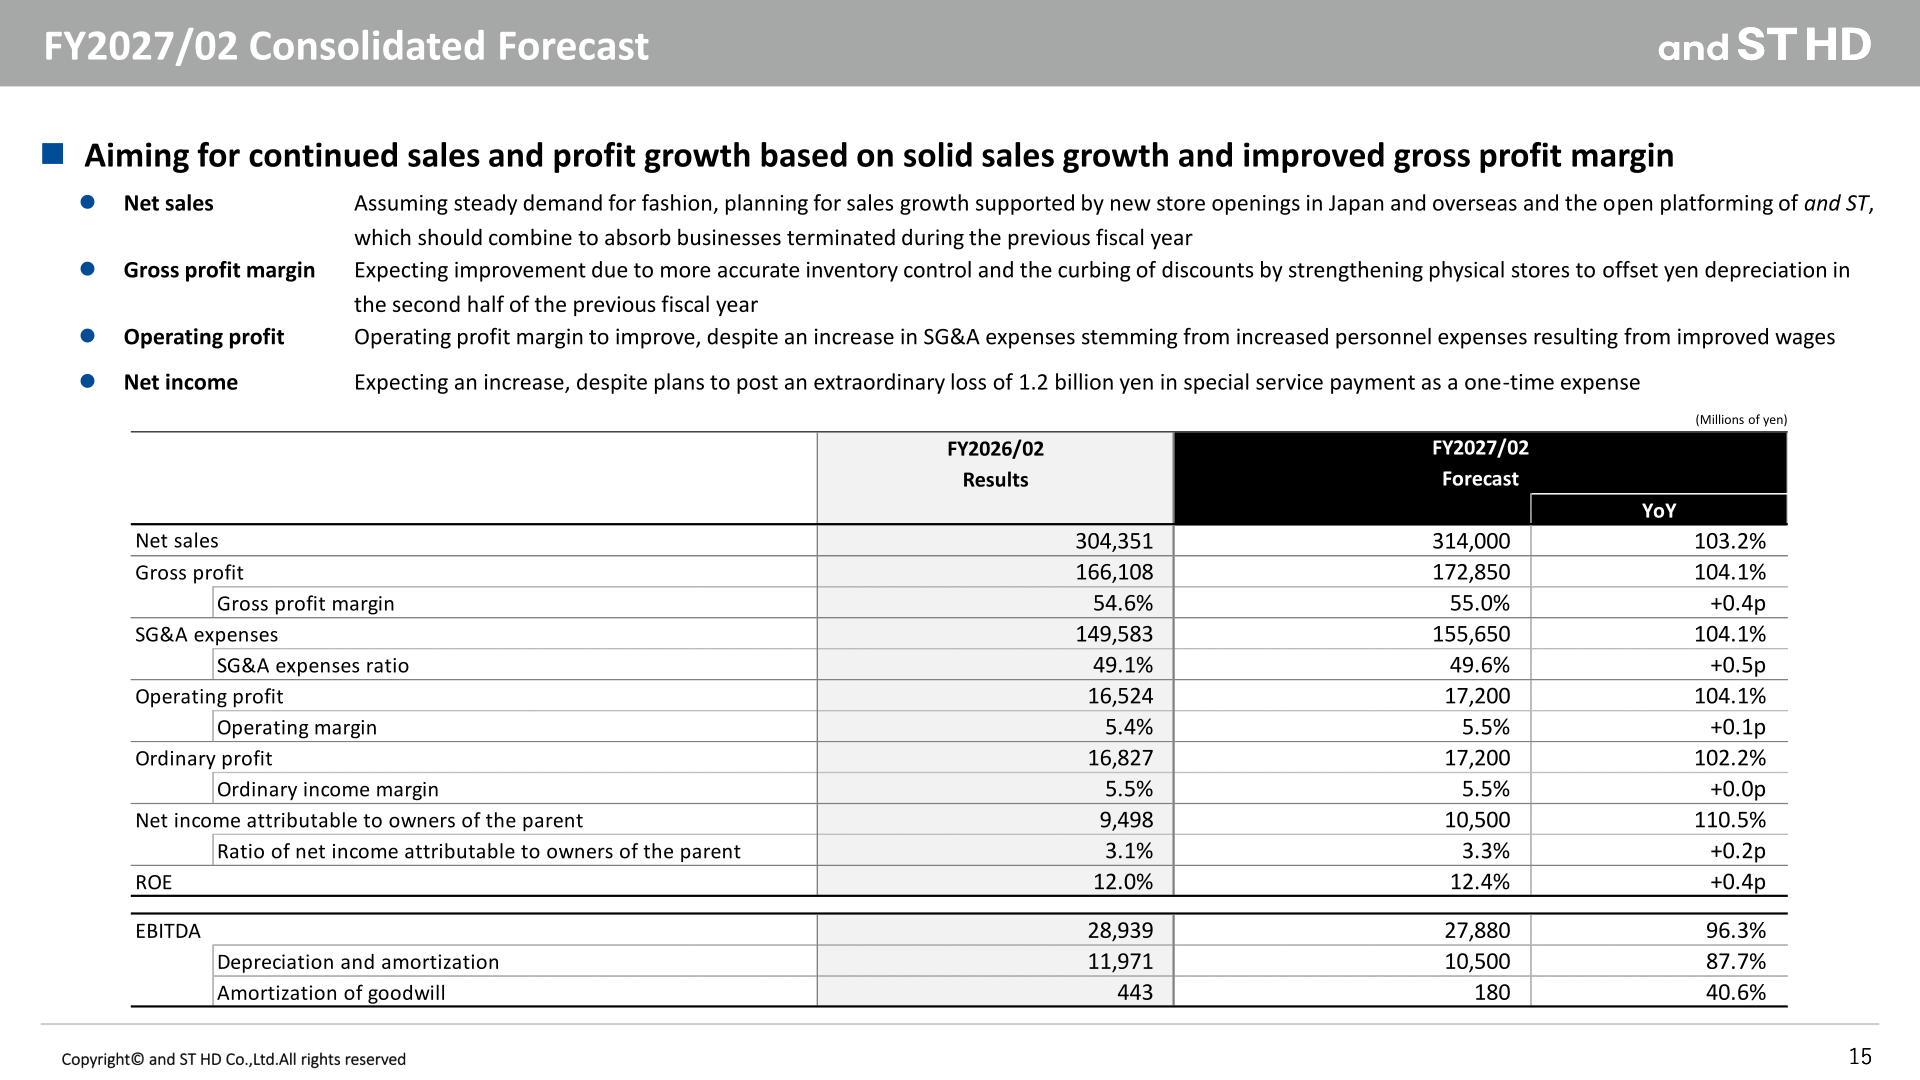
The company is targeting continued sales and profit growth based on solid sales growth and an improved gross profit margin. It expects net sales growth supported by new store openings in Japan and overseas and the open platforming of and ST, offsetting businesses terminated during the previous fiscal year; an improved gross profit margin from more accurate inventory control and curbed discounting; an improved operating margin despite higher SG&A expenses from wage increases; and higher net income despite a planned extraordinary loss of 1.2 billion yen for a special service payment. Capital investment is planned at 14.2 billion yen for FY2027/02, against 15.7 billion yen actually invested in FY2026/02 versus a plan of 14.6 billion yen.
| Item (Millions of yen) | FY2026/02 Results | FY2027/02 Forecast | YoY |
|---|---|---|---|
| Net sales | 304,351 | 314,000 | 103.2% |
| Gross profit | 166,108 | 172,850 | 104.1% |
| Gross profit margin | 54.6% | 55.0% | +0.4p |
| SG&A expenses | 149,583 | 155,650 | 104.1% |
| SG&A expenses ratio | 49.1% | 49.6% | +0.5p |
| Operating profit | 16,524 | 17,200 | 104.1% |
| Operating margin | 5.4% | 5.5% | +0.1p |
| Ordinary profit | 16,827 | 17,200 | 102.2% |
| Net income attributable to owners of the parent | 9,498 | 10,500 | 110.5% |
| ROE | 12.0% | 12.4% | +0.4p |
| EBITDA | 28,939 | 27,880 | 96.3% |
| Depreciation and amortization | 11,971 | 10,500 | 87.7% |
| Amortization of goodwill | 443 | 180 | 40.6% |
Shareholder Returns
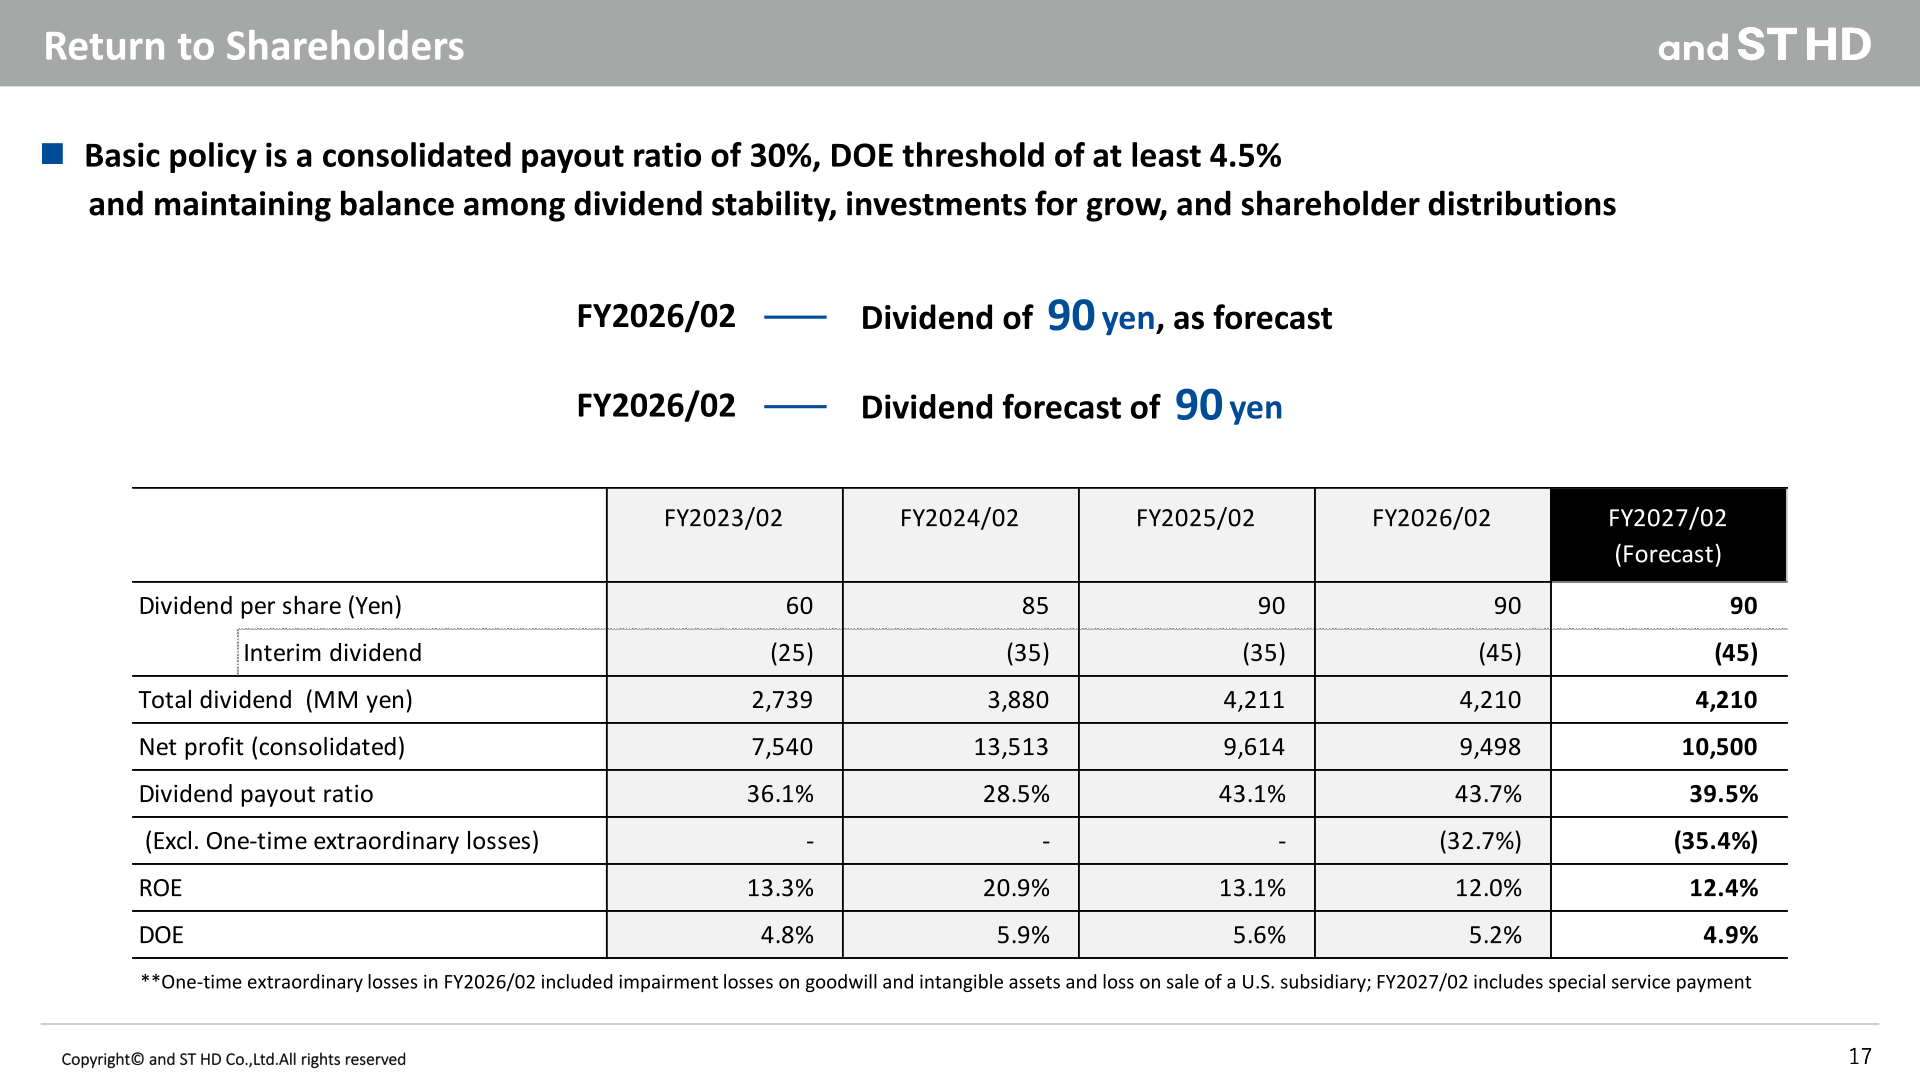
The basic policy is a consolidated payout ratio of 30% and a DOE threshold of at least 4.5%, while maintaining a balance among dividend stability, investments for growth and shareholder distributions. The FY2026/02 dividend was 90 yen per share, in line with the forecast, and the table in the materials shows a dividend forecast of 90 yen per share for FY2027/02, with an interim dividend of 45 yen.
| Item | FY2023/02 | FY2024/02 | FY2025/02 | FY2026/02 | FY2027/02 (Forecast) |
|---|---|---|---|---|---|
| Dividend per share (Yen) | 60 | 85 | 90 | 90 | 90 |
| Interim dividend | (25) | (35) | (35) | (45) | (45) |
| Total dividend (MM yen) | 2,739 | 3,880 | 4,211 | 4,210 | 4,210 |
| Net profit (consolidated) | 7,540 | 13,513 | 9,614 | 9,498 | 10,500 |
| Dividend payout ratio | 36.1% | 28.5% | 43.1% | 43.7% | 39.5% |
| (Excl. One-time extraordinary losses) | – | – | – | (32.7%) | (35.4%) |
| ROE | 13.3% | 20.9% | 13.1% | 12.0% | 12.4% |
| DOE | 4.8% | 5.9% | 5.6% | 5.2% | 4.9% |
Corporate Structure and Medium-Term Management Plan 2030
On September 1, 2025 the company changed its name to and ST HD Co., Ltd., completing the transition to a holding company structure, and on March 1, 2026 it named a new president and CEO. Under Medium-Term Management Plan 2030 the group targets consolidated net sales of 400 billion yen, GMV of 100 billion yen and a consolidated operating profit margin of 8% for FY2030/02. In FY2026/02 the company assesses that sales fell slightly short of plan and profit underperformed plan significantly; the Global Business outperformed plan in East Asia but lagged in opening stores in Southeast Asia, while the Platform Business secured higher results toward all KPIs.
In the Platform Business, and ST GMV reached 46.2 billion yen (+14.8% YoY), comprising Group Brand Sales of 41.7 billion yen (+6.6% YoY, a 90.3% share) and External Brand Sales of 4.5 billion yen (+301.6% YoY, a 9.7% share), with the company targeting 50 billion yen for the current period. As of February 28, 2026 and ST had 21.7 million members, up 2.0 million from the end of FY2025/02, and 7.8 million active members, up 0.3 million, while the number of external shops reached 53, up 26 year on year. The flagship store and ST TOKYO, opened in April 2025, achieved its initial customer traffic goal of 1 million visits per year.
On capital policy, the company notes that its share price remained weak throughout the first year of the medium-term management plan with a P/E ratio of around 11x, and states that it will continue to base shareholder returns on a DOE of 4.5% and a stable payout ratio of at least 30%, aiming to increase dividends through higher earnings, while improving profitability and capital efficiency to achieve an ROE target of 15%.
This article is an analysis based on publicly available information and is not a recommendation to buy or sell any specific securities. Investment decisions are your own responsibility.
















