
This article is based on publicly available IR materials and is not a recommendation to buy or sell any specific securities.
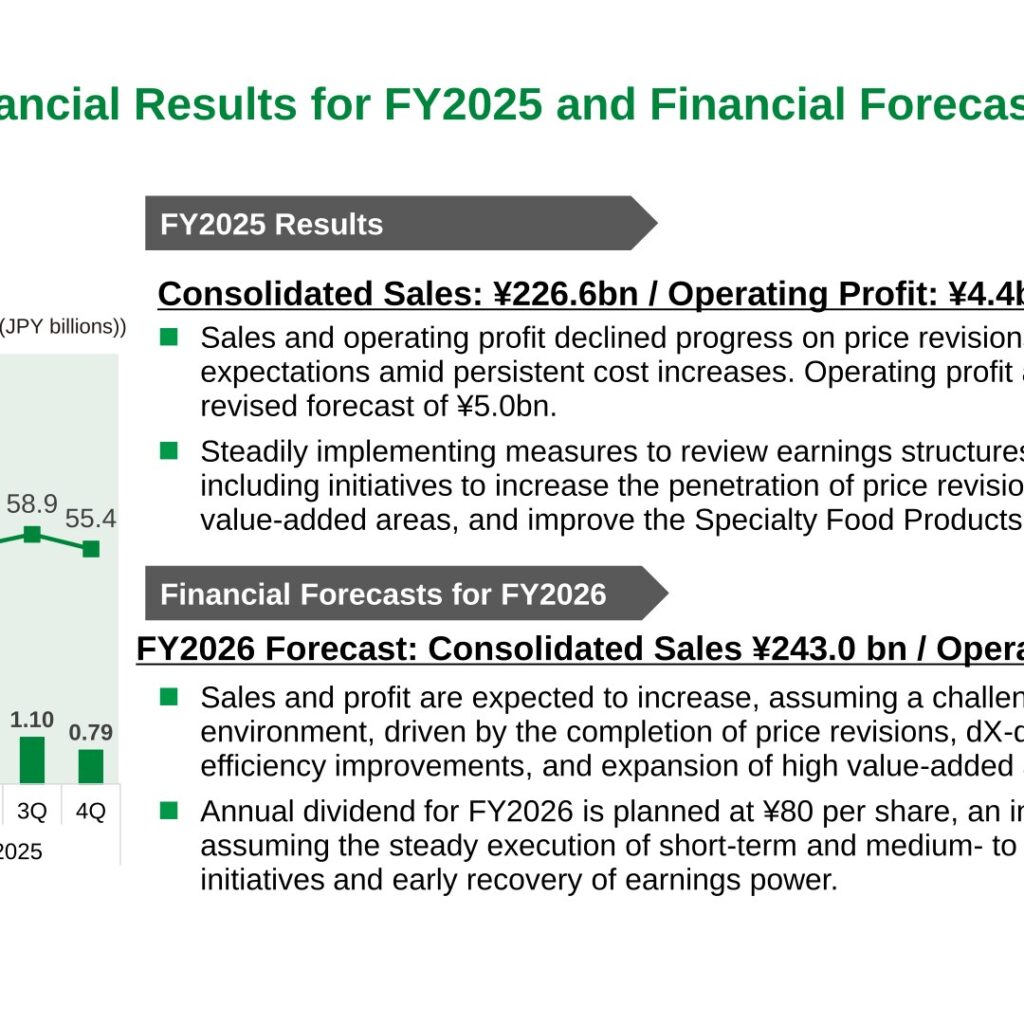
J-Oil Mills, Inc. reported consolidated net sales of ¥226.57 billion and operating profit of ¥4.40 billion for FY2025, with both sales and profit down year on year. The company states that progress on price revisions fell short of expectations amid persistent cost increases, and that operating profit also fell short of the revised forecast of ¥5.0bn. For FY2026 the company forecasts consolidated sales of ¥243.00 billion and operating profit of ¥5.50 billion, and plans an annual dividend of ¥80 per share, an increase of ¥10. (Note: the company labels the fiscal year ended March 31, 2026 as “FY2025”; all labels in the tables and text below follow the source materials.)
Consolidated Results (Full-Year Actual)
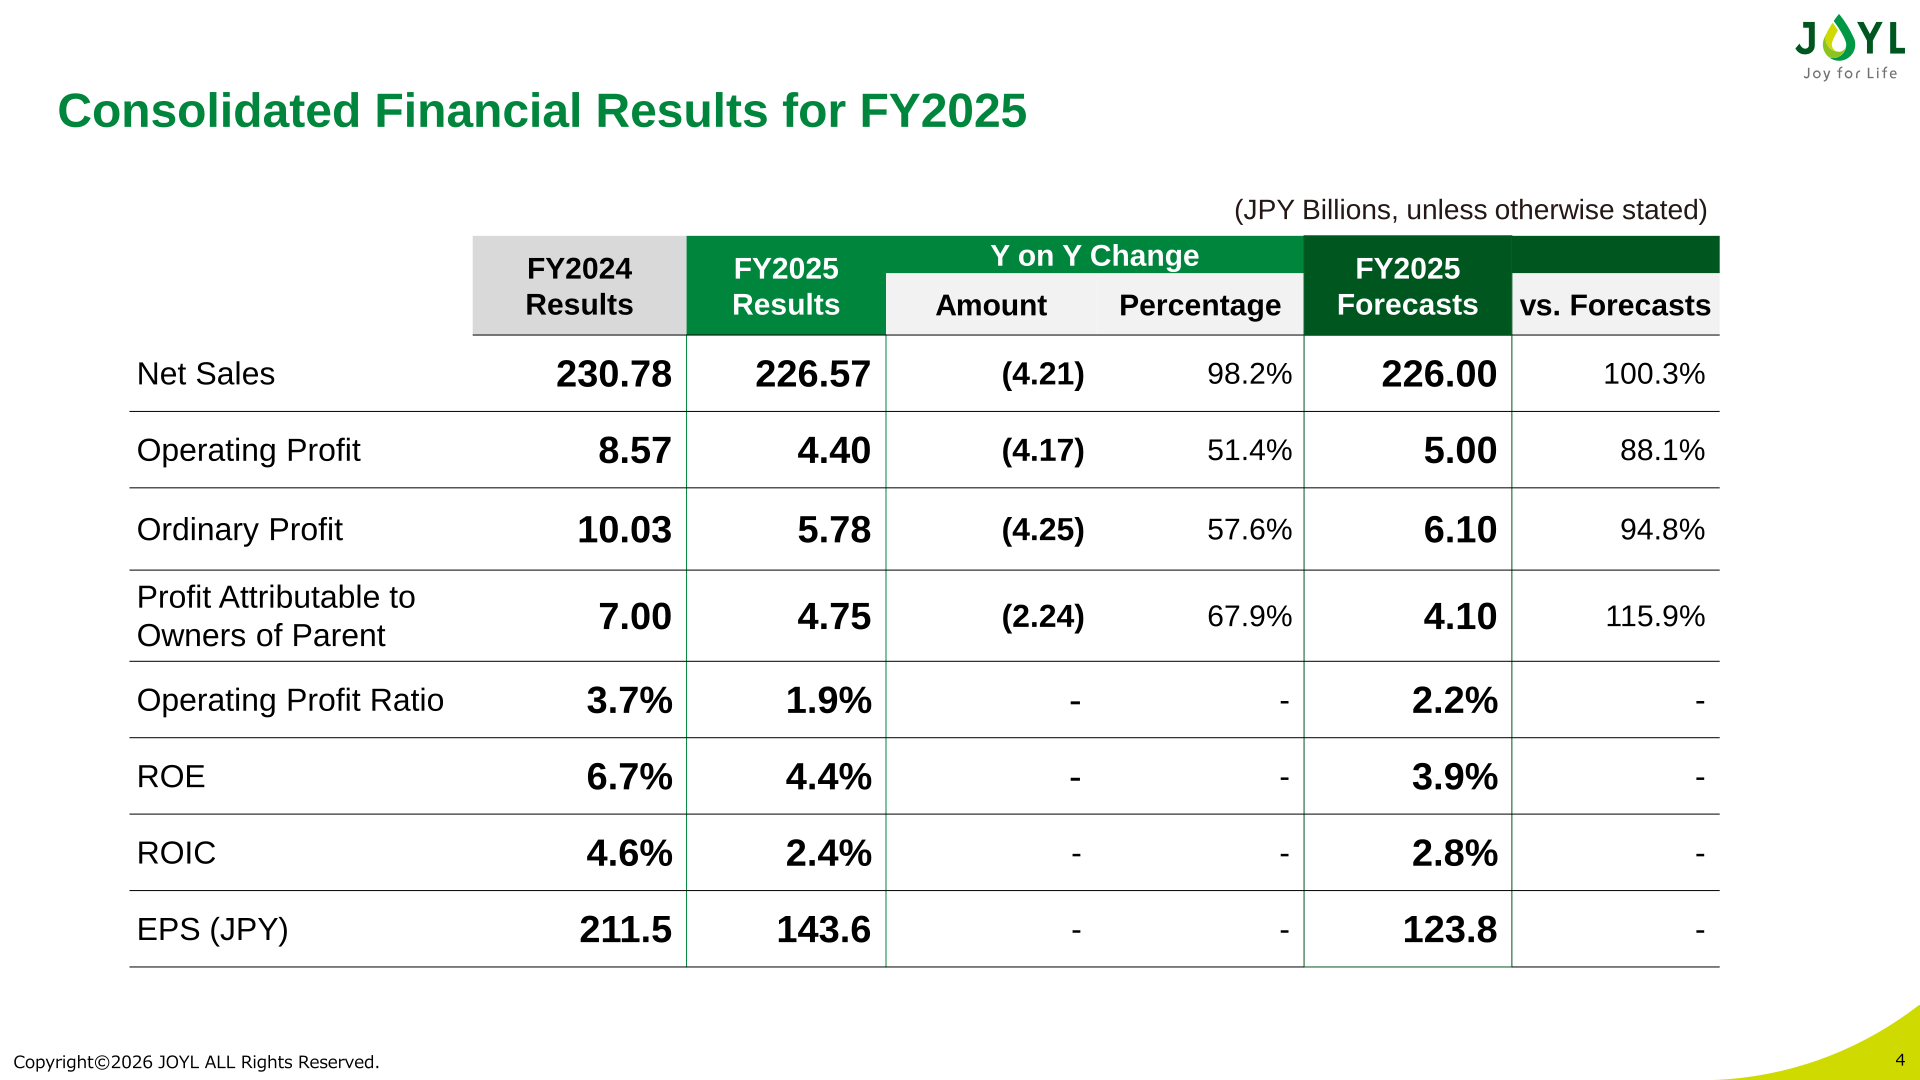
Net sales came to ¥226.57 billion (98.2% of the prior year) and operating profit to ¥4.40 billion (51.4%). Against the company’s own FY2025 forecasts, net sales reached 100.3% and operating profit 88.1%, while profit attributable to owners of parent exceeded the forecast at 115.9%.
| Item (JPY Billions, unless otherwise stated) | FY2024 Results | FY2025 Results | Y on Y Change (Amount) | Y on Y Change (Percentage) | FY2025 Forecasts | vs. Forecasts |
|---|---|---|---|---|---|---|
| Net Sales | 230.78 | 226.57 | (4.21) | 98.2% | 226.00 | 100.3% |
| Operating Profit | 8.57 | 4.40 | (4.17) | 51.4% | 5.00 | 88.1% |
| Ordinary Profit | 10.03 | 5.78 | (4.25) | 57.6% | 6.10 | 94.8% |
| Profit Attributable to Owners of Parent | 7.00 | 4.75 | (2.24) | 67.9% | 4.10 | 115.9% |
| Operating Profit Ratio | 3.7% | 1.9% | – | – | 2.2% | – |
| ROE | 6.7% | 4.4% | – | – | 3.9% | – |
| ROIC | 4.6% | 2.4% | – | – | 2.8% | – |
| EPS (JPY) | 211.5 | 143.6 | – | – | 123.8 | – |
Segment Results
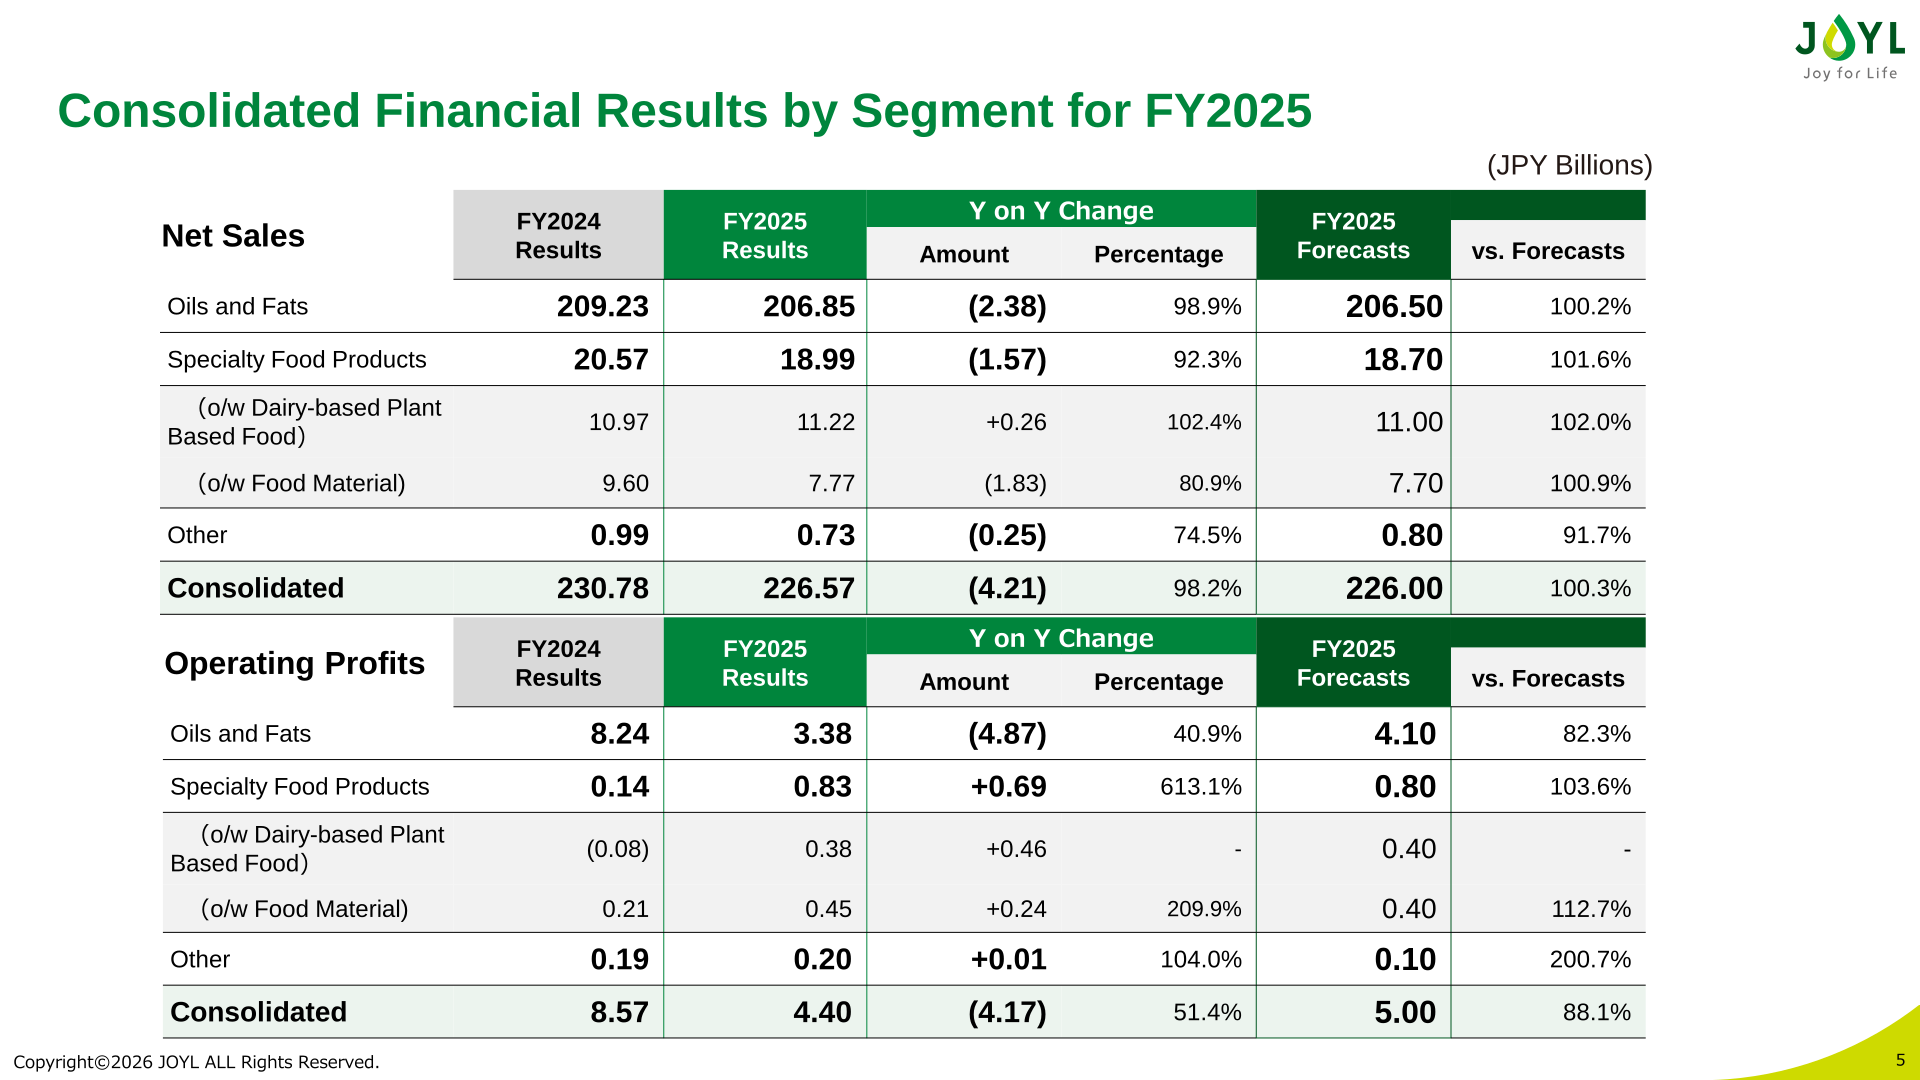
In the Oils and Fats segment, net sales were ¥206.85 billion (98.9% year on year) and operating profit ¥3.38 billion (40.9%). The Specialty Food Products segment posted net sales of ¥18.99 billion (92.3%) but raised operating profit to ¥0.83 billion (613.1%), with the Dairy-based Plant Based Food business turning from a loss of ¥0.08 billion to a profit of ¥0.38 billion.
| Net Sales (JPY Billions) | FY2024 Results | FY2025 Results | Y on Y Change (Amount) | Y on Y Change (Percentage) | FY2025 Forecasts | vs. Forecasts |
|---|---|---|---|---|---|---|
| Oils and Fats | 209.23 | 206.85 | (2.38) | 98.9% | 206.50 | 100.2% |
| Specialty Food Products | 20.57 | 18.99 | (1.57) | 92.3% | 18.70 | 101.6% |
| (o/w Dairy-based Plant Based Food) | 10.97 | 11.22 | +0.26 | 102.4% | 11.00 | 102.0% |
| (o/w Food Material) | 9.60 | 7.77 | (1.83) | 80.9% | 7.70 | 100.9% |
| Other | 0.99 | 0.73 | (0.25) | 74.5% | 0.80 | 91.7% |
| Consolidated | 230.78 | 226.57 | (4.21) | 98.2% | 226.00 | 100.3% |
| Operating Profits (JPY Billions) | FY2024 Results | FY2025 Results | Y on Y Change (Amount) | Y on Y Change (Percentage) | FY2025 Forecasts | vs. Forecasts |
|---|---|---|---|---|---|---|
| Oils and Fats | 8.24 | 3.38 | (4.87) | 40.9% | 4.10 | 82.3% |
| Specialty Food Products | 0.14 | 0.83 | +0.69 | 613.1% | 0.80 | 103.6% |
| (o/w Dairy-based Plant Based Food) | (0.08) | 0.38 | +0.46 | – | 0.40 | – |
| (o/w Food Material) | 0.21 | 0.45 | +0.24 | 209.9% | 0.40 | 112.7% |
| Other | 0.19 | 0.20 | +0.01 | 104.0% | 0.10 | 200.7% |
| Consolidated | 8.57 | 4.40 | (4.17) | 51.4% | 5.00 | 88.1% |
The company’s breakdown of the ¥4.87 billion decline in Oils and Fats segment profit shows product sales of +2.92 (unit selling price +2.33, sales volume +0.59), oils and fats cost of (6.80) — comprising raw material costs of +2.78 and meal sales of (9.58) — cost improvement of (0.99), logistics costs of (1.38) and SG&A expenses, etc. of +0.49. Within meal sales, selling price accounted for (9.94) and sales volume for +0.36. The average exchange rate was JPY150/US$1 in FY2024 and JPY149/US$1 in FY2025.
High Value-Added Products
Consolidated high value-added product sales reached ¥71.63 billion in FY2025. Net sales rose to ¥71.63 billion (101.9% year on year) and gross profit to ¥14.78 billion (109.6%), lifting the gross profit ratio to 20.6% from 19.2% (+1.4PPt). Business use sales grew to ¥43.10 billion (108.9%) while household use declined to ¥16.95 billion (90.9%).
| High Value-Added Products (JPY Billions) | FY2024 | FY2025 | Change |
|---|---|---|---|
| Household Use | 18.64 | 16.95 | 90.9% |
| Business Use | 39.59 | 43.10 | 108.9% |
| Oils and Fats | 58.23 | 60.05 | 103.1% |
| Specialty Food Products | 12.09 | 11.58 | 95.8% |
| Net Sales | 70.32 | 71.63 | 101.9% |
| Gross Profit | 13.49 | 14.78 | 109.6% |
| Gross Profit Ratio | 19.2% | 20.6% | +1.4PPt |
Balance Sheet and Cash Flows
Total assets stood at ¥166.3 billion as of March 31, 2026, down ¥3.8 billion from a year earlier, while net assets rose ¥4.8 billion to ¥111.1 billion. Interest-bearing liabilities (total bonds payable and borrowings) fell ¥5.5 billion to ¥18.7 billion, and the capital adequacy ratio improved to 66.5% from 62.2%. Operating cash flow was +3.0, investment cash flow (3.5), financial cash flow (8.2) and free cash flow (0.5).
| Item (JPY Billions) | Mar.31, 2025 | Mar 31, 2026 | Change |
|---|---|---|---|
| Current Assets | 101.4 | 95.7 | (5.7) |
| Cash and Deposits | 12.0 | 3.3 | (8.6) |
| Inventories | 45.8 | 46.9 | +1.1 |
| Non-current Assets / Deferred Assets | 68.7 | 70.6 | +1.9 |
| Total Assets | 170.2 | 166.3 | (3.8) |
| Current Liabilities | 63.9 | 55.2 | (8.7) |
| Interest-bearing Liabilities | 24.2 | 18.7 | (5.5) |
| Net Assets | 106.3 | 111.1 | +4.8 |
| Total Liabilities / Net Assets | 170.2 | 166.3 | (3.8) |
Full-Year Forecast
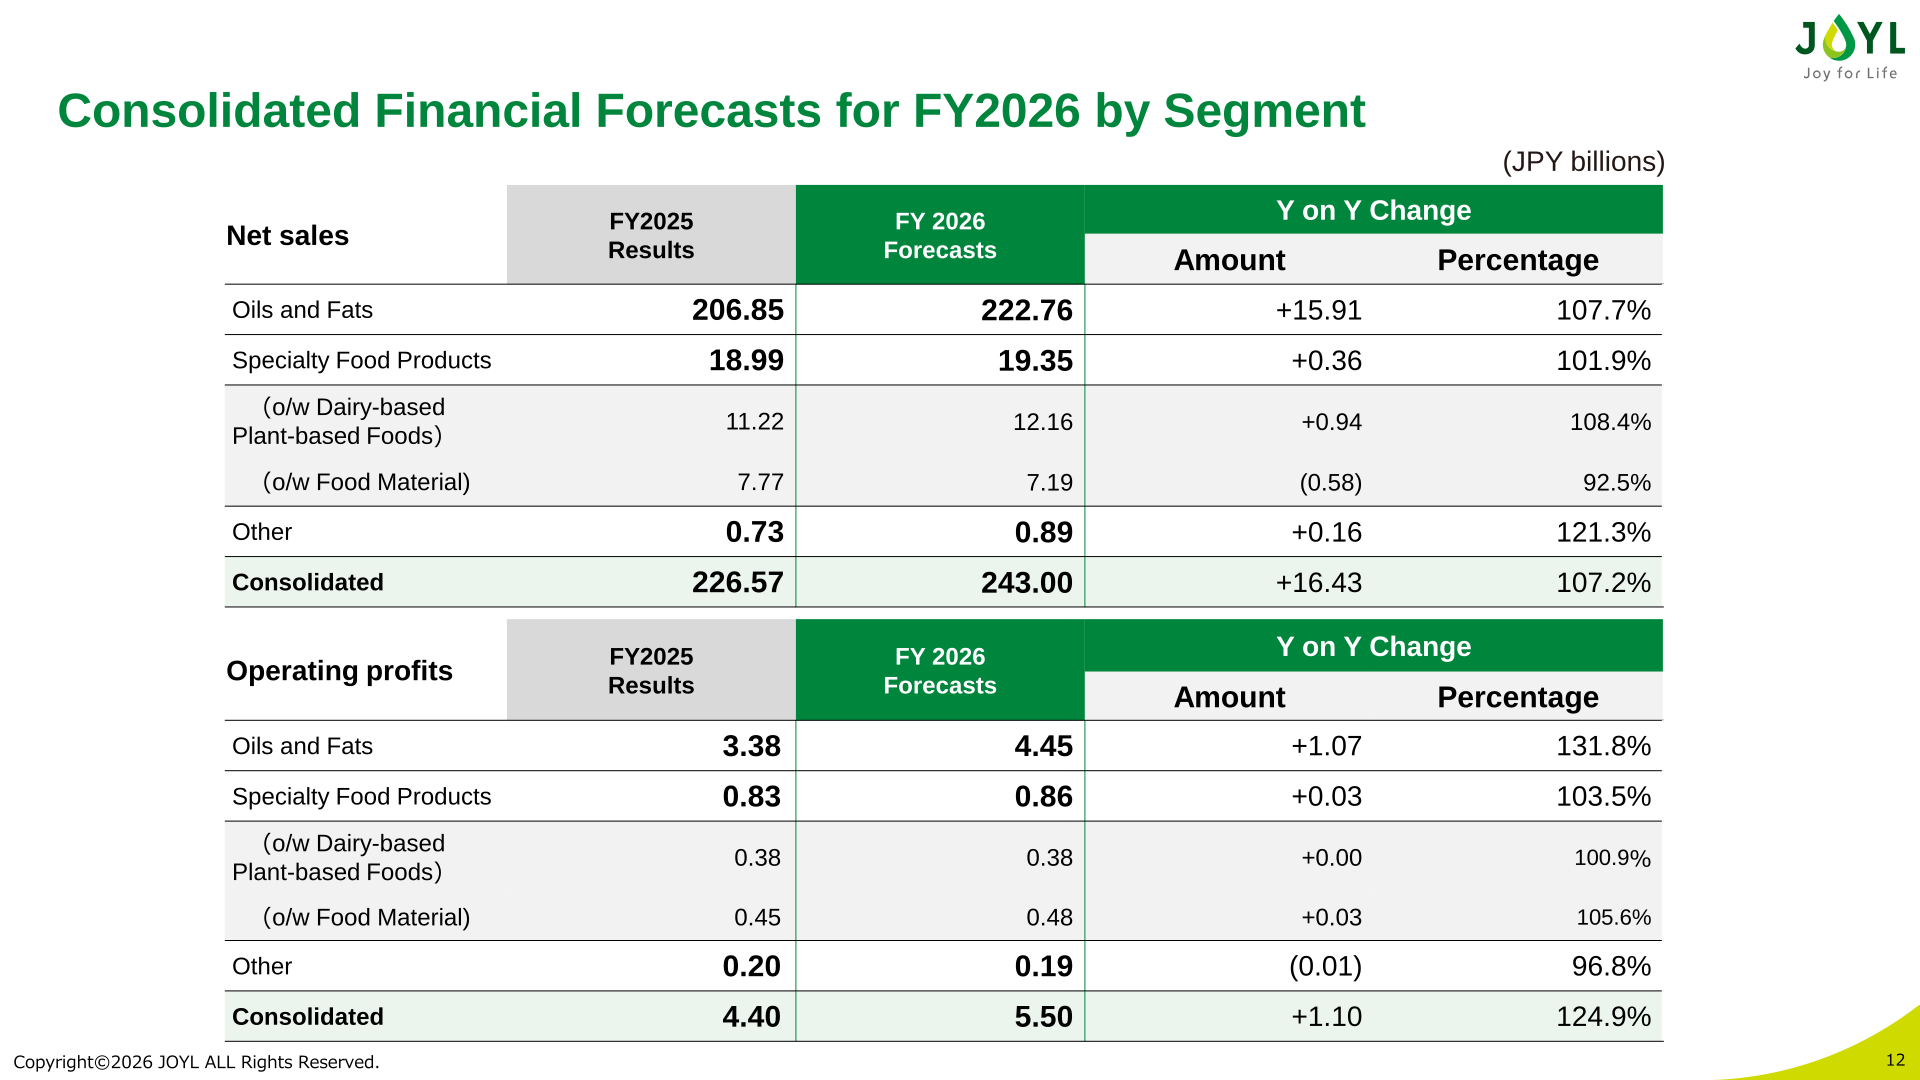
For FY2026 the company forecasts net sales of ¥243.00 billion (+16.43, 107.2%) and operating profit of ¥5.50 billion (+1.10, 124.9%), with profit attributable to owners of parent of ¥5.00 billion (105.2%) and EPS of ¥151.0. The forecast assumes a challenging cost environment and is driven by the completion of price revisions, dX-driven operational efficiency improvements and expansion of high value-added areas. The assumed average exchange rate is JPY155/US$1.
| Item (JPY Billions, unless otherwise stated) | FY 2025 Results | FY 2026 Forecasts | Y on Y Change (Amount) | Y on Y Change (Percentage) |
|---|---|---|---|---|
| Net Sales | 226.57 | 243.00 | +16.43 | 107.2% |
| Operating Profit | 4.40 | 5.50 | +1.10 | 124.9% |
| Ordinary Profit | 5.78 | 6.20 | +0.42 | 107.2% |
| Profit Attributable to Owners of Parent | 4.75 | 5.00 | +0.25 | 105.2% |
| Operating Profit Margin | 1.9% | 2.3% | – | – |
| ROE | 4.4% | 4.5% | – | – |
| ROIC | 2.4% | 2.8% | – | – |
| EPS (JPY) | 143.6 | 151.0 | – | – |
| Segment Forecast (JPY billions) | Metric | FY2025 Results | FY 2026 Forecasts | Y on Y Change (Amount) | Y on Y Change (Percentage) |
|---|---|---|---|---|---|
| Oils and Fats | Net sales | 206.85 | 222.76 | +15.91 | 107.7% |
| Specialty Food Products | Net sales | 18.99 | 19.35 | +0.36 | 101.9% |
| (o/w Dairy-based Plant-based Foods) | Net sales | 11.22 | 12.16 | +0.94 | 108.4% |
| (o/w Food Material) | Net sales | 7.77 | 7.19 | (0.58) | 92.5% |
| Other | Net sales | 0.73 | 0.89 | +0.16 | 121.3% |
| Consolidated | Net sales | 226.57 | 243.00 | +16.43 | 107.2% |
| Oils and Fats | Operating profits | 3.38 | 4.45 | +1.07 | 131.8% |
| Specialty Food Products | Operating profits | 0.83 | 0.86 | +0.03 | 103.5% |
| (o/w Dairy-based Plant-based Foods) | Operating profits | 0.38 | 0.38 | +0.00 | 100.9% |
| (o/w Food Material) | Operating profits | 0.45 | 0.48 | +0.03 | 105.6% |
| Other | Operating profits | 0.20 | 0.19 | (0.01) | 96.8% |
| Consolidated | Operating profits | 4.40 | 5.50 | +1.10 | 124.9% |
The company’s key initiative for FY2026 is to complete price revisions and strengthen core profitability. For products delivered after 2026/4/1 the revision range is 9%–14% for household use and 7%–11% for business use/processed use; for products delivered after 2026/6/1 the range is 11%–16% for household use and 17%–22% for business use/processed use.
Shareholder Returns
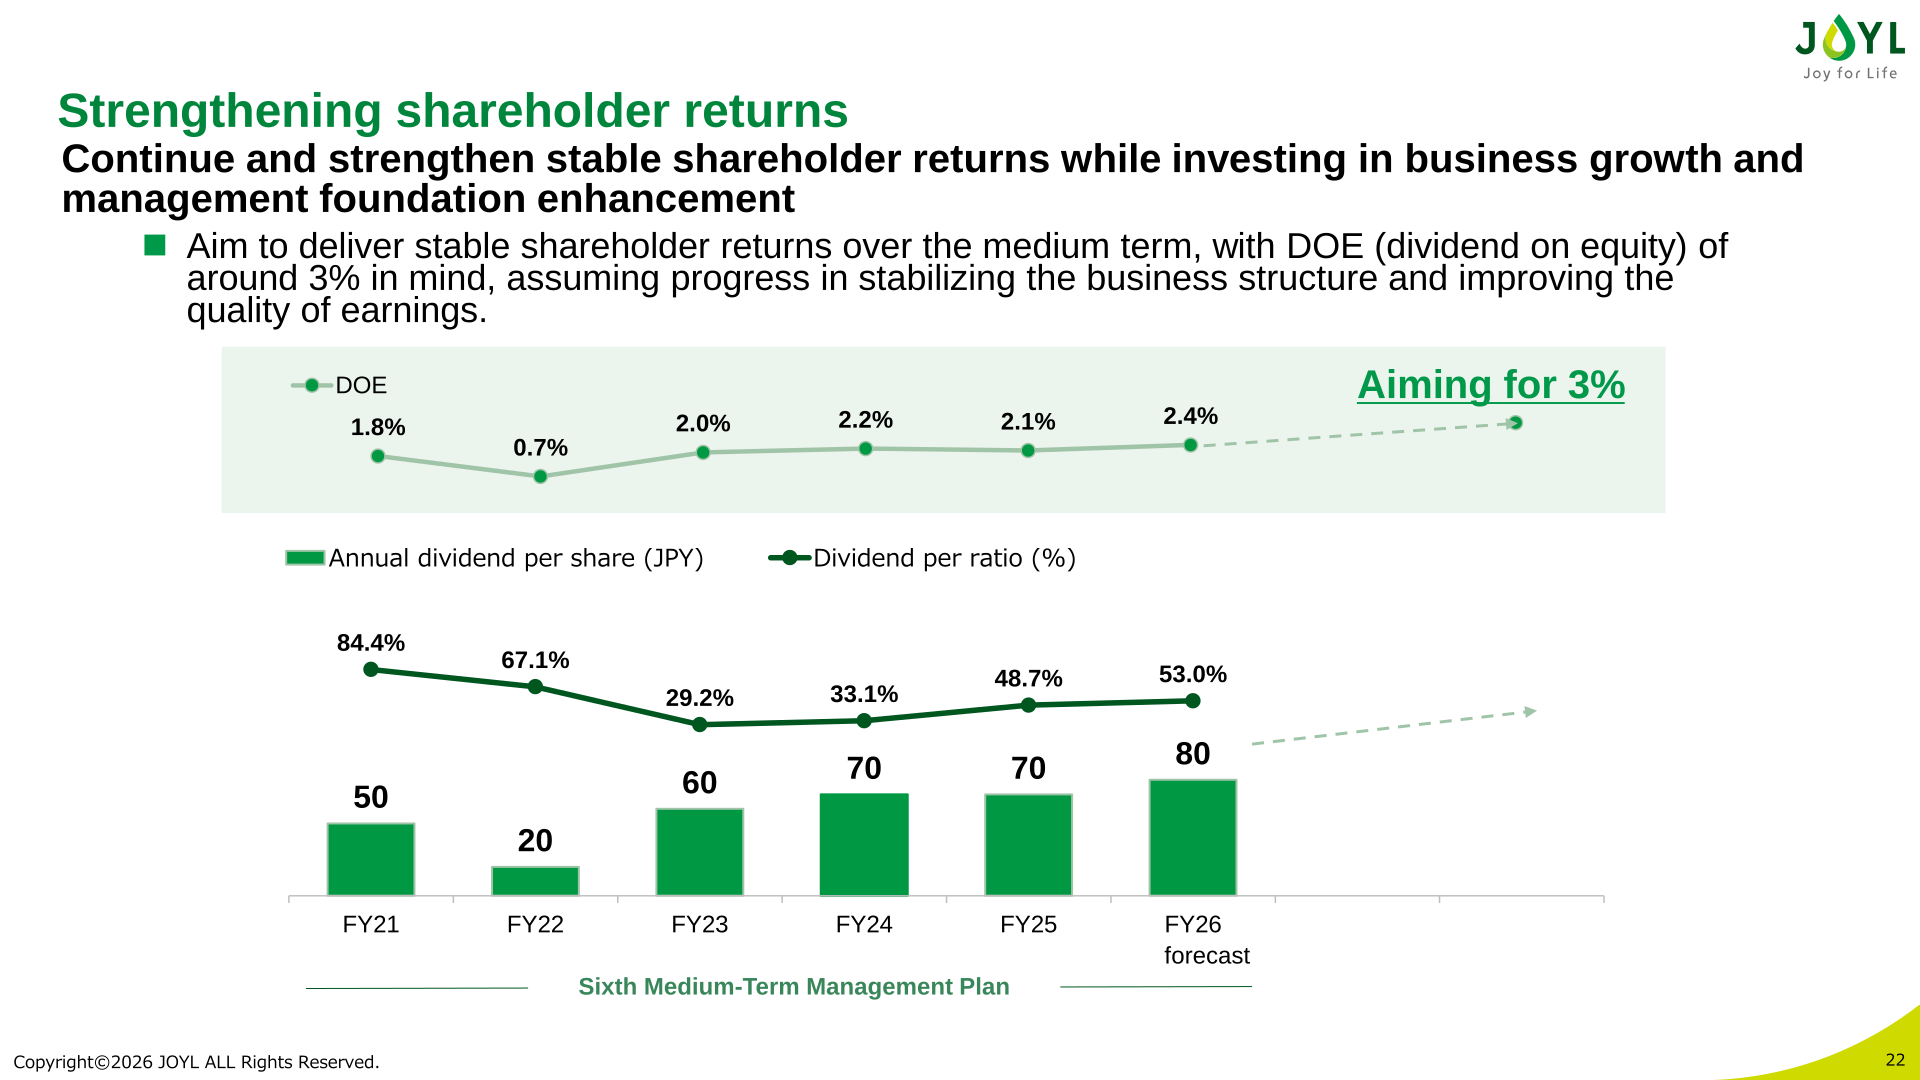
The company aims to deliver stable shareholder returns over the medium term with DOE (dividend on equity) of around 3% in mind, assuming progress in stabilizing the business structure and improving the quality of earnings. The annual dividend per share for FY2025 was ¥70, with a dividend payout ratio of 48.7% and DOE of 2.1%. For FY2026 the company plans ¥80 per share, an increase of ¥10, with a payout ratio of 53.0% and DOE of 2.4%.
| Item | FY23 | FY24 | FY25 | FY26 (forecast) |
|---|---|---|---|---|
| Annual dividend per share (JPY) | 60 | 70 | 70 | 80 |
| Dividend per ratio (%) | 29.2% | 33.1% | 48.7% | 53.0% |
| DOE | 2.0% | 2.2% | 2.1% | 2.4% |
Medium-Term Plan and Topics
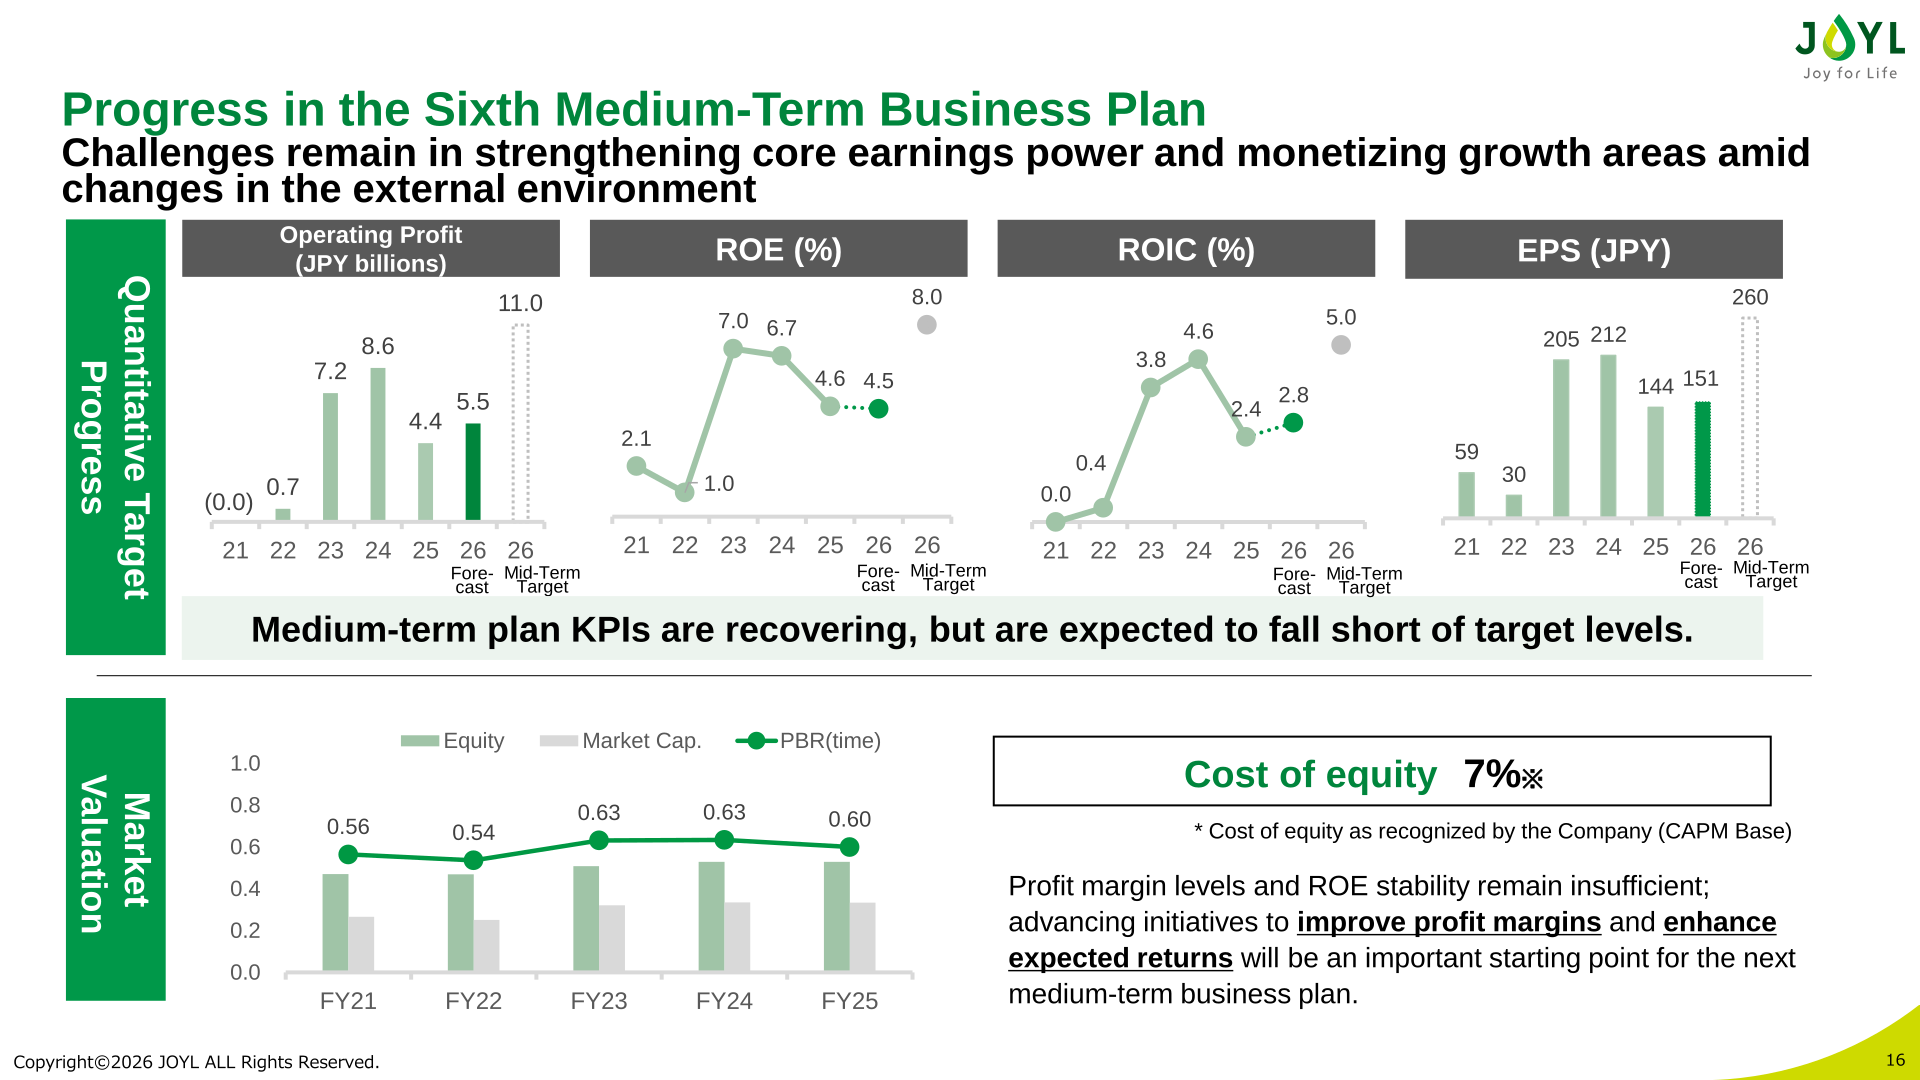
On the Sixth Medium-Term Management Plan, the company states that medium-term plan KPIs are recovering but are expected to fall short of target levels. The mid-term targets shown are operating profit of ¥11.0 billion, ROE of 8.0%, ROIC of 5.0% and EPS of ¥260, against an FY2026 forecast of operating profit ¥5.5 billion and EPS ¥151. Cost of equity as recognized by the company (CAPM base) is 7%, and PBR was 0.60 times in FY25.
FY2025 progress items cited include improving the earnings of the Specialty Food Products business by reviewing it (+¥0.69 bn), completion of preparation for the integration of R&D bases, better employee engagement (47%→51%), promotion of dX centering on business reform with total work hours reduced by approximately 1% for the entire company, designation as a “DX-certified business,” and enhanced governance through the streamlining of subsidiaries. FY2026 actions include developing a partnership with Ajinomoto Health & Nutrition North America, Inc., establishing an organization structure to lead overseas strategies, raising employee engagement to 55%, reviewing shareholder returns and capital policy, and shortening the CCC by 6 days.
This article is an analysis based on publicly available information and is not a recommendation to buy or sell any specific securities. Investment decisions are your own responsibility.
















