
This article is based on publicly available IR materials and is not a recommendation to buy or sell any specific securities.
Note: The company labels the fiscal year ended March 31, 2026 as “FY2026” and the preceding year as “FY2025”; this article keeps those labels in the text and tables, while the title and URL follow this site’s convention of calling the most recently completed fiscal year “FY2025”.
LIFEDRINK COMPANY, INC. (“LDC”) released its Presentation Material of Financial Results for FY2026 on May 15, 2026, covering the fiscal year ended March 31, 2026. Revenue rose 18% year on year to ¥52,651 million, operating profit rose 12% to ¥5,326 million and profit rose 2% to ¥3,461 million. Production volume increased 13% to 83 million cases, helped by contributions from O Beverage (OBK) and the Gotemba Factory and by N Beverage (NBK) moving to full-scale production. For FY2027 the company guides for revenue of ¥72.0 billion (+37%) and operating profit of ¥6.5 billion (+22%), reflecting three new production lines and its newly entered vending machine business.
FY2026 Highlights
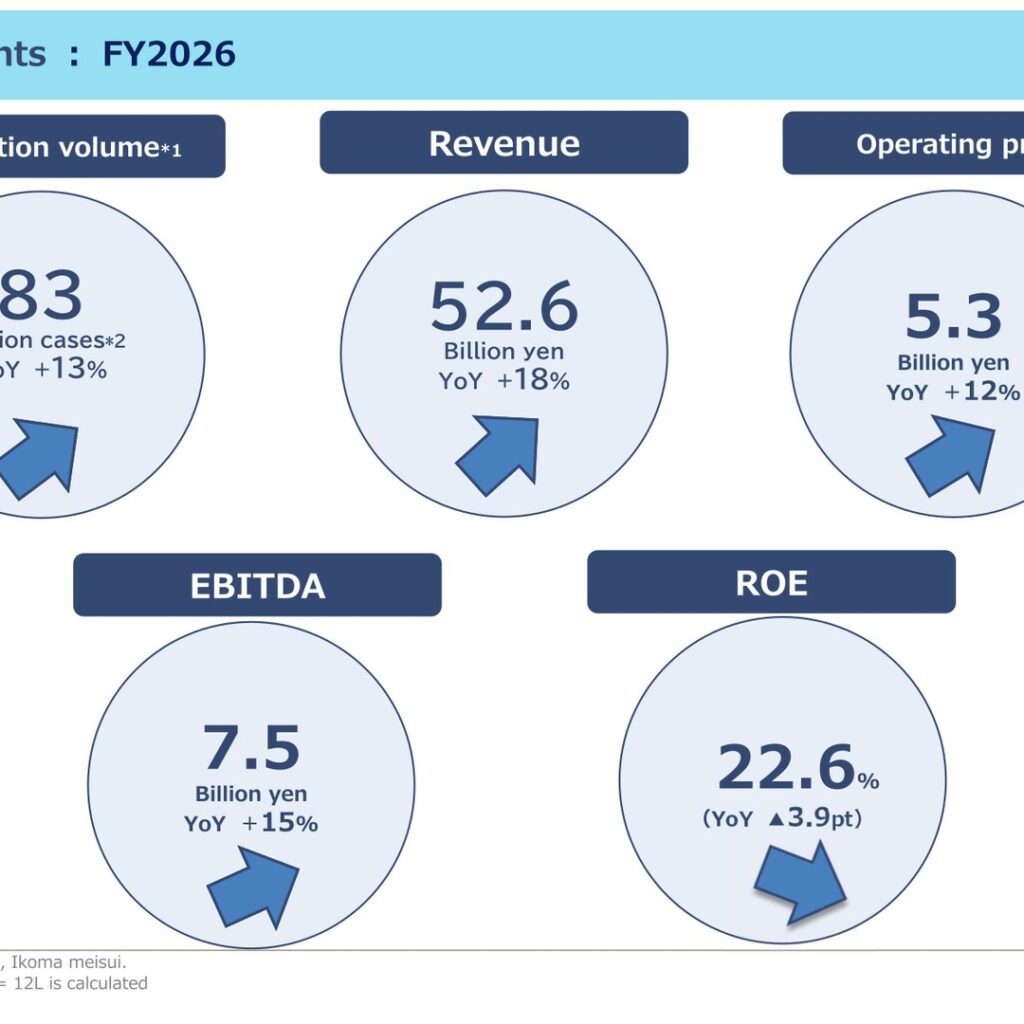
The highlight page of the presentation lists production volume of 83 million cases (YoY +13%; one box is calculated as 12L, excluding Ikoma Meisui), revenue of ¥52.6 billion (YoY +18%), operating profit of ¥5.3 billion (YoY +12%) and EBITDA of ¥7.5 billion (YoY +15%). ROE was 22.6%, down 3.9pt year on year. Management describes the year as one of increased production, revenue and operating profit.
Consolidated Results (Full-Year Actual)
Higher production volume (+13% YoY, excluding production from affiliate Ikoma Meisui Co., Ltd.) drove an ¥8.1 billion revenue increase (+18%), and the company offset rising costs through revenue growth and cost-reduction efforts to lift operating profit by 12%. EPS is calculated assuming the 4-for-1 common stock split carried out on October 1, 2024 had been conducted at the beginning of the previous consolidated fiscal year.
| Item (Unit: MM JPY) | FY2026 | FY2025 | Variance | YoY% |
|---|---|---|---|---|
| Revenue | 52,651 | 44,537 | +8,113 | +18% |
| Operating profit | 5,326 | 4,742 | +583 | +12% |
| Operating profit % | 10.1% | 10.6% | ▲0.5pt | – |
| Profit | 3,461 | 3,392 | +68 | +2% |
| Profit % | 6.6% | 7.6% | ▲1.0pt | – |
| EPS (yen) | 66.46 | 64.93 | +1.5 yen | – |
| EBITDA | 7,532 | 6,560 | +972 | +15% |
| EBITDA % | 14.3% | 14.7% | ▲0.4pt | – |
Operating Profit Bridge vs FY2025
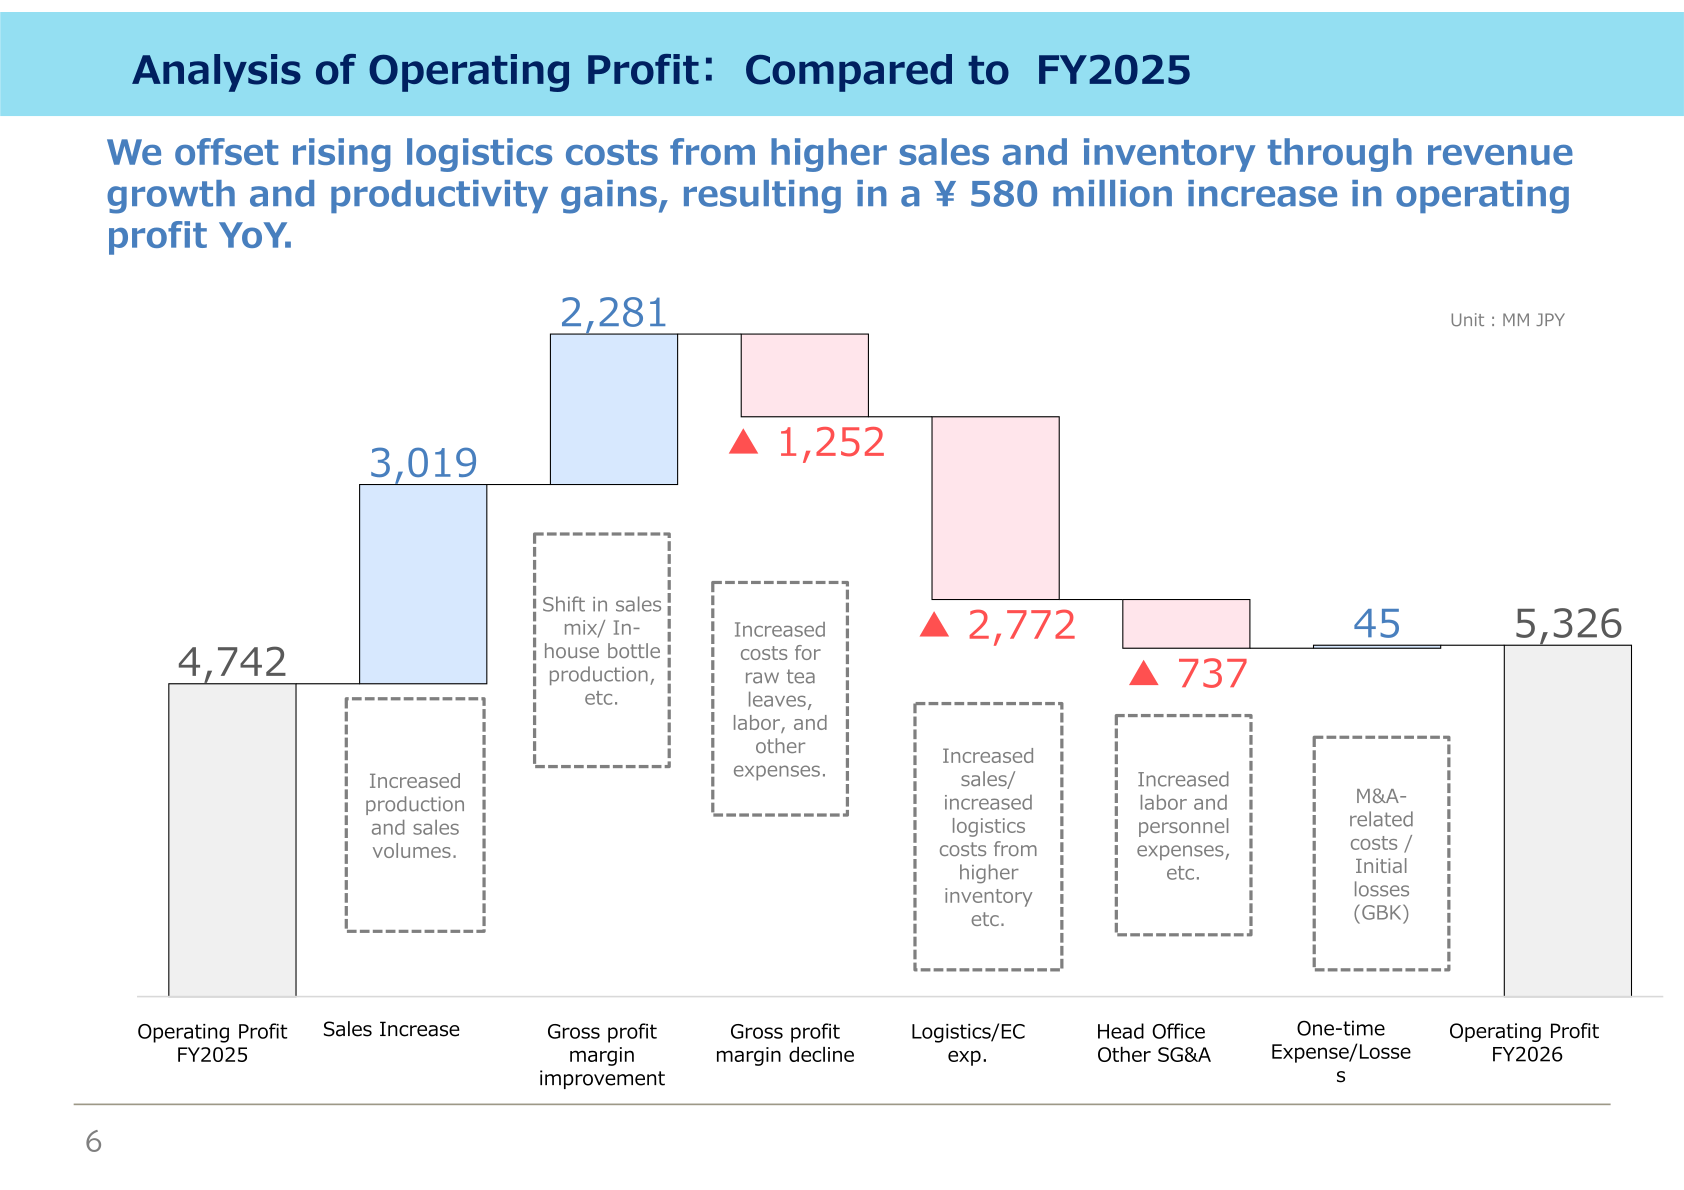
The presentation explains that rising logistics costs from higher sales and inventory were offset by revenue growth and productivity gains, resulting in a ¥580 million increase in operating profit year on year.
| Factor (Unit: MM JPY) | Amount | Company’s note |
|---|---|---|
| Operating Profit FY2025 | 4,742 | – |
| Sales Increase | 3,019 | Increased production and sales volumes. |
| Gross profit margin improvement | 2,281 | Shift in sales mix / In-house bottle production, etc. |
| Gross profit margin decline | ▲1,252 | Increased costs for raw tea leaves, labor, and other expenses. |
| Logistics/EC exp. | ▲2,772 | Increased sales / increased logistics costs from higher inventory etc. |
| Head Office Other SG&A | ▲737 | Increased labor and personnel expenses, etc. |
| One-time Expense/Losses | 45 | M&A-related costs / Initial losses (GBK) |
| Operating Profit FY2026 | 5,326 | – |
Balance Sheet and Cash Flow
Fixed assets rose by ¥10.4 billion due to capital expenditure at Gunma Beverage and N Beverage, and net interest-bearing debt increased by ¥9.9 billion as these investments were funded via loans. Operating cash flow was a ¥4.9 billion inflow (down ¥250 million YoY) on higher receivables, while investing cash flow was a ¥13.1 billion outflow (up ¥9.0 billion YoY) on capital expenditure.
| Item (Unit: MM JPY) | FY2026 | FY2025 | Variance |
|---|---|---|---|
| Current assets | 15,817 | 12,443 | +3,373 |
| [Cash and deposits] | 3,561 | 3,014 | +547 |
| Non-current assets | 31,246 | 20,763 | +10,482 |
| Total assets | 47,063 | 33,207 | +13,856 |
| Current liabilities | 19,284 | 10,811 | +8,473 |
| Non-current liabilities | 11,330 | 8,165 | +3,164 |
| [Interest-bearing debt] | 22,920 | 12,401 | +10,519 |
| Total liabilities | 30,614 | 18,976 | +11,637 |
| Net assets | 16,449 | 14,230 | +2,218 |
| [Net debt EBITDA ratio] | 2.5x | 1.4x | +1.1pt |
| Cash flows from operating activities | 4,951 | 5,204 | ▲253 |
| Cash flows from investing activities | ▲13,174 | ▲4,099 | ▲9,074 |
| (Capital investment) | ▲13,270 | ▲3,471 | ▲9,799 |
| Cash flows from financing activities | 8,769 | ▲1,826 | 10,596 |
| (Increase/decrease in interest-bearing debt) | 10,414 | ▲1,338 | 11,753 |
| (Dividend payment) | ▲627 | ▲483 | ▲144 |
Growth Investment and Topics
Growth investment in FY2026 totalled ¥10.7 billion against a ¥29.0 billion mid-term management plan through FY2029: ¥0.5 billion at LDC existing factories (plan ¥8.2 billion), ¥2.3 billion at the Gotemba Factory (plan ¥6.6 billion), ¥3.9 billion at subsidiaries / M&A / N Beverage (plan ¥5.9 billion) and ¥3.9 billion at O Beverage and Gunma Beverage (plan ¥8.3 billion). New lines at Gunma Beverage and N Beverage were launched and profit contribution is expected from FY2027. Post-merger integration at N Beverage and O Beverage is described as on track, and PMI has also started at Gunma Beverage, the former Pokka Sapporo Gunma Factory acquired in January 2026.
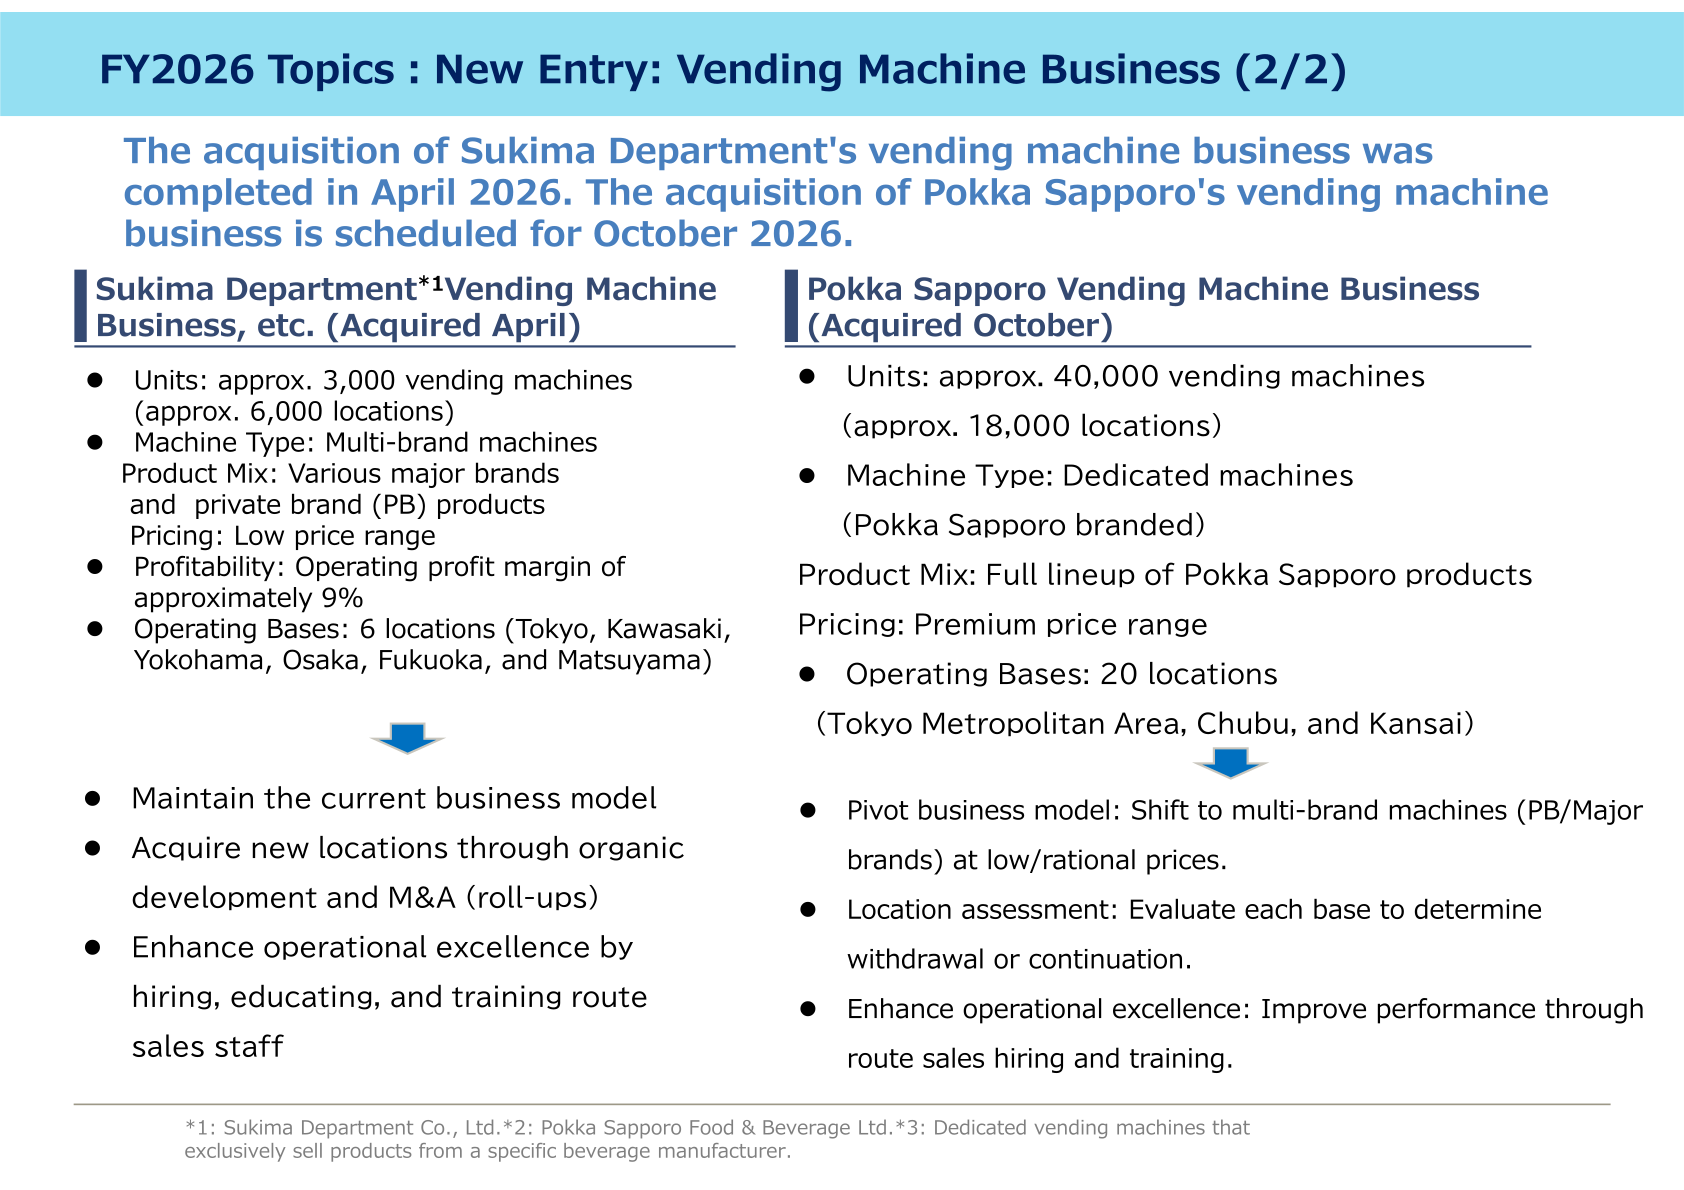
The company also entered the vending machine business. It acquired Sukima Department’s vending machine business in April 2026 (approximately 3,000 vending machines at approximately 6,000 locations, multi-brand machines in a low price range, operating profit margin of approximately 9%, six operating bases) and is scheduled to acquire Pokka Sapporo’s vending machine business in October 2026 (approximately 40,000 vending machines at approximately 18,000 locations, dedicated Pokka Sapporo branded machines at a premium price range, 20 operating bases). LDC aims for ¥1.0 billion in operating profit from the vending machine business by FYE March 2030. Separately, LD Agri Co., Ltd. was established in Kagoshima, where the company leased tea plantations, began tea leaf cultivation and acquired a crude tea factory in Chiran in April 2026.
FY2027 Forecast
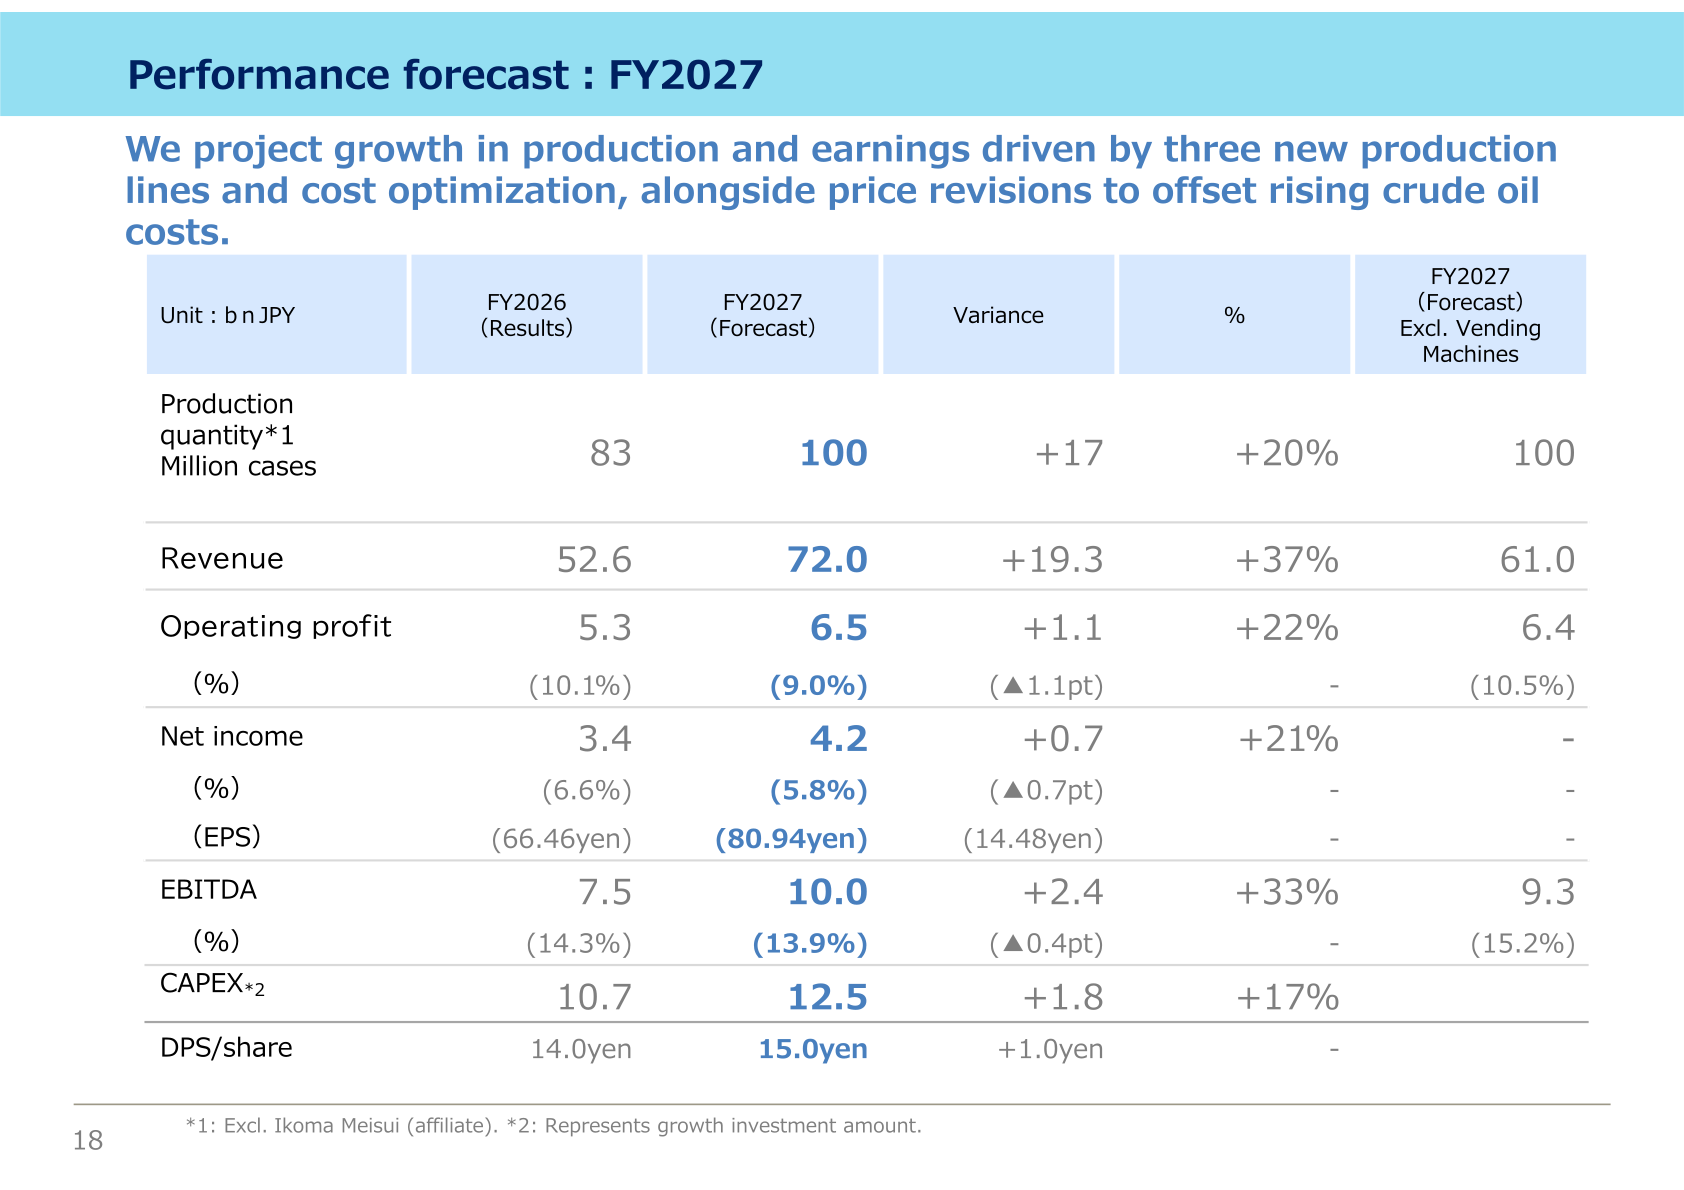
For FY2027 the company projects growth in production and earnings driven by three new production lines and cost optimization, alongside price revisions to offset rising crude oil costs. Operating profit guidance already reflects the impact of soaring crude oil prices due to the deteriorating situation in the Middle East and the corresponding price revisions for the company’s products.
| Item (Unit: bn JPY) | FY2026 (Results) | FY2027 (Forecast) | Variance | % | FY2027 (Forecast) Excl. Vending Machines |
|---|---|---|---|---|---|
| Production quantity (million cases) | 83 | 100 | +17 | +20% | 100 |
| Revenue | 52.6 | 72.0 | +19.3 | +37% | 61.0 |
| Operating profit | 5.3 | 6.5 | +1.1 | +22% | 6.4 |
| Operating profit (%) | (10.1%) | (9.0%) | (▲1.1pt) | – | (10.5%) |
| Net income | 3.4 | 4.2 | +0.7 | +21% | – |
| Net income (%) | (6.6%) | (5.8%) | (▲0.7pt) | – | – |
| EPS | (66.46yen) | (80.94yen) | (14.48yen) | – | – |
| EBITDA | 7.5 | 10.0 | +2.4 | +33% | 9.3 |
| EBITDA (%) | (14.3%) | (13.9%) | (▲0.4pt) | – | (15.2%) |
| CAPEX | 10.7 | 12.5 | +1.8 | +17% | – |
| DPS/share | 14.0yen | 15.0yen | +1.0yen | – | – |
The FY2027 operating profit bridge shows FY2026/3 operating profit of ¥5.32 billion rising to a FY2027/3 forecast of ¥6.50 billion: profit growth from increased production of ¥1.53 billion, logistics cost improvements of ¥0.39 billion (B2B logistics cost improvement of +5.8 against a rise in EC logistics unit costs of ▲1.9), soaring crude oil prices of ▲¥0.92 billion, the vending machine business of ¥0.10 billion and others of ¥0.07 billion.
Shareholder Returns
The forecast table shows dividend per share of 14.0 yen for FY2026 and a forecast of 15.0 yen for FY2027, an increase of 1.0 yen. Dividend payments in the cash flow statement were ¥627 million in FY2026 against ¥483 million in FY2025. No other shareholder return measures are described in the presentation.
Mid-Term Management Plan
The mid-term management plan is built on the evolution and deepening of “Max production and Max sales”: increasing and acquiring production capacity by updating and expanding existing factories at LDC, N Beverage, O Beverage and Gunma Beverage and through M&A; challenging the EC/D2C model by expanding products and services at the LDC online store and entering the vending machine business; and raising productivity through logistics network redesign, new warehouses, smart warehousing using AGVs and IT/AI-driven efficiency gains.
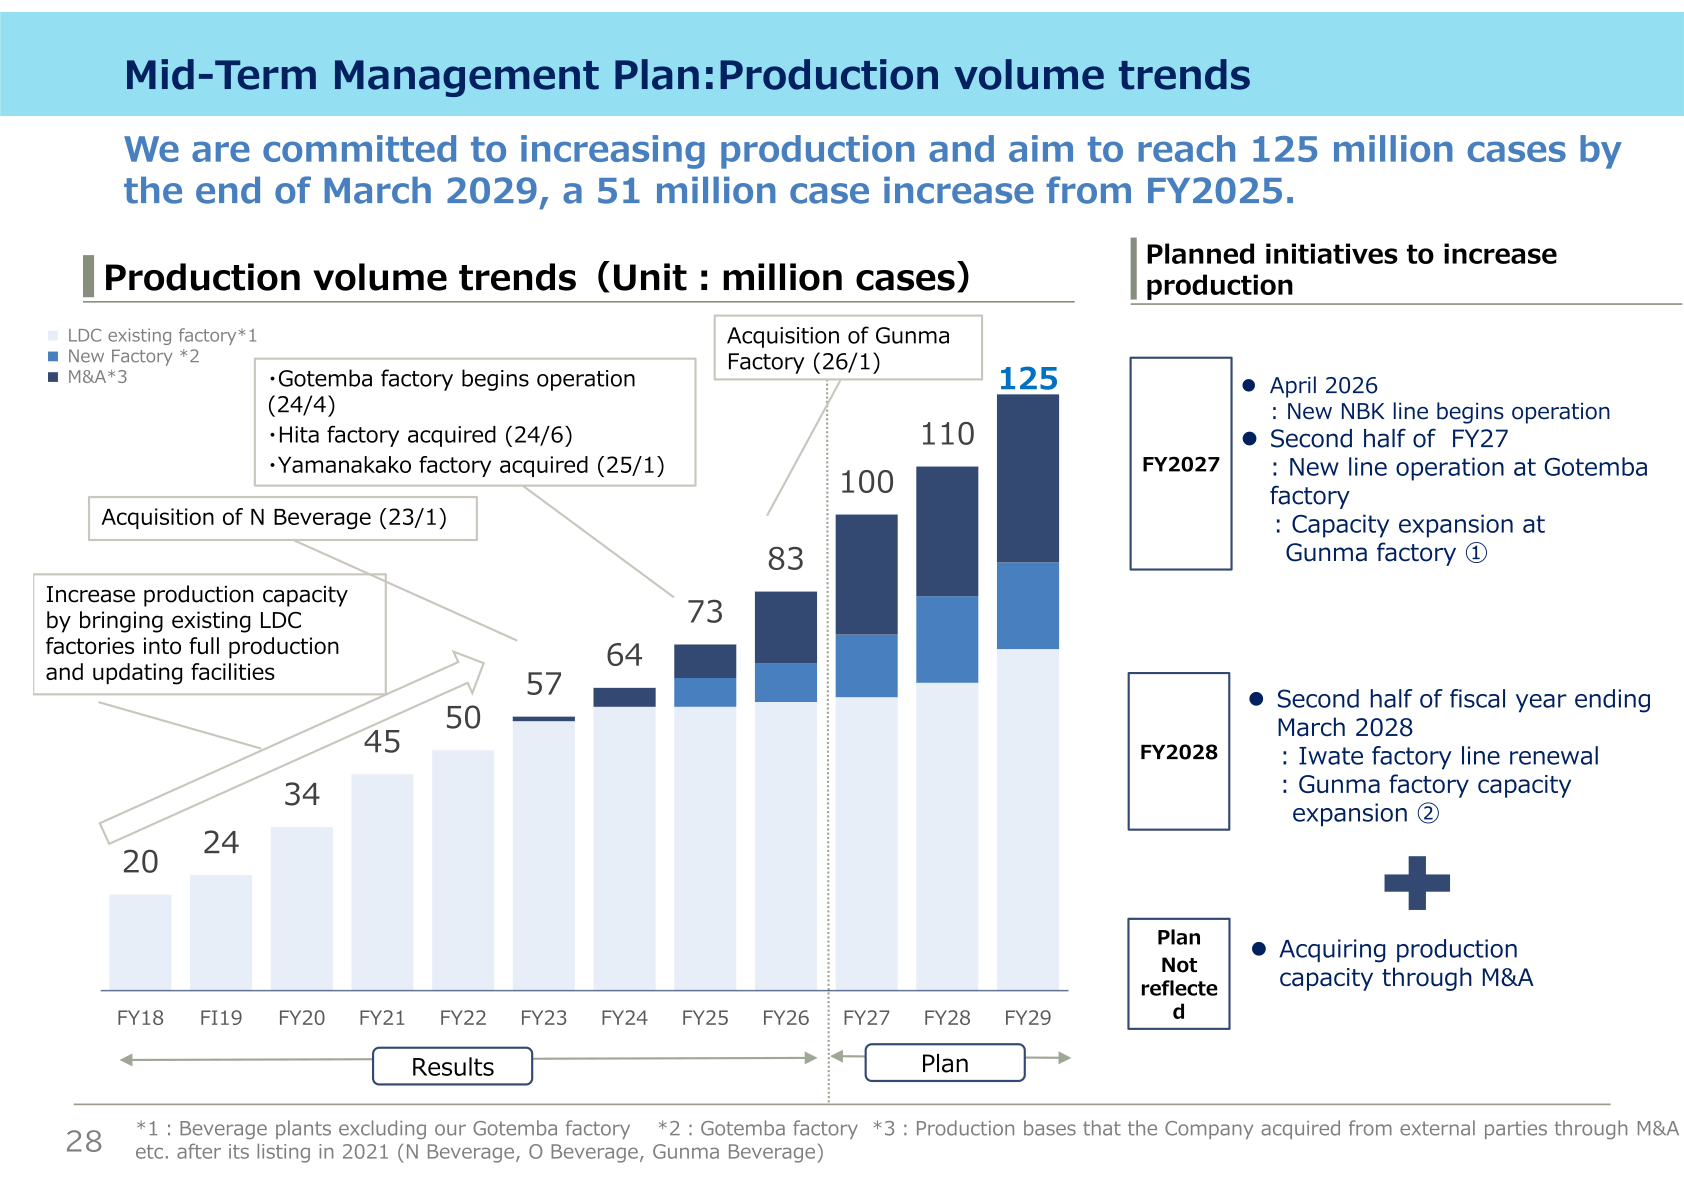
On the production volume trend chart, the company aims to reach 125 million cases by the end of March 2029, from 83 million cases in FY26, with 100 million cases planned for FY27 and 110 million cases for FY28. Planned initiatives include the new NBK line beginning operation in April 2026, a new line at the Gotemba factory and capacity expansion at the Gunma factory in the second half of FY27, and the Iwate factory line renewal plus further Gunma factory capacity expansion in the second half of the fiscal year ending March 2028; additional capacity acquired through M&A is not reflected in the plan.
This article is an analysis based on publicly available information and is not a recommendation to buy or sell any specific securities. Investment decisions are your own responsibility.
















