
This article is based on publicly available IR materials and is not a recommendation to buy or sell any specific securities.
Note: CUBE SYSTEM INC. labels the fiscal year ended March 31, 2026 as “FY March 2026”; this site classifies the most recent completed fiscal year as FY2025. Labels in the text, tables and segment data below follow the company’s materials.
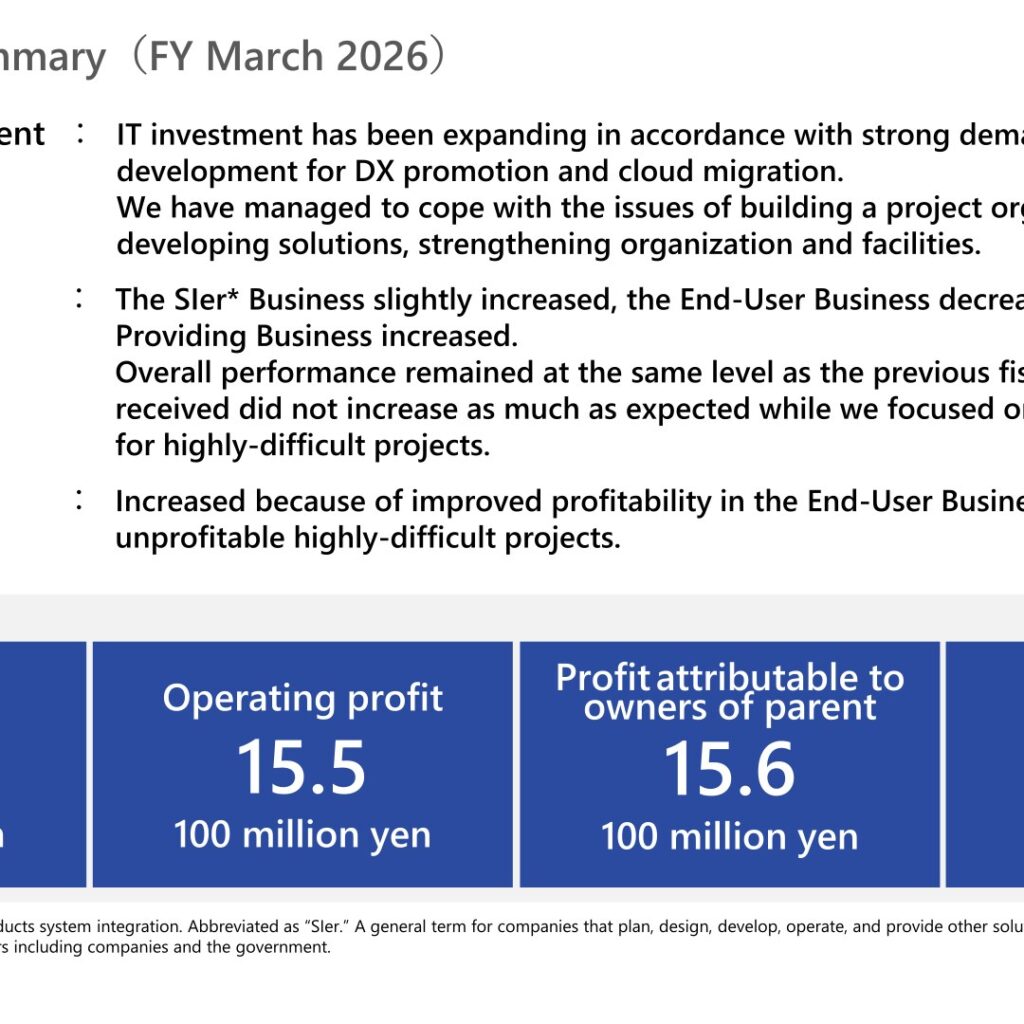
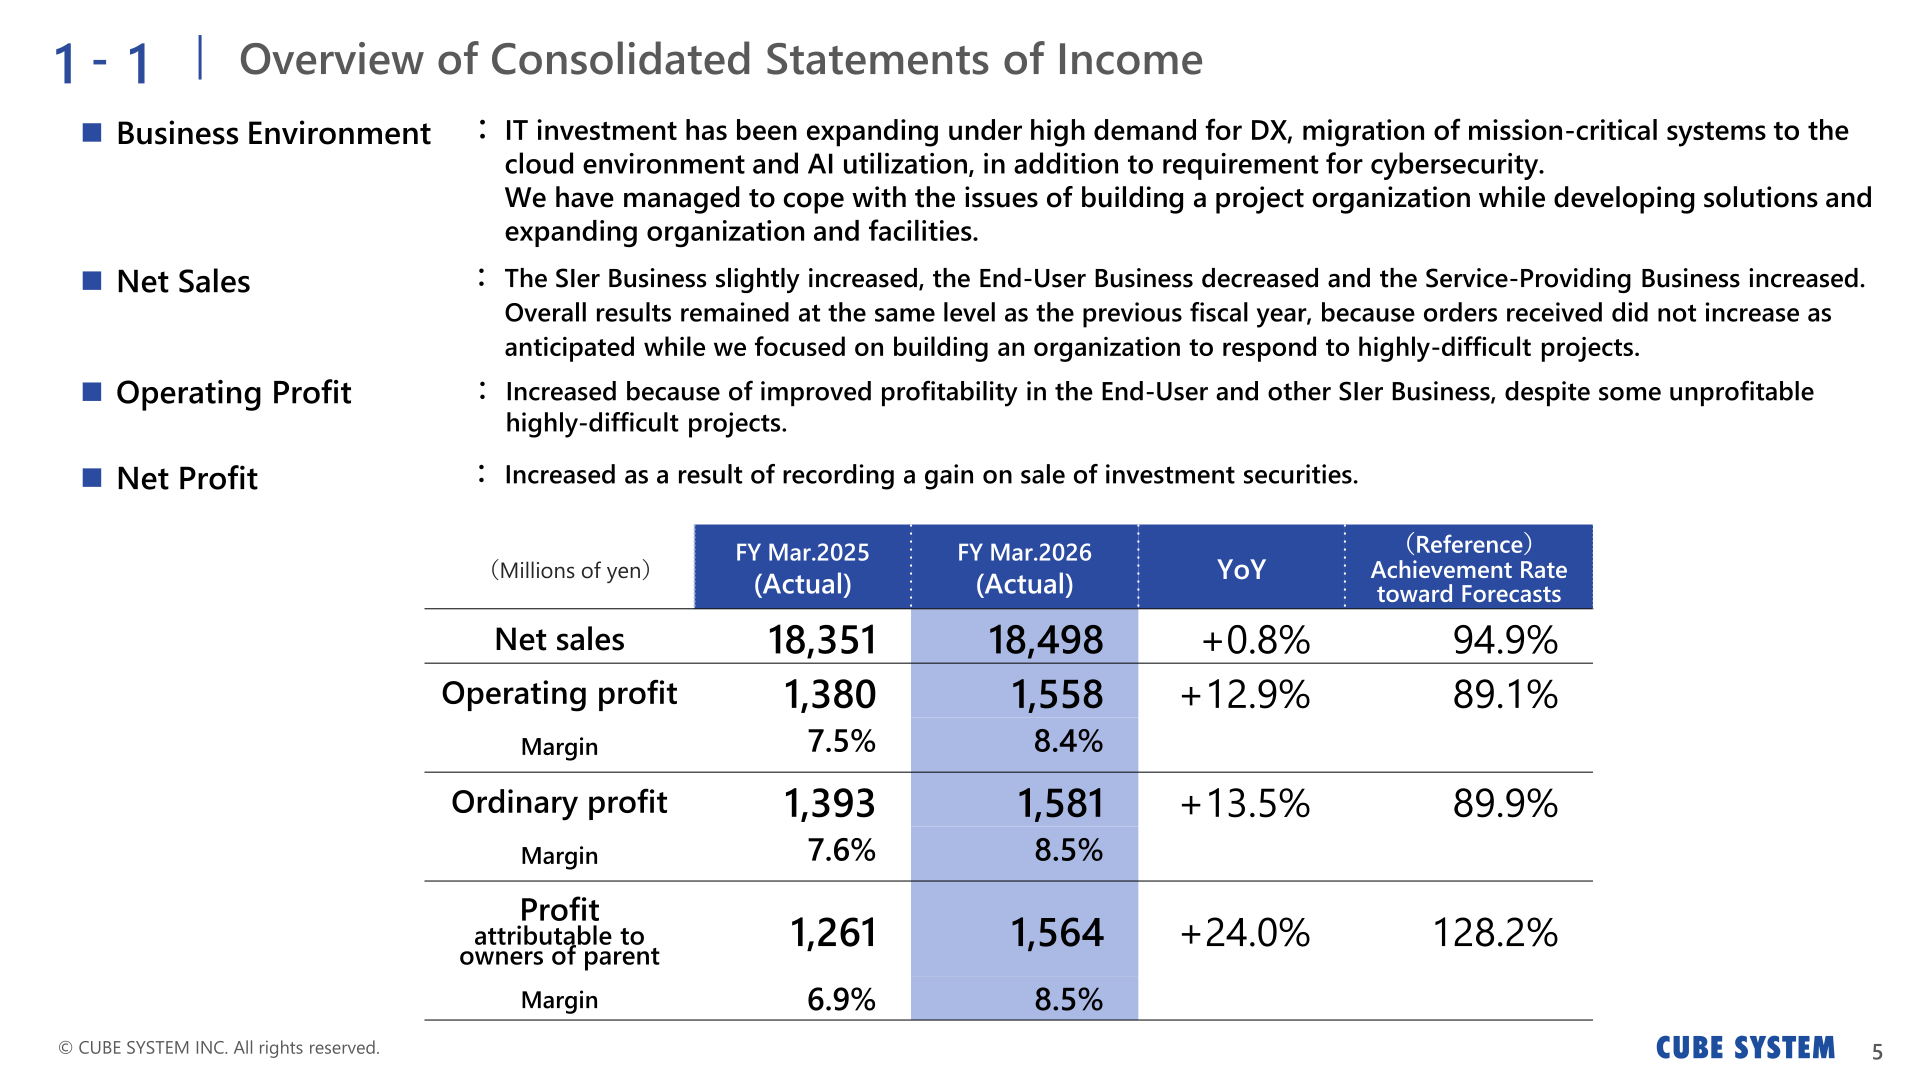
CUBE SYSTEM INC. reported net sales of 18,498 million yen for FY March 2026, up 0.8% year on year, with operating profit of 1,558 million yen (up 12.9%), ordinary profit of 1,581 million yen (up 13.5%) and profit attributable to owners of parent of 1,564 million yen (up 24.0%). ROE was 14.0%. The company attributes the profit growth to improved profitability in the End-User Business and the SI Business domain of the SIer Business and at overseas subsidiaries, and to lower personnel expenses following a change in the discount rate applied to retirement benefit obligations, partly offset by unprofitable highly-difficult projects and investment in development organization and facilities. Net profit rose as a result of recording a gain on sale of investment securities.
Consolidated Results (Full-Year Actual)
Net sales rose slightly: the SIer Business increased slightly, the End-User Business decreased and the Service-Providing Business increased, with overall results remaining at the same level as the previous fiscal year because orders received did not increase as anticipated while the company focused on building an organization to respond to highly-difficult projects. Against the company’s own forecasts, the achievement rate was 94.9% for net sales, 89.1% for operating profit, 89.9% for ordinary profit and 128.2% for profit attributable to owners of parent.
| Item (Millions of yen) | FY Mar.2025 (Actual) | FY Mar.2026 (Actual) | YoY | (Reference) Achievement Rate toward Forecasts |
|---|---|---|---|---|
| Net sales | 18,351 | 18,498 | +0.8% | 94.9% |
| Operating profit | 1,380 | 1,558 | +12.9% | 89.1% |
| Operating margin | 7.5% | 8.4% | ||
| Ordinary profit | 1,393 | 1,581 | +13.5% | 89.9% |
| Ordinary margin | 7.6% | 8.5% | ||
| Profit attributable to owners of parent | 1,261 | 1,564 | +24.0% | 128.2% |
| Profit margin attributable to owners of parent | 6.9% | 8.5% |
The company’s bridge of operating profit from FY Mar.2025 to FY Mar.2026 shows a year-on-year increase of 177 million yen, made up of positive factors of 216 million yen, 55 million yen and 193 million yen and negative factors of 151 million yen, 111 million yen and 24 million yen. Positive factors cited are improved profit margins in the End-User and SIer Businesses, improved profitability at overseas subsidiaries, and decreased personnel expenses resulting from a change in the discount rate applied to retirement benefit obligations. Negative factors are an increase in unprofitable highly-difficult projects, the expansion of development organization and facilities including the new Shinagawa Innovation Hub, and R&D investment.
Segment Results
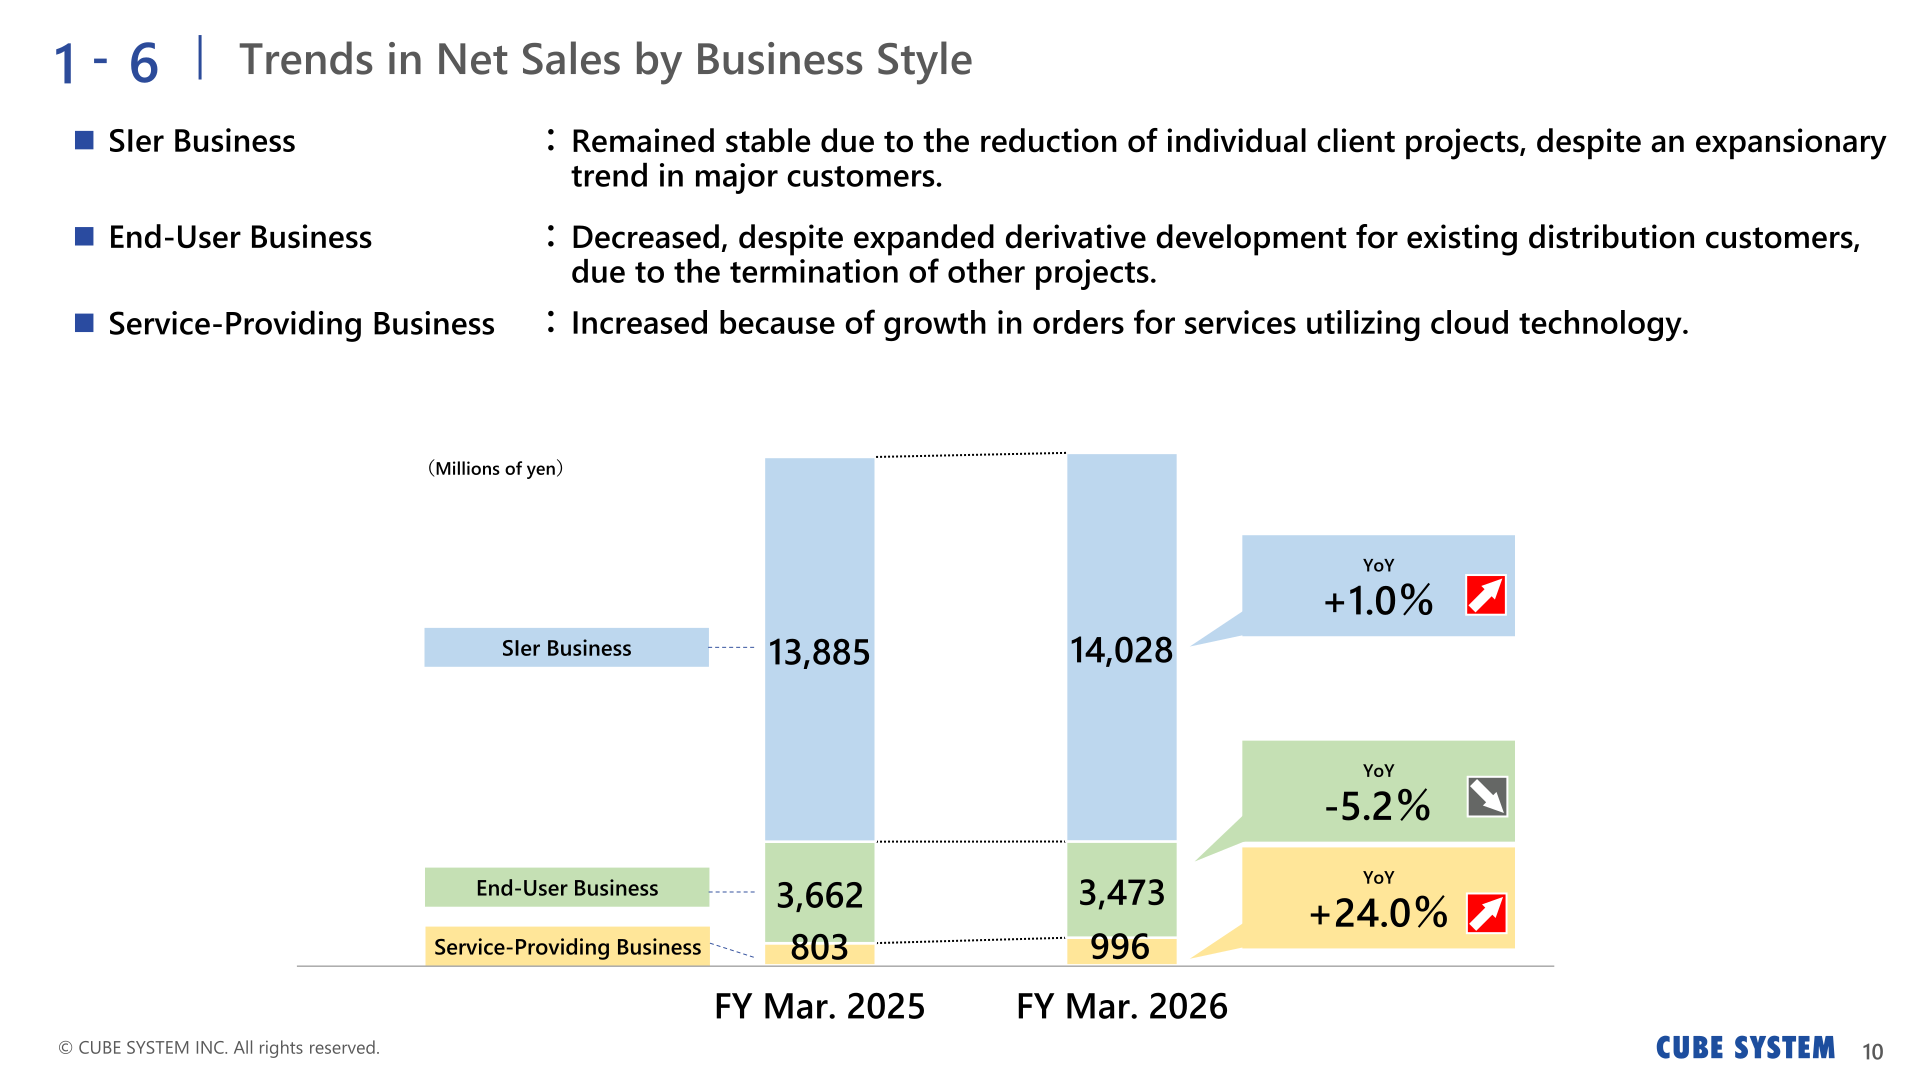
By business model, the Digital Business grew 62.7% to 1,315 million yen on consulting and advanced technology-related projects including AI, and the SI Business grew 23.9% to 7,731 million yen driven by the expansion of modernization projects, while the System Enhancement Business declined 16.4% to 9,451 million yen due to the impact of some unprofitable projects and a shift to the Digital and SI Business areas. By business style, the SIer Business rose 1.0% to 14,028 million yen, the End-User Business fell 5.2% to 3,473 million yen, and the Service-Providing Business rose 24.0% to 996 million yen on growth in orders for services utilizing cloud technology.
| Category | Net sales FY Mar.2025 (Millions of yen) | Net sales FY Mar.2026 (Millions of yen) | YoY (%) | Operating profit FY Mar.2025 (Millions of yen) | Operating profit FY Mar.2026 (Millions of yen) | YoY (%) |
|---|---|---|---|---|---|---|
| Digital Business | 808 | 1,315 | +62.7 | 15 | 117 | +675.7 |
| SI Business | 6,239 | 7,731 | +23.9 | 497 | 711 | +42.9 |
| System Enhancement Business | 11,303 | 9,451 | -16.4 | 867 | 729 | -16.0 |
| SIer Business | 13,885 | 14,028 | +1.0 | 1,045 | 998 | -4.5 |
| End-User Business | 3,662 | 3,473 | -5.2 | 283 | 565 | +99.2 |
| Service-Providing Business | 803 | 996 | +24.0 | 51 | -5 | – |
| Total | 18,351 | 18,498 | +0.8 | 1,380 | 1,558 | +12.9 |
By industry, Finance decreased 4.8% to 5,771 million yen on a decline in projects for megabanks, withdrawal from low-profit projects and the occurrence of unprofitable projects; Distribution was broadly flat at 3,014 million yen (-0.4%); Government agencies increased 25.5% to 2,432 million yen on projects for central government and administrative agencies; Transportation and Telecommunication decreased 11.9% to 2,030 million yen; Manufacturing increased 10.1% to 1,990 million yen; and Others increased 1.5% to 3,257 million yen.
Orders received for FY Mar.2026 were 18,555 million yen, up 61 million yen or 0.3% year on year, and the order backlog as of March 31, 2026 was 4,846 million yen, up 56 million yen or 1.2%.
Earnings Outlook (FY March 2027)
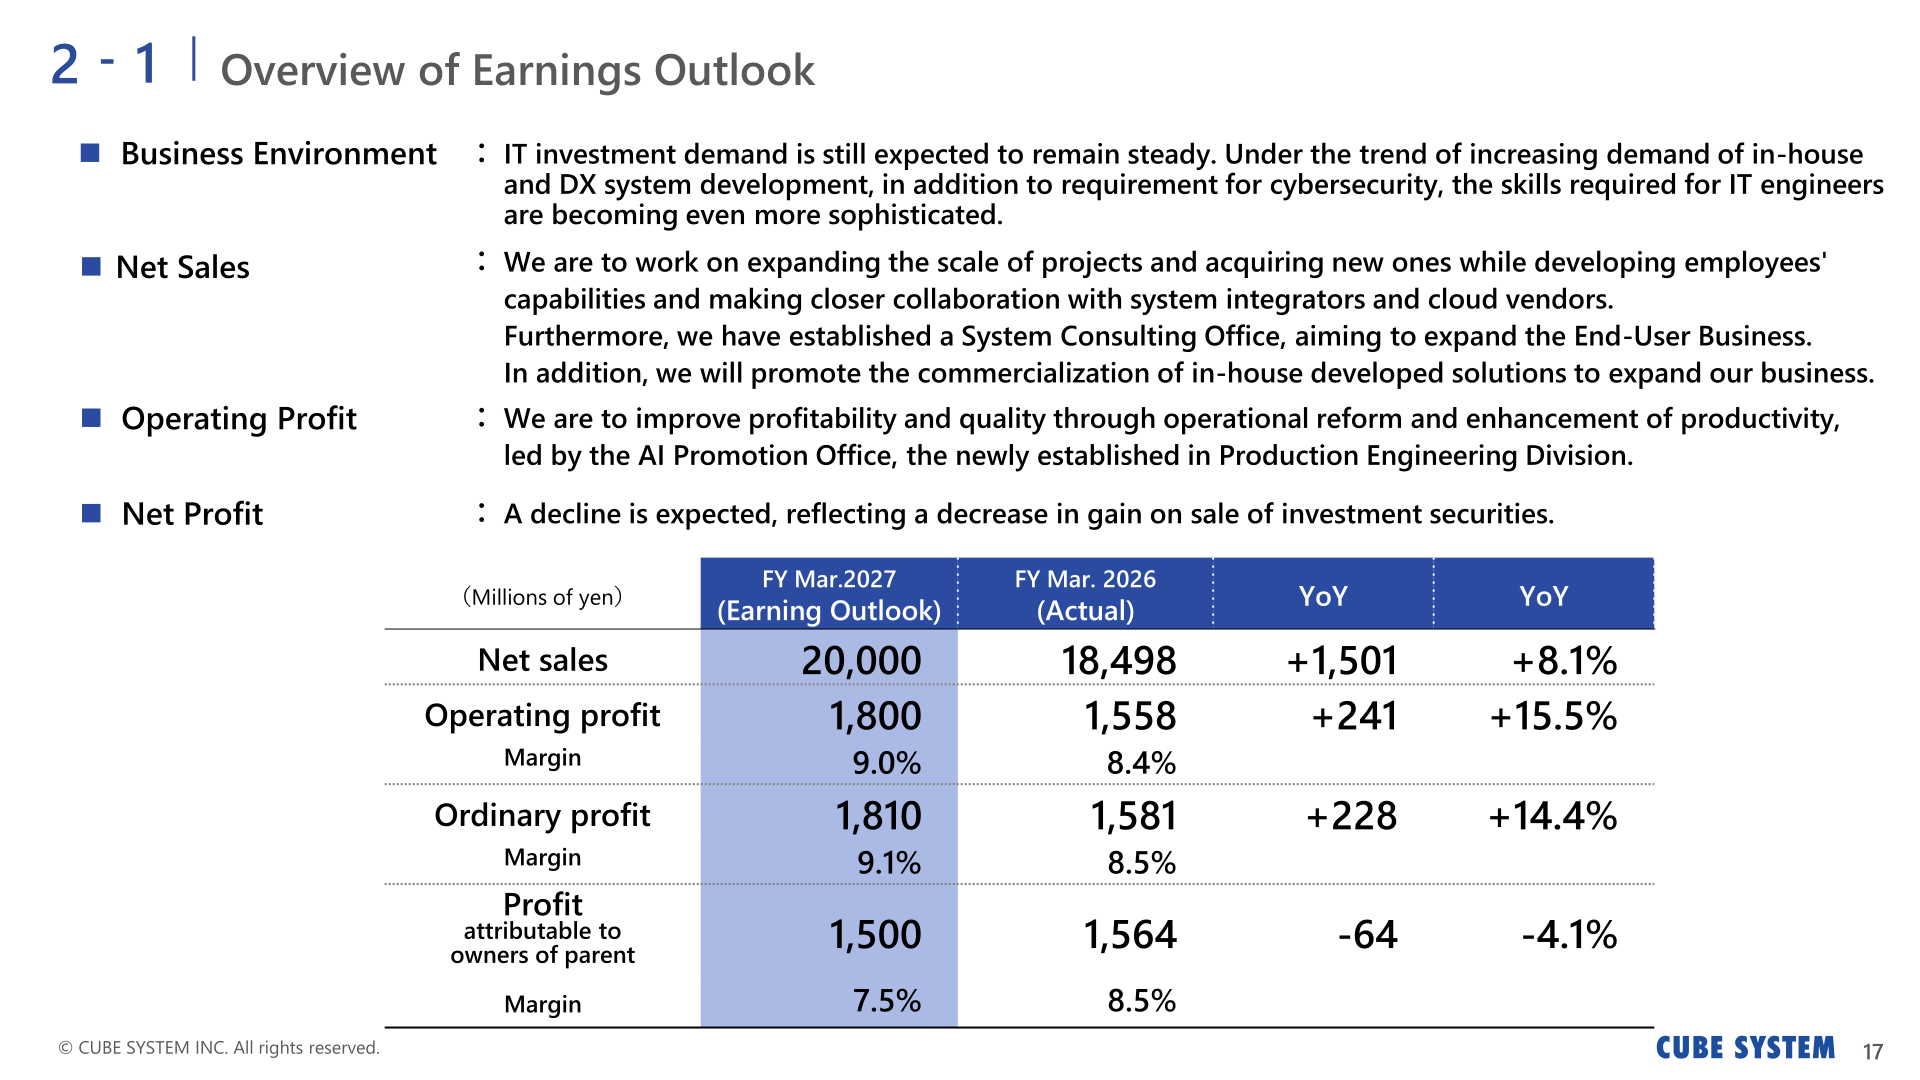
For FY March 2027 the company forecasts net sales of 20,000 million yen (up 1,501 million yen, or 8.1%), operating profit of 1,800 million yen (up 241 million yen, or 15.5%), ordinary profit of 1,810 million yen (up 228 million yen, or 14.4%) and profit attributable to owners of parent of 1,500 million yen (down 64 million yen, or 4.1%). The decline in net profit reflects a decrease in gain on sale of investment securities. The company says IT investment demand is still expected to remain steady and that it will work on expanding the scale of projects and acquiring new ones, having established a System Consulting Office to expand the End-User Business and an AI Promotion Office within the Production Engineering Division to improve profitability and quality.
| Item (Millions of yen) | FY Mar.2026 (Actual) | FY Mar.2027 (Earnings Outlook) | YoY | YoY (%) |
|---|---|---|---|---|
| Net sales | 18,498 | 20,000 | +1,501 | +8.1% |
| Operating profit | 1,558 | 1,800 | +241 | +15.5% |
| Operating margin | 8.4% | 9.0% | ||
| Ordinary profit | 1,581 | 1,810 | +228 | +14.4% |
| Ordinary margin | 8.5% | 9.1% | ||
| Profit attributable to owners of parent | 1,564 | 1,500 | -64 | -4.1% |
| Profit margin attributable to owners of parent | 8.5% | 7.5% |
By business style, the outlook calls for the SIer Business to grow 3.4% to 14,500 million yen, the End-User Business to grow 15.2% to 4,000 million yen and the Service-Providing Business to grow 50.6% to 1,500 million yen.
Shareholder Returns
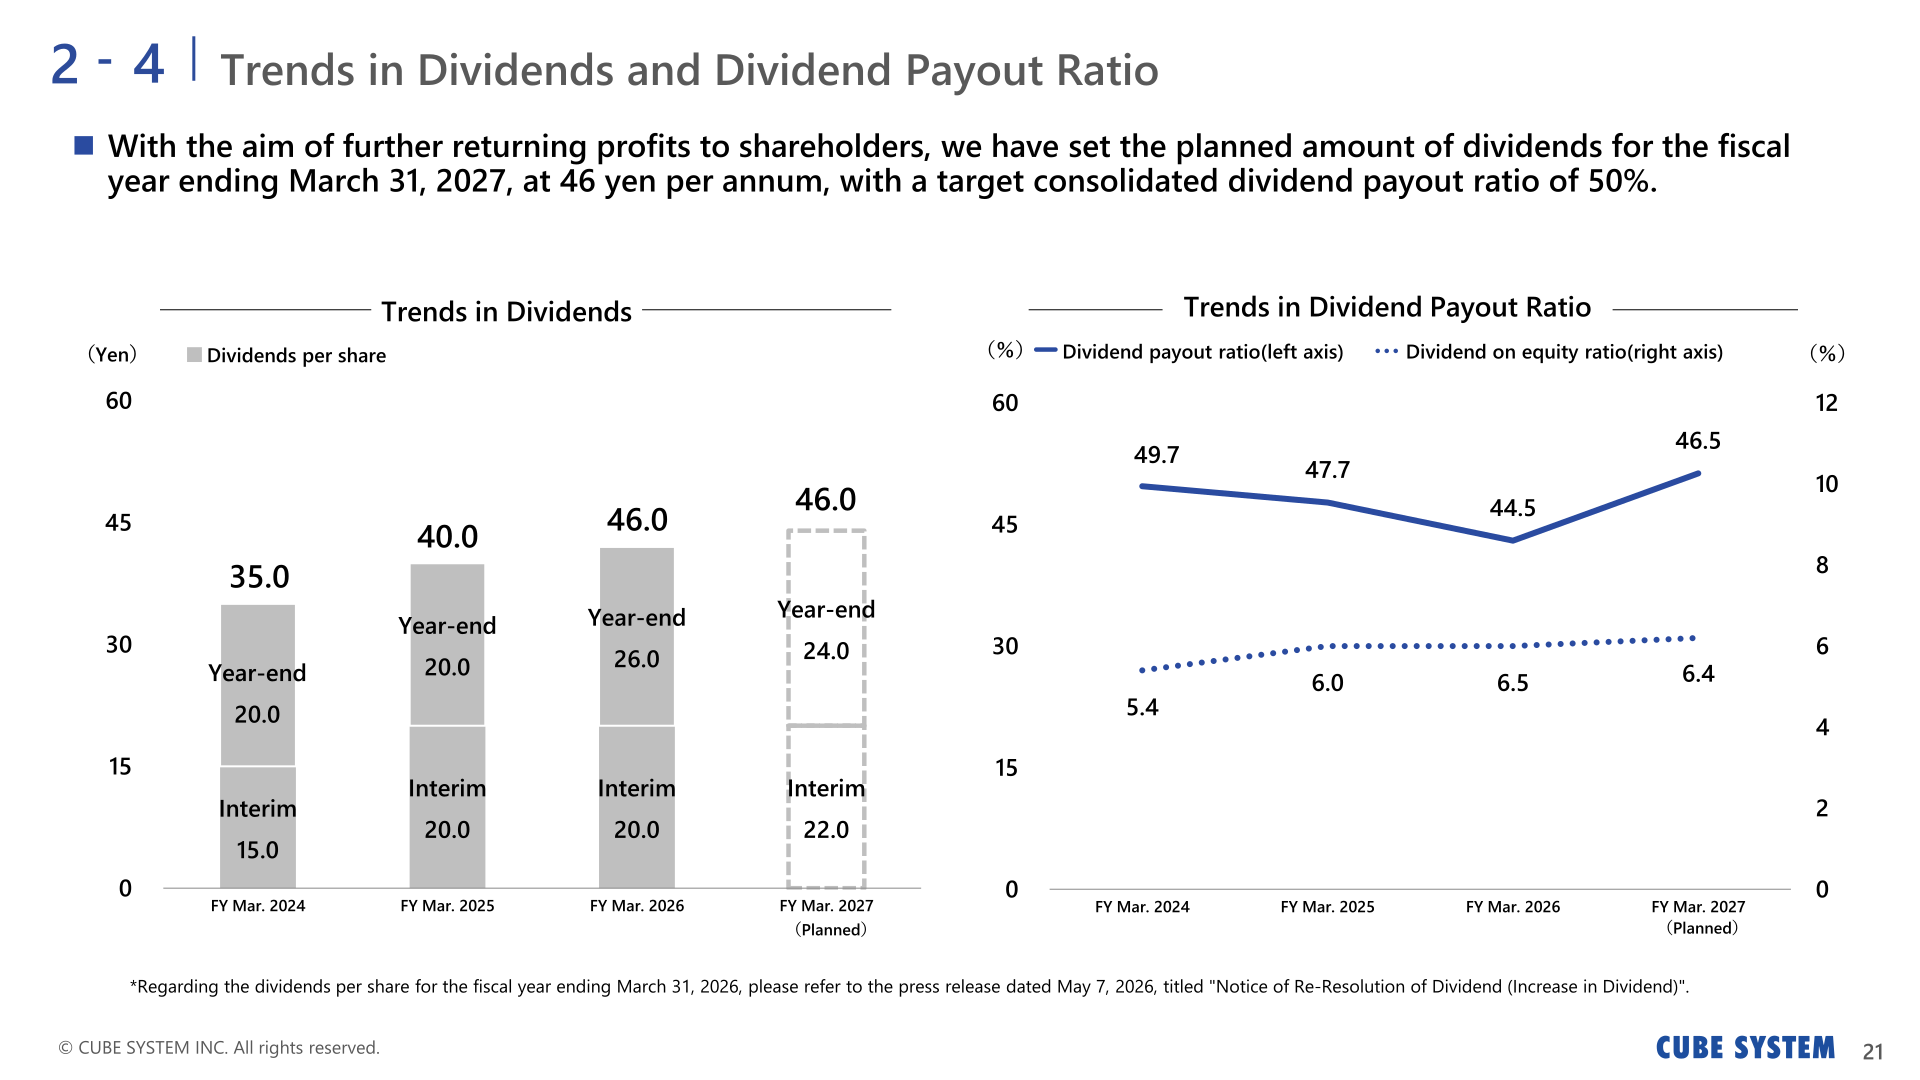
For FY Mar.2026 the annual dividend was 46.0 yen per share (interim 20.0 yen, year-end 26.0 yen), with a dividend payout ratio of 44.5%. The materials note that, with the aim of further returning profits to shareholders, the planned dividend for the fiscal year ending March 31, 2027 is set at 46 yen per annum, with a target consolidated dividend payout ratio of 50%; the plan is an interim dividend of 22.0 yen and a year-end dividend of 24.0 yen. Regarding the dividends per share for the fiscal year ending March 31, 2026, the materials direct readers to the press release dated May 7, 2026 titled “Notice of Re-Resolution of Dividend (Increase in Dividend).”
| Item | FY Mar.2024 | FY Mar.2025 | FY Mar.2026 | FY Mar.2027 (Planned) |
|---|---|---|---|---|
| Interim dividend (Yen) | 15.0 | 20.0 | 20.0 | 22.0 |
| Year-end dividend (Yen) | 20.0 | 20.0 | 26.0 | 24.0 |
| Annual dividend (Yen) | 35.0 | 40.0 | 46.0 | 46.0 |
| Dividend payout ratio (%) | 49.7 | 47.7 | 44.5 | 46.5 |
| Dividend on equity ratio (%) | 5.4 | 6.0 | 6.5 | 6.4 |
Balance Sheet and Cash Flows
Total assets as of March 31, 2026 were 14,901 million yen, up 535 million yen from a year earlier, with current assets up 1,089 million yen to 10,896 million yen on higher cash and deposits and accounts receivable – trade, and non-current assets down 554 million yen to 4,005 million yen following the sale of investment securities. Total liabilities were 3,496 million yen, up 5 million yen, and total net assets were 11,404 million yen, up 530 million yen. Cash flows from operating activities were 767 million yen (up 511 million yen), cash flows from investing activities were 371 million yen (up 440 million yen) on proceeds from the sale of investment securities, and cash flows from financing activities were -521 million yen (up 258 million yen). Cash and cash equivalents at the end of the period stood at 6,826 million yen, up 612 million yen. The equity ratio was 76.5%, net assets per share were 751.46 yen and earnings per share were 103.37 yen.
Full-Year Progress and Priority Measures
In the End-User Business the company reports that the number of new customers fell short of expectations despite strengthened proposal and sales capabilities, and it intends to expand into the consulting field and reinforce its sales platform. In the SIer Business, modernization lift projects proceeded smoothly as originally planned through collaboration with system integrators, and the company says it has steadily advanced its business model transformation toward a one-stop service covering upstream to downstream phases. In the Service-Providing Business, profitability grew significantly on the expansion of projects through value-added proposals to existing customers and improved productivity, and the company provides solution services addressing system migration and multi-cloud adoption in addition to OCVS (Oracle Cloud VMware Solution) implementation and operations.
On priority measures, the company opened the Shinagawa Innovation Hub, a development office with a capacity of 400, in September 2025; performance improvement of H•CUBiC, its service concept to support human capital management, was introduced to customer departments with full-scale services launched in April 2026; development of AI automated ordering-related solutions progressed and the service was launched in May 2026; and the company continued new-graduate hiring, with 70 in FY2025 and 61 in FY2026 as labelled in the materials, while planning to enhance retention measures. It also states that further enhancement of the organizational structure is required for highly-difficult projects.
Company Information
CUBE SYSTEM INC. was established on July 5, 1972 and is headquartered at Osaki Wiz Tower, 2-11-1 Osaki, Shinagawa-ku, Tokyo. Share capital is 1.4 billion yen, the representative is Representative Director Masahiro Nakanishi, and the shares are listed on the Prime Market of the Tokyo Stock Exchange. Net sales were 18.4 billion yen (FY March 2026 consolidated) and the total number of employees was 988 as of April 1, 2026 (consolidated).
This article is an analysis based on publicly available information and is not a recommendation to buy or sell any specific securities. Investment decisions are your own responsibility.
















