
This article is based on publicly available IR materials and is not a recommendation to buy or sell any specific securities.
Note: Open Up Group’s fiscal year ends June 30. The company labels the year ended June 30, 2026 as “FY2026” (FY26) and the year ended June 30, 2025 as “FY2025” (FY25); on this site that most recently completed fiscal year is classified as FY2025. All labels in the text, tables and segment data below follow the company’s own presentation.
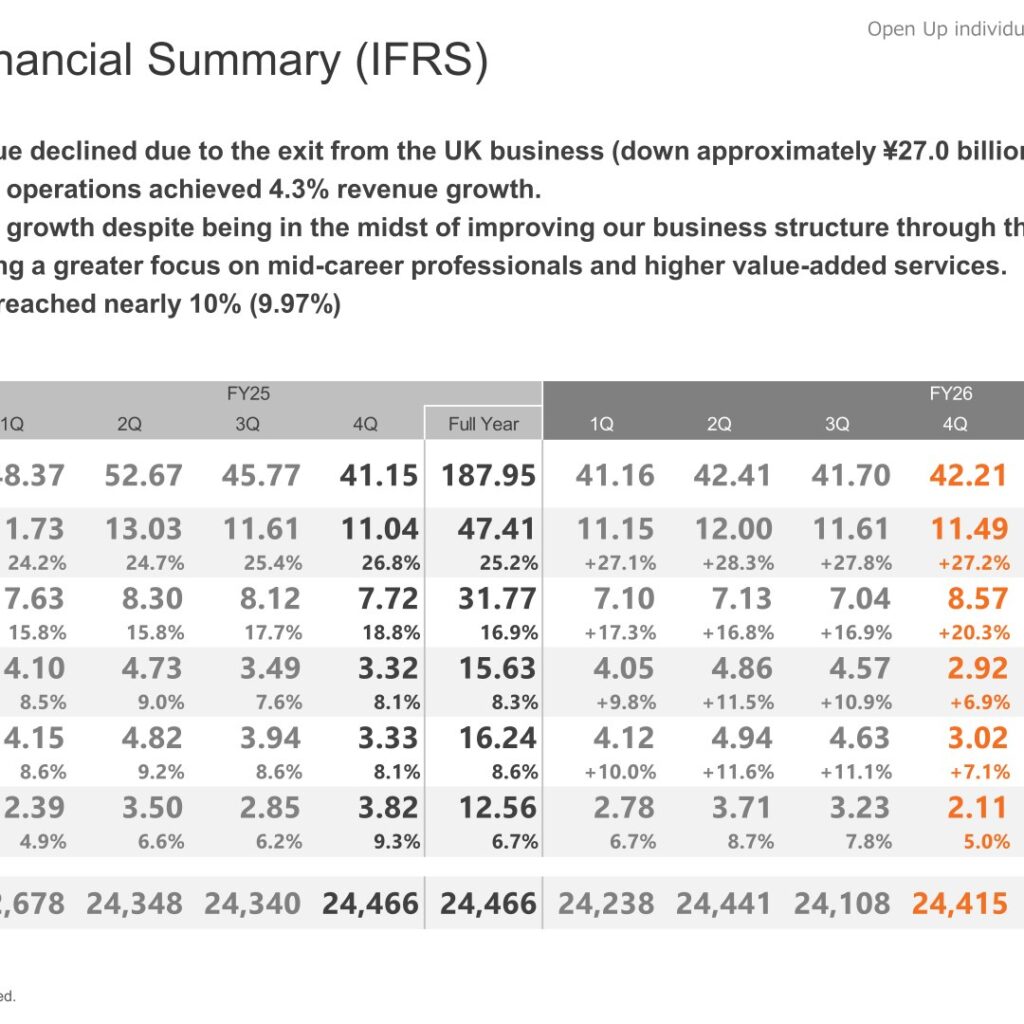
Open Up Group Inc. released its Q4 FY2026 financial results on August 7, 2026, covering the fiscal year ended June 30, 2026 under IFRS. Full-year revenue declined as the company exited the UK business (a decline of approximately ¥27.0 billion), while continuing operations delivered 4.3% revenue growth. Operating profit rose to ¥16.70 billion and the operating profit margin reached nearly 10% (9.97%), even as the group worked through a business model transformation toward mid-career professionals and higher value-added services. Net income declined to ¥11.83 billion.
Consolidated Results (Full-Year Actual)
Unit: billion yen (number of engineers: persons). The company reports under IFRS and presents both “business profit” and “operating profit”.
| Item | FY26 (Year ended June 2026) | FY25 (Year ended June 2025) | YoY |
|---|---|---|---|
| Revenue | 167.48 | 187.95 | ▲10.9% |
| Gross profit | 46.24 | 47.41 | ▲2.5% |
| Gross profit margin | 27.6% | 25.2% | — |
| SGA cost | 29.85 | 31.77 | ▲6.1% |
| SGA cost ratio | 17.8% | 16.9% | — |
| Business profit | 16.39 | 15.63 | +4.9% |
| Operating profit | 16.70 | 16.24 | +2.8% |
| Operating profit margin | 10.0% | 8.6% | — |
| Net income | 11.83 | 12.56 | ▲5.8% |
| Net income margin | 7.1% | 6.7% | — |
| Number of engineers | 24,415 | 24,466 | ▲0.2% |
Excluding the UK business, which was sold in March 2025 (Q3 FY2025), revenue rose from 160.60 billion yen to 167.48 billion yen (+4.3%), gross profit from 44.68 billion yen to 46.24 billion yen (+3.5%), business profit from 15.24 billion yen to 16.39 billion yen (+7.5%), and operating profit from 15.48 billion yen to 16.70 billion yen (+7.9%).
Segment Results
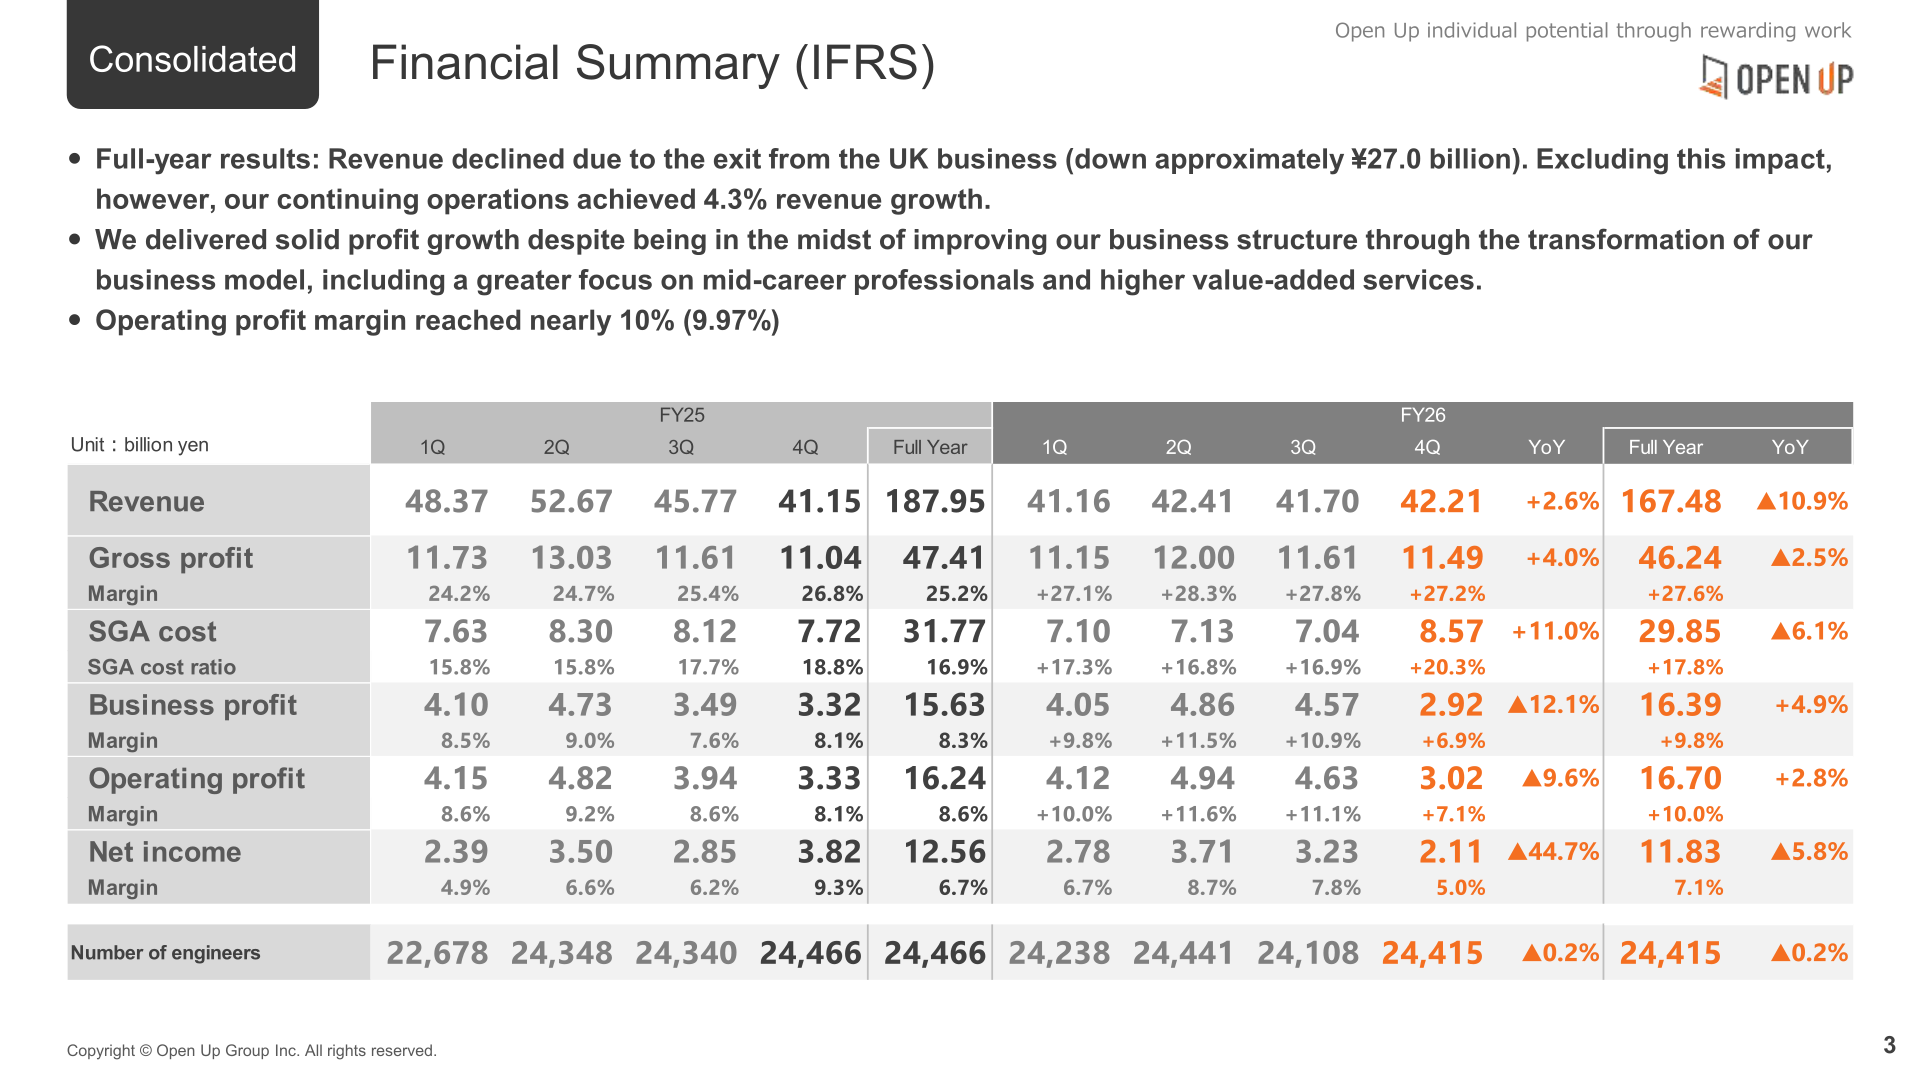
Progress in business structure improvement varied by segment. In Machinery & Electronics (M&E), revenue increased despite the ongoing transformation of the business model, supported by the contribution from Eisebu Holdings Co., Ltd. (approximately ¥1.7 billion) as well as solid performance in the existing business. IT Development revenue remained flat amid qualitative shifts driven by AI implementation, while IT Infrastructure revenue declined slightly during the sales organization restructuring. In Construction, full-year revenue increased with the contribution from IR Inc., although fourth-quarter revenue declined as the business continued its structural improvement initiatives.
| Segment | Metric | FY26 (Full Year) | FY25 (Full Year) | YoY |
|---|---|---|---|---|
| M&E | Revenue | 66.74 | 60.27 | +10.7% |
| M&E | Gross profit | 17.52 | 15.73 | +11.4% |
| M&E | Operating profit | 8.36 | 7.26 | +15.1% |
| M&E | Number of engineers | 9,494 | 8,911 | +6.5% |
| IT | Revenue | 40.92 | 41.28 | ▲0.9% |
| IT | Gross profit | 11.04 | 10.70 | +3.2% |
| IT | Operating profit | 4.10 | 3.76 | +9.1% |
| IT | Number of engineers | 6,325 | 6,648 | ▲4.9% |
| Construction | Revenue | 57.60 | 56.90 | +1.2% |
| Construction | Gross profit | 16.22 | 16.55 | ▲2.0% |
| Construction | Operating profit | 6.97 | 7.54 | ▲7.6% |
| Construction | Number of engineers | 8,596 | 8,907 | ▲3.5% |
| Overseas | Revenue | 0.77 | 27.83 | ▲97.2% |
| Overseas | Operating profit | 0.05 | 0.78 | ▲93.0% |
| Others/adjustment | Revenue | 1.45 | 1.67 | ▲13.2% |
| Others/adjustment | Operating profit | ▲2.79 | ▲3.10 | ▲9.9% |
| Consolidated total | Revenue | 167.48 | 187.95 | ▲10.9% |
| Consolidated total | Operating profit | 16.70 | 16.24 | +2.8% |
Unit: billion yen. The UK business was sold in March 2025 (Q3 FY2025), which accounts for the decline in the Overseas segment.
Full-Year Forecast for the Year Ending June 30, 2027
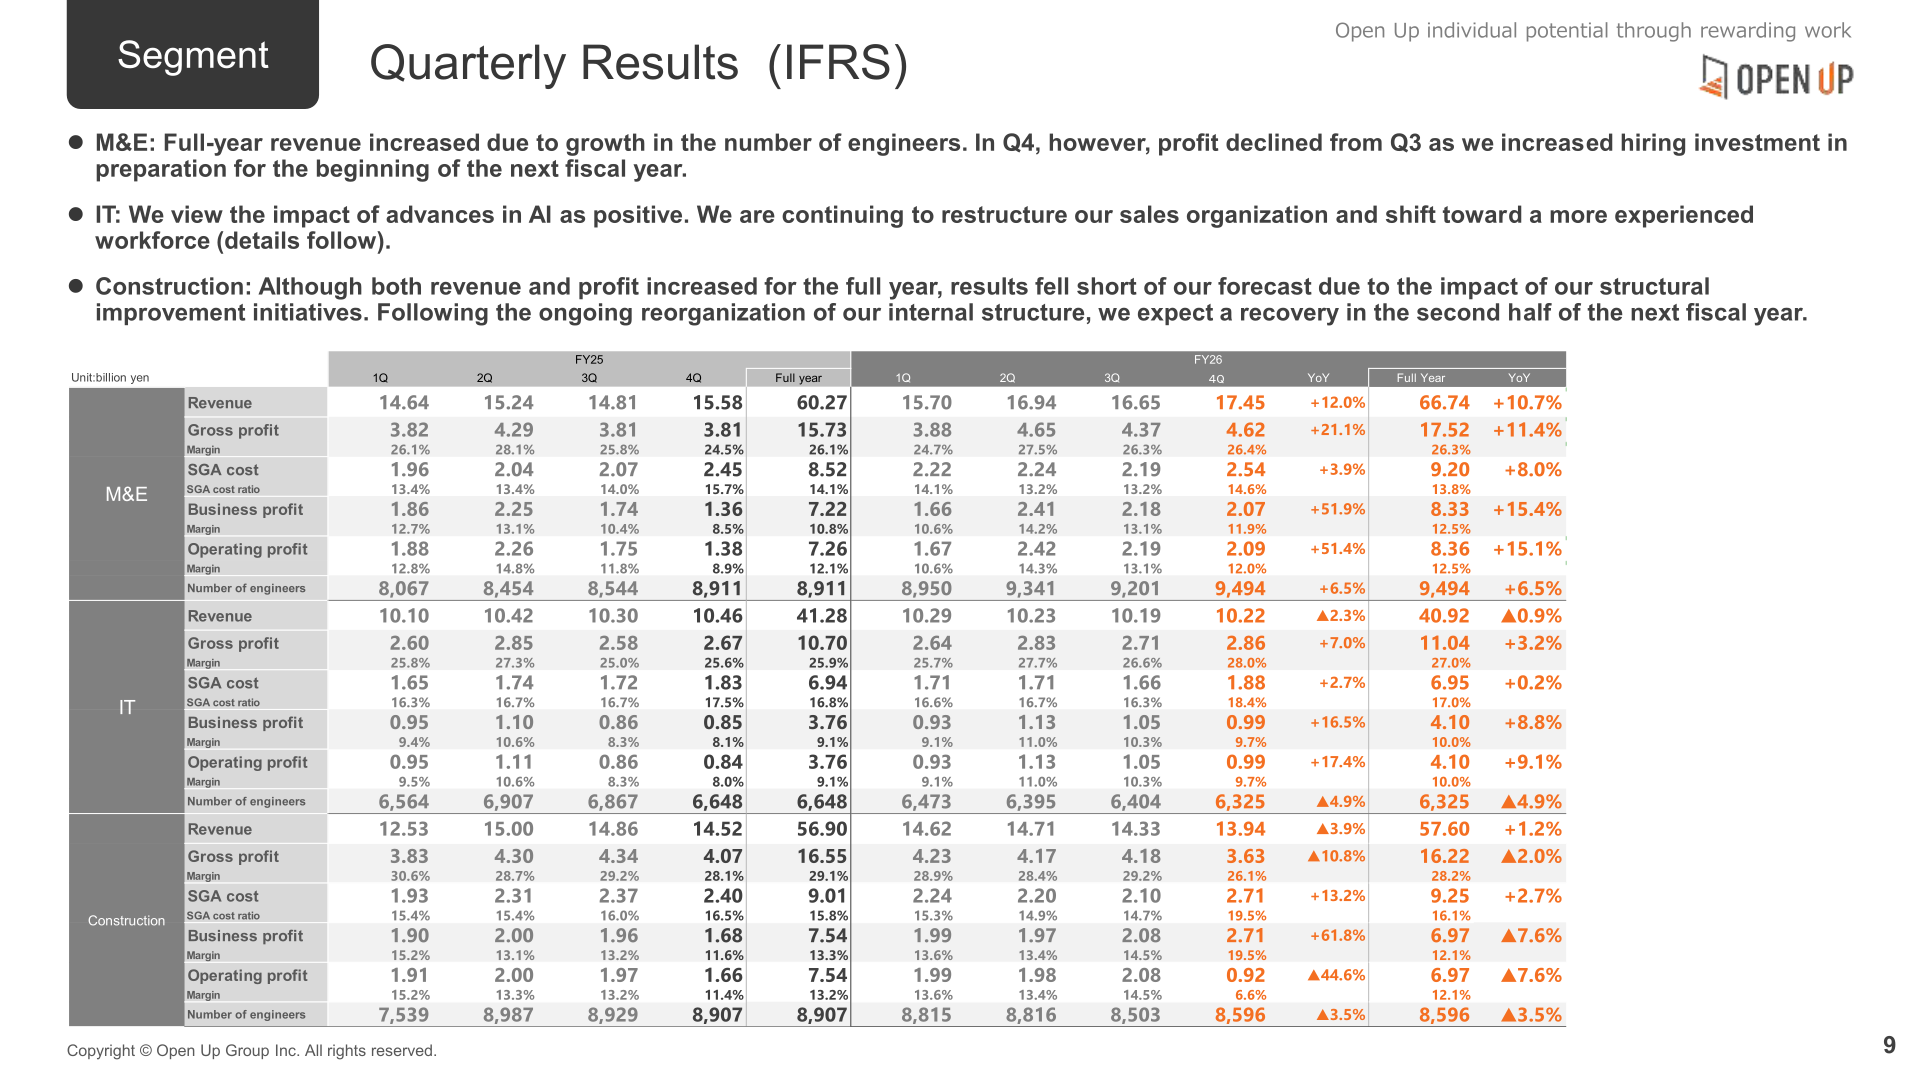
The company states that FY2026 marked the first year of its business model transformation and structural improvement initiatives, with the restructuring of the sales organization now nearly complete. For FY2027 it plans to balance growth investment with improved profitability. Assumptions disclosed for FY2027 are: hiring volume to increase, utilization rate to increase slightly, turnover rate to decline gradually, and unit price to rise.
| Item / Segment | FY27 Forecast | FY26 Full Year (Actual) | YoY |
|---|---|---|---|
| Consolidated — Revenue | 175.00 | 167.48 | +4.5% |
| Consolidated — Gross profit | 49.00 | 46.24 | +6.0% |
| Consolidated — SGA cost | 31.30 | 29.85 | +4.9% |
| Consolidated — Operating profit | 17.70 | 16.70 | +6.0% |
| Consolidated — Operating profit margin | 10.1% | 10.0% | — |
| Consolidated — Net income | 12.30 | 11.83 | +4.0% |
| Consolidated — Number of engineers | 25,000 | 24,415 | +2.4% |
| M&E — Revenue | 70.50 | 66.74 | +5.6% |
| M&E — Operating profit | 9.10 | 8.36 | +8.8% |
| IT — Revenue | 42.60 | 40.92 | +4.1% |
| IT — Operating profit | 4.60 | 4.10 | +12.2% |
| Construction — Revenue | 59.50 | 57.60 | +3.3% |
| Construction — Operating profit | 7.90 | 6.97 | +13.4% |
Unit: billion yen (number of engineers: persons). The increase in the number of engineers is shown as +585.
Shareholder Returns
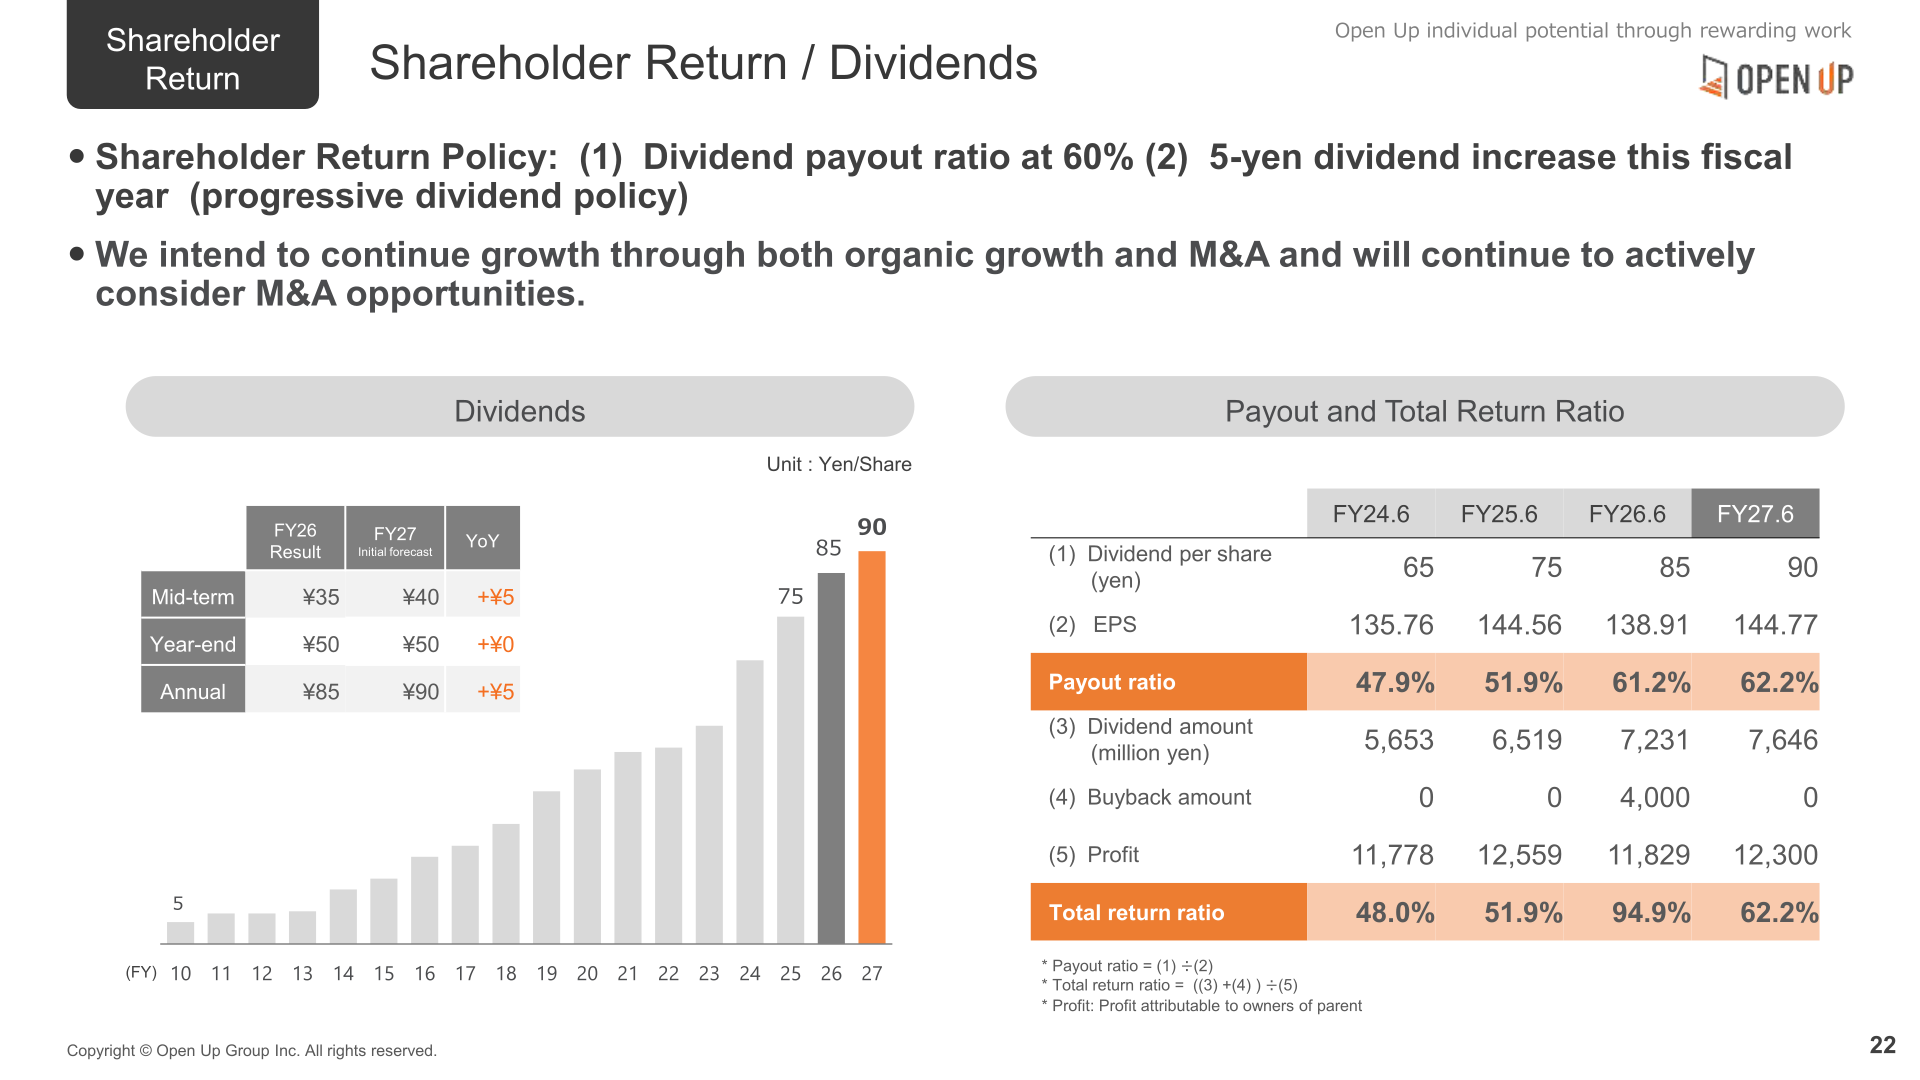
The shareholder return policy is stated as (1) a dividend payout ratio of 60% and (2) a 5-yen dividend increase this fiscal year under a progressive dividend policy. For FY26 the annual dividend was ¥85 (mid-term ¥35, year-end ¥50); the FY27 initial forecast is an annual dividend of ¥90 (mid-term ¥40, year-end ¥50), an increase of ¥5. The company states it intends to continue growth through both organic growth and M&A and will continue to actively consider M&A opportunities.
| Item | FY24.6 | FY25.6 | FY26.6 | FY27.6 |
|---|---|---|---|---|
| Dividend per share (yen) | 65 | 75 | 85 | 90 |
| EPS | 135.76 | 144.56 | 138.91 | 144.77 |
| Payout ratio | 47.9% | 51.9% | 61.2% | 62.2% |
| Dividend amount (million yen) | 5,653 | 6,519 | 7,231 | 7,646 |
| Buyback amount (million yen) | 0 | 0 | 4,000 | 0 |
| Profit (million yen) | 11,778 | 12,559 | 11,829 | 12,300 |
| Total return ratio | 48.0% | 51.9% | 94.9% | 62.2% |
Payout ratio is calculated as dividend per share divided by EPS; total return ratio as (dividend amount + buyback amount) divided by profit attributable to owners of parent.
Financial Position
Total assets stood at 129.40 billion yen at the end of FY26 against 122.70 billion yen a year earlier (+5.5%), with equity at 80.29 billion yen (+1.7%). Goodwill increased to 59.37 billion yen (+2.1%) following the acquisition of Eisebu in October 2025, while interest-bearing liabilities rose to 9.98 billion yen (+98.5%) and cash and cash equivalents to 23.19 billion yen (+13.9%). The company discloses net cash of 13.2 billion yen, a D/E ratio of 0.48x, simplified invested capital of 90.2 billion yen, ROE of 15.3%, simplified ROIC of 13.6% and WACC of 4.6%.
Medium-Term Management Policy
Open Up Group presents FY2028 targets of revenue of ¥200 billion, operating profit of ¥20 billion or above, and an operating profit margin of 10% or above. Toward those targets the company lists three initiatives: business development aligned with AI trends, investment in AI agents, and organizational restructuring to optimize the group as a whole, including the establishment of a Business Transformation Promotion Department. In FY2026 it completed the development and deployment of AI agents for the recruitment process and the sales process, and it launched the “OPS Orchestra” solution, generating approximately ¥0.5 billion in revenue including peripheral services.
This article is an analysis based on publicly available information and is not a recommendation to buy or sell any specific securities. Investment decisions are your own responsibility.
















