
This article is based on publicly available IR materials and is not a recommendation to buy or sell any specific securities.
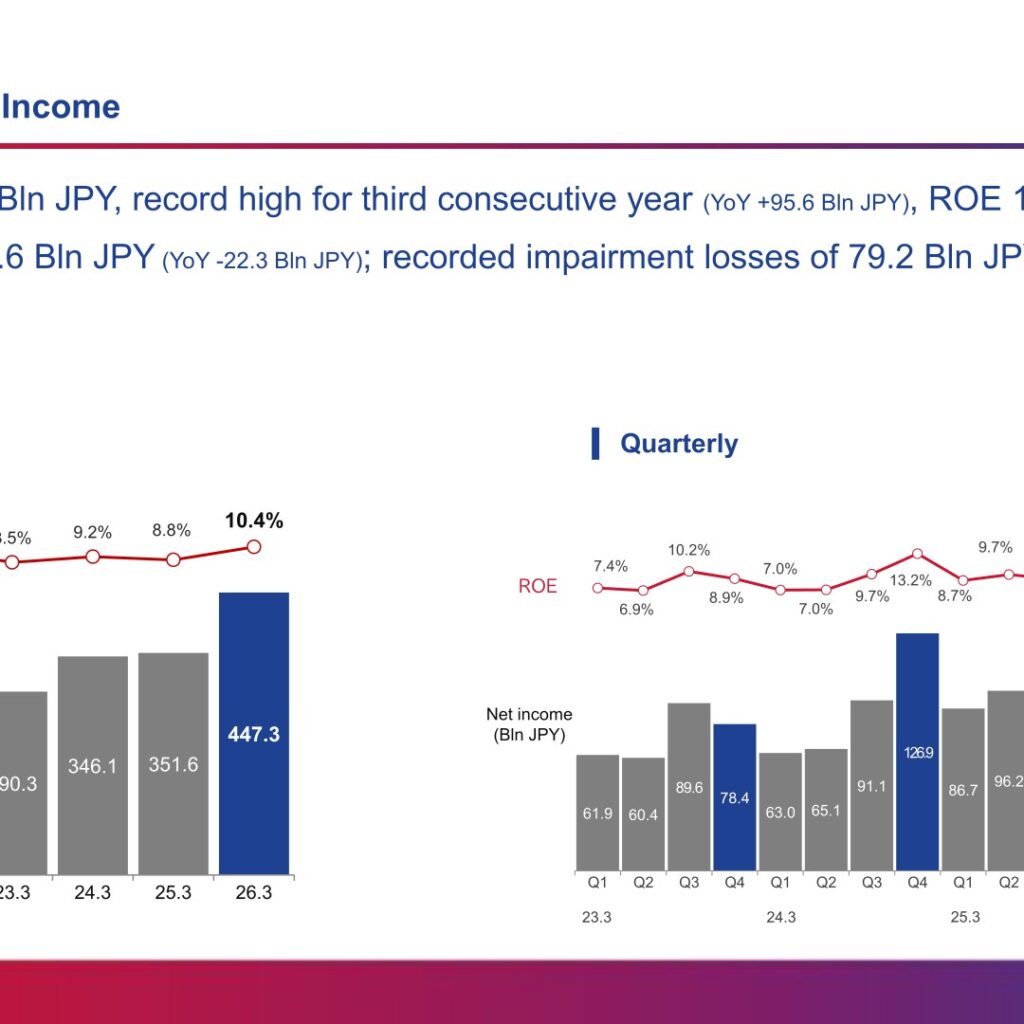
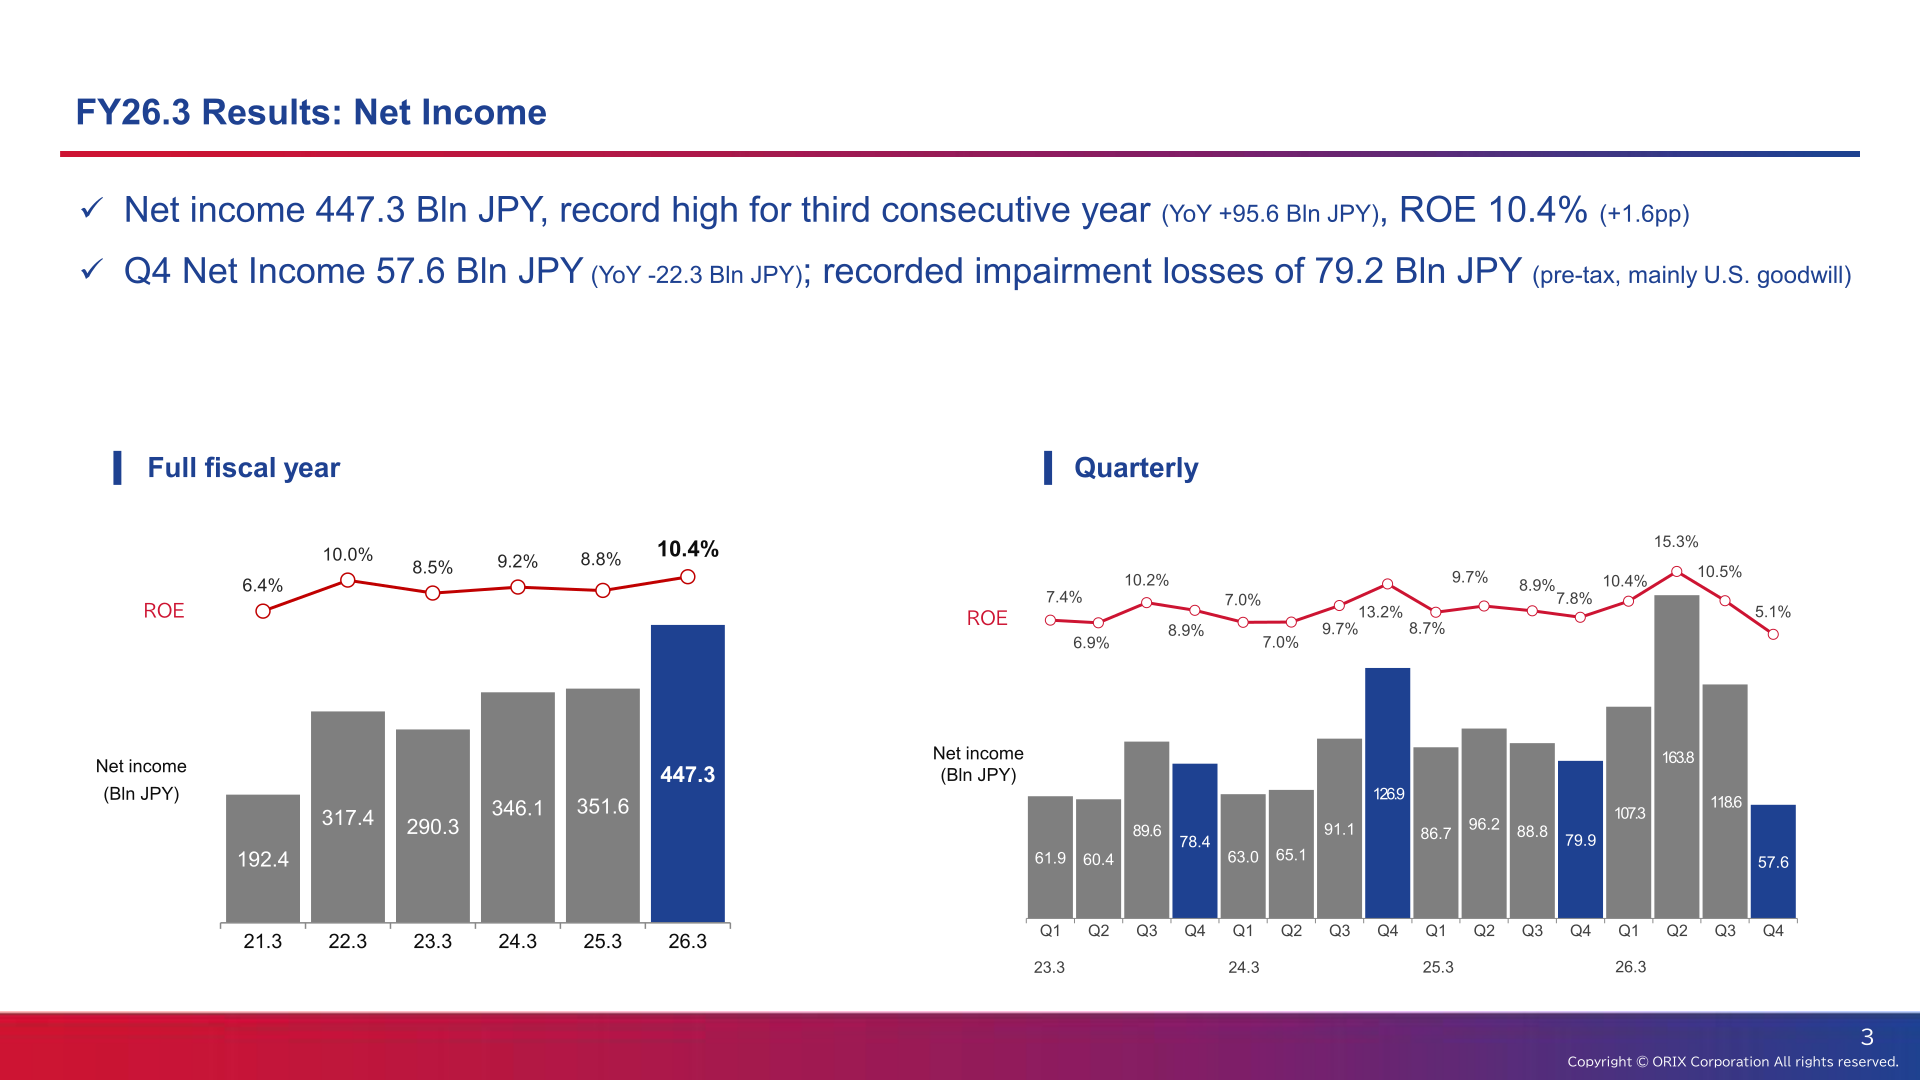
ORIX Corporation reported net income of 447.3 Bln JPY for FY2025 (fiscal year ended March 31, 2026), a record high for the third consecutive year (YoY +95.6 Bln JPY, +27%) and 7.3 Bln JPY (+2%) above the full-year forecast. ROE rose to 10.4%, up 1.6 percentage points year on year. Pre-tax profits grew 44% YoY to 691.4 Bln JPY, with all three business categories — Finance, Operation, and Investments — posting profit growth, led by gains from the partial sale of the Greenko stake and strong contributions from private equity investees such as Toshiba. Q4 net income was 57.6 Bln JPY (YoY -22.3 Bln JPY), reflecting 79.2 Bln JPY of pre-tax impairment losses, mainly related to U.S. goodwill.
Consolidated Results (Full-Year Actual)
Segment profits for FY2025 rose 35% YoY to 732.6 Bln JPY, and pre-tax profits rose 44% YoY to 691.4 Bln JPY, with all three business categories seeing profit growth. Finance category growth was mainly driven by higher investment income in Insurance and higher Corporate Financial Services fees. Operation benefited from strong inbound tourism-related businesses, solid performance at Rentec, Auto, and Ships, and investment gains from Canara Robeco and the Zeeklite sale. Investments profits were driven primarily by gains from the Greenko stake sale, gains from large real estate sales, and earnings and valuation gains from PE investees such as Toshiba. Total assets rose to 18,002.8 Bln JPY at end-FY2025 from 16,866.3 Bln JPY at end-FY2024 (+1,136.5 Bln JPY), and shareholders’ equity rose to 4.5 Tln JPY from 4.1 Tln JPY.
| Item | FY2025 (FY26.3) | FY2024 (FY25.3) | Change |
|---|---|---|---|
| Segment Profits | 732.6 Bln JPY | 544.7 Bln JPY | +187.9 Bln JPY (+35%) |
| Pre-tax Profits | 691.4 Bln JPY | 480.5 Bln JPY | +211.0 Bln JPY (+44%) |
| Net Income | 447.3 Bln JPY | 351.6 Bln JPY | +95.6 Bln JPY (+27%) |
| ROE | 10.4% | 8.8% | +1.6pp |
| Total Assets (End of Period) | 18,002.8 Bln JPY | 16,866.3 Bln JPY | +1,136.5 Bln JPY |
| Shareholders’ Equity (End of Period) | 4.5 Tln JPY | 4.1 Tln JPY | – |
| Employed Capital Ratio (End of Period) | 86% | 91% | -5pp |
Segment Results
ORIX manages its business through three consolidated categories — Finance, Operation, and Investments. In FY2025, Finance segment profit was 189.2 Bln JPY with ROE unchanged YoY at 8.2%; Operation segment profit was 237.1 Bln JPY with ROE up 0.4pp to 13.9%; and Investments segment profit was 306.3 Bln JPY with ROE up 6.2pp to 13.6%, primarily reflecting the Greenko stake sale (gain on sale and valuation gains totaling 95.0 Bln JPY).
| Category | Segment Profit FY2025 (Bln JPY) | ROE FY2025 | ROE Change (YoY, pp) | Segment Assets FY2025 (Tln JPY) | Segment Assets FY2024 (Tln JPY) | ROA FY2025 |
|---|---|---|---|---|---|---|
| Finance | 189.2 | 8.2% | ±0.0pp | 9.3 | 9.0 | 1.5% |
| Operation | 237.1 | 13.9% | +0.4pp | 5.3 | 4.7 | 3.5% |
| Investments | 306.3 | 13.6% | +6.2pp | 2.8 | 2.7 | 7.9% |
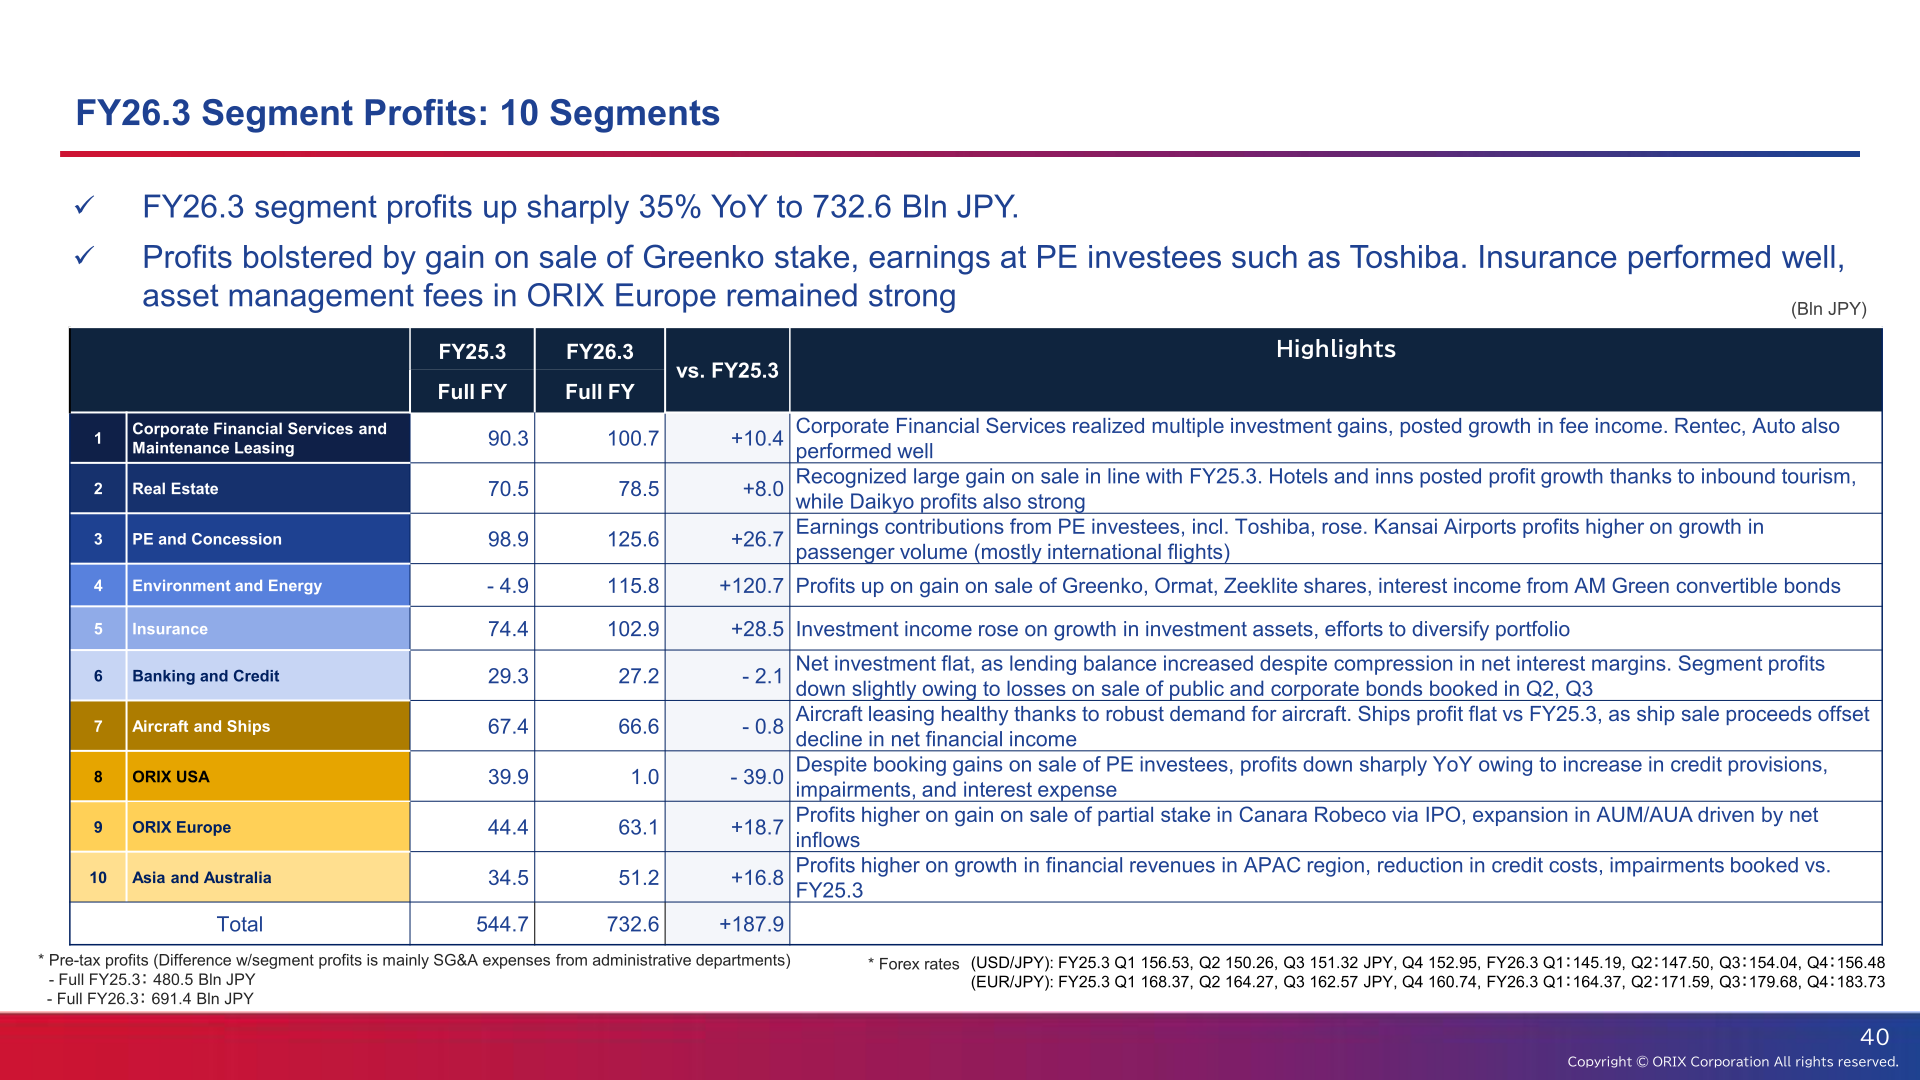
Within the 10 business segments, Environment and Energy swung to a profit of 115.8 Bln JPY from a loss of 4.9 Bln JPY (+120.7 Bln JPY) on gains from the sale of Greenko, Ormat, and Zeeklite stakes plus interest income from AM Green convertible notes. Insurance profit rose to 102.9 Bln JPY (+28.5 Bln JPY) on higher investment income from growth in investment assets and portfolio diversification. PE and Concession profit rose to 125.6 Bln JPY (+26.7 Bln JPY) on earnings contributions from PE investees including Toshiba and higher Kansai Airports passenger volumes. ORIX Europe profit rose to 63.1 Bln JPY (+18.7 Bln JPY) on the gain from the partial-stake IPO sale of Canara Robeco and AUM/AUA growth. ORIX USA profit fell sharply to 1.0 Bln JPY from 39.9 Bln JPY (-39.0 Bln JPY) due to higher credit provisions, impairments, and interest expense amid the phased exit from its PE business.
| Segment | FY2025 (FY26.3) Profit | FY2024 (FY25.3) Profit | Change |
|---|---|---|---|
| Corporate Financial Services and Maintenance Leasing | 100.7 Bln JPY | 90.3 Bln JPY | +10.4 Bln JPY |
| Real Estate | 78.5 Bln JPY | 70.5 Bln JPY | +8.0 Bln JPY |
| PE and Concession | 125.6 Bln JPY | 98.9 Bln JPY | +26.7 Bln JPY |
| Environment and Energy | 115.8 Bln JPY | -4.9 Bln JPY | +120.7 Bln JPY |
| Insurance | 102.9 Bln JPY | 74.4 Bln JPY | +28.5 Bln JPY |
| Banking and Credit | 27.2 Bln JPY | 29.3 Bln JPY | -2.1 Bln JPY |
| Aircraft and Ships | 66.6 Bln JPY | 67.4 Bln JPY | -0.8 Bln JPY |
| ORIX USA | 1.0 Bln JPY | 39.9 Bln JPY | -39.0 Bln JPY |
| ORIX Europe | 63.1 Bln JPY | 44.4 Bln JPY | +18.7 Bln JPY |
| Asia and Australia | 51.2 Bln JPY | 34.5 Bln JPY | +16.8 Bln JPY |
| Total (10 Segments) | 732.6 Bln JPY | 544.7 Bln JPY | +187.9 Bln JPY |
FY2026 Forecast
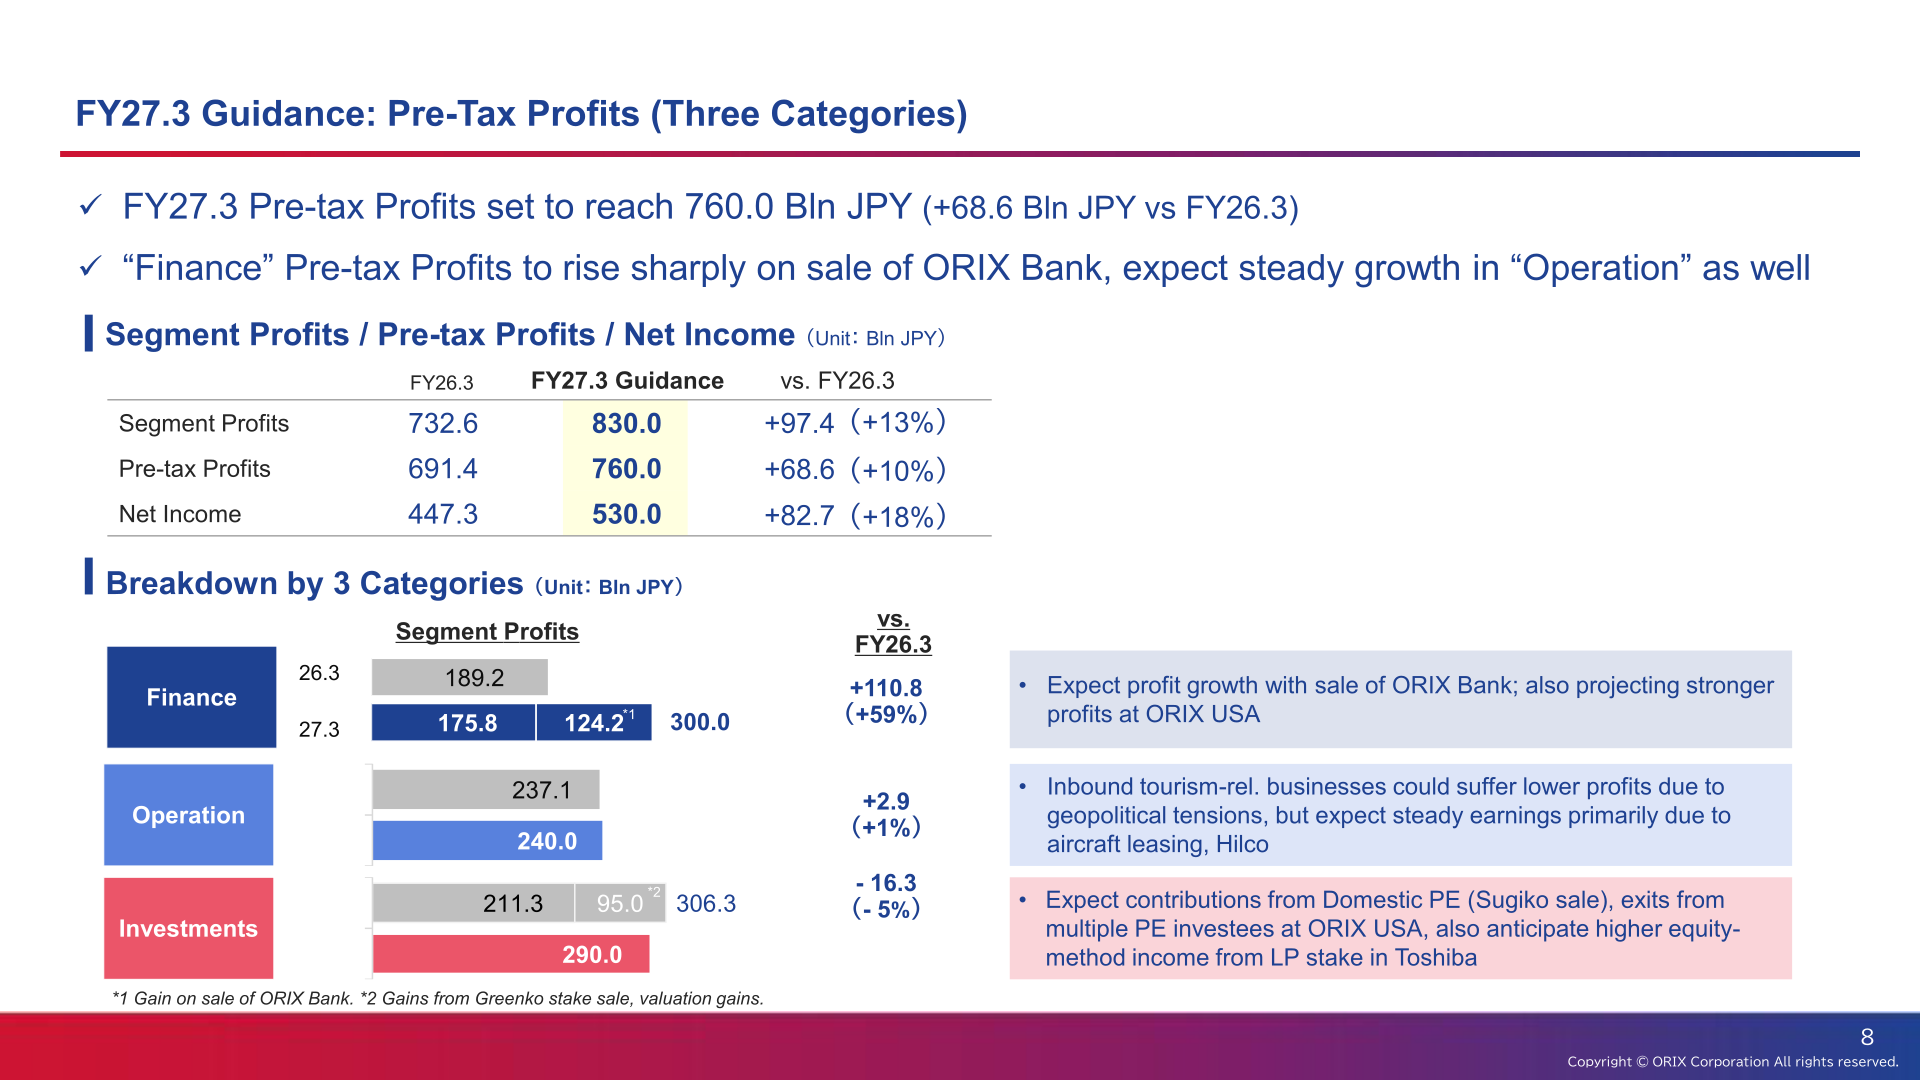
ORIX targets net income of 530.0 Bln JPY for FY2026 (FY27.3), up 82.7 Bln JPY (+18%) YoY, with ROE guided to improve to 11.7%. Pre-tax profits are guided at 760.0 Bln JPY (+68.6 Bln JPY, +10%) and segment profits at 830.0 Bln JPY (+97.4 Bln JPY, +13%). By category, Finance segment profit is guided to rise sharply to 300.0 Bln JPY (+110.8 Bln JPY, +59%), primarily reflecting the planned sale of ORIX Bank (agreement signed with Daiwa Securities Group in April 2026; sale planned to complete by October 2026). Operation segment profit is guided to grow modestly to 240.0 Bln JPY (+2.9 Bln JPY, +1%). Investments segment profit is guided to decline to 290.0 Bln JPY (-16.3 Bln JPY, -5%), reflecting the absence of one-off gains such as the FY2025 Greenko stake sale.
| Item | FY2026 Guidance (FY27.3) | FY2025 Actual (FY26.3) | Change |
|---|---|---|---|
| Segment Profits (3 Categories Total) | 830.0 Bln JPY | 732.6 Bln JPY | +97.4 Bln JPY (+13%) |
| Pre-tax Profits | 760.0 Bln JPY | 691.4 Bln JPY | +68.6 Bln JPY (+10%) |
| Net Income | 530.0 Bln JPY | 447.3 Bln JPY | +82.7 Bln JPY (+18%) |
| ROE | 11.7% | 10.4% | – |
| Finance (Segment Profit) | 300.0 Bln JPY | 189.2 Bln JPY | +110.8 Bln JPY (+59%) |
| Operation (Segment Profit) | 240.0 Bln JPY | 237.1 Bln JPY | +2.9 Bln JPY (+1%) |
| Investments (Segment Profit) | 290.0 Bln JPY | 306.3 Bln JPY | -16.3 Bln JPY (-5%) |
Shareholder Returns
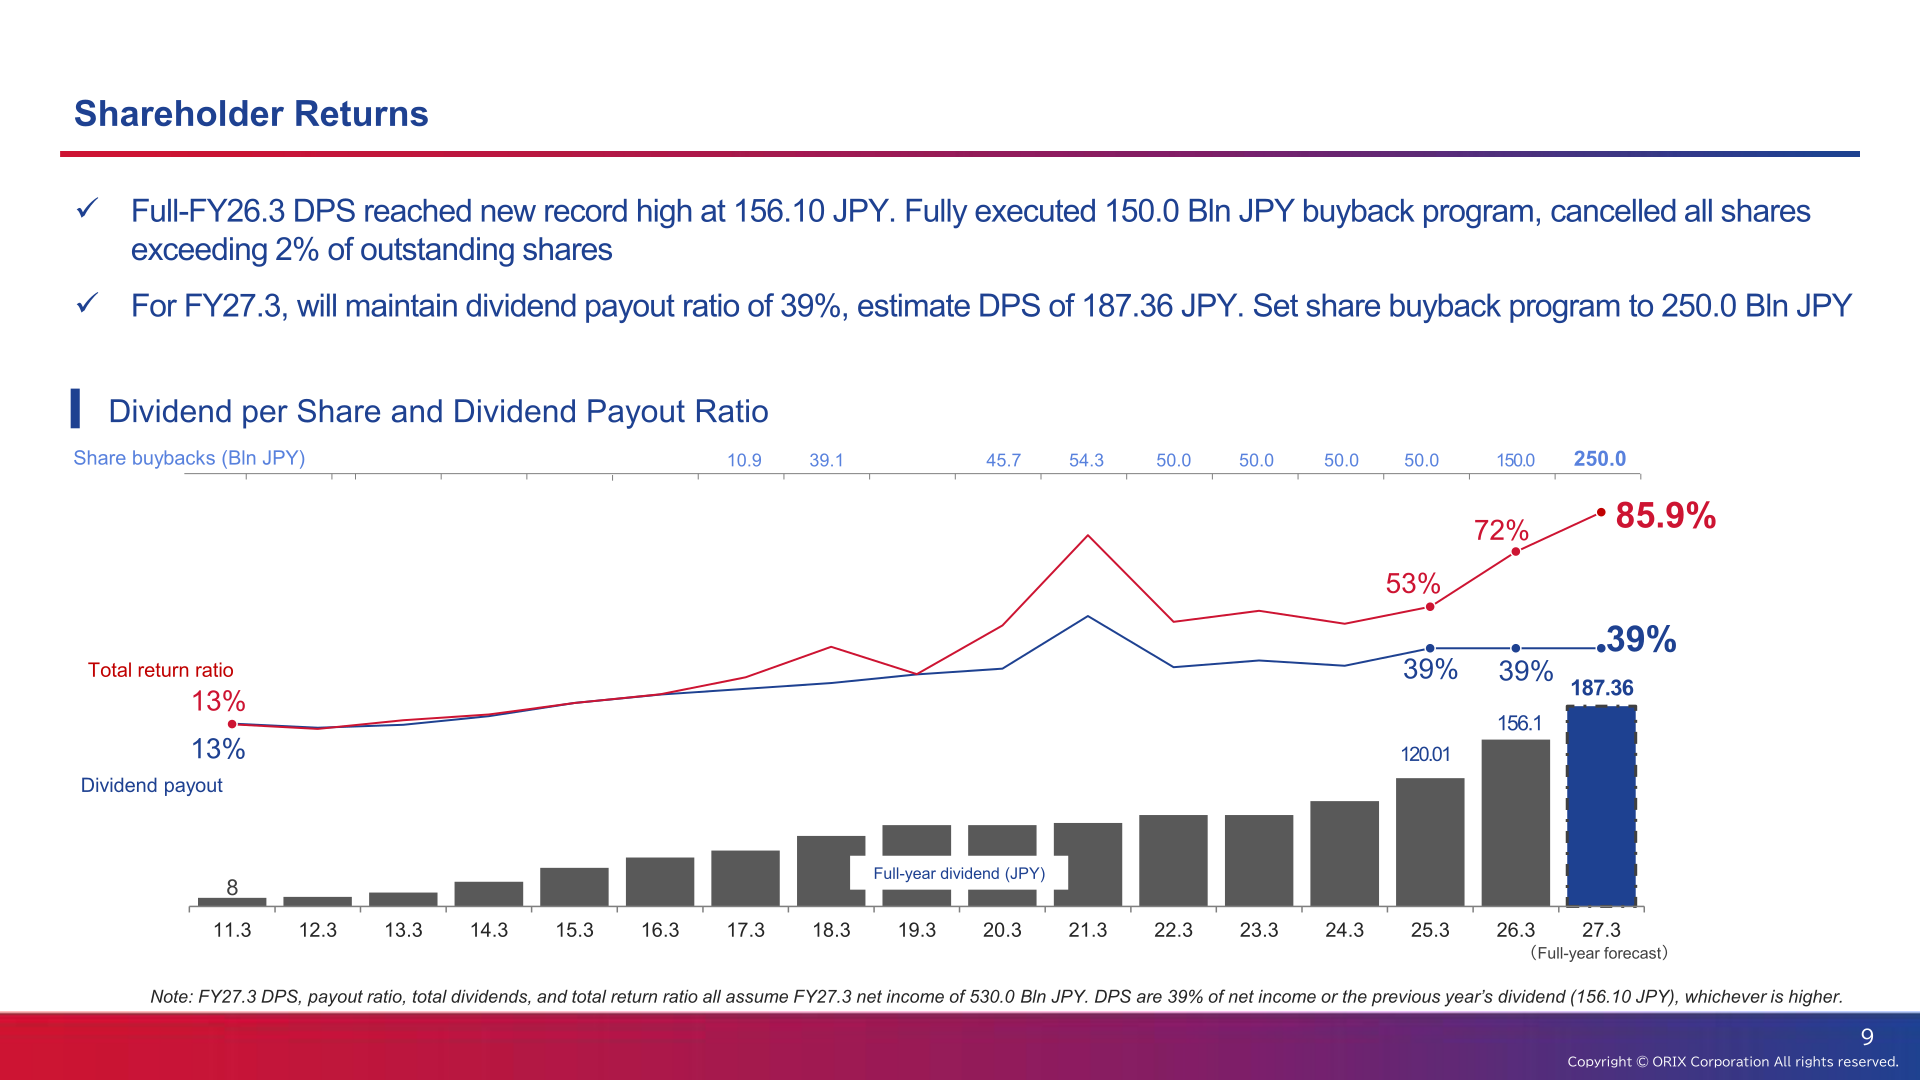
Full-year DPS for FY2025 reached a record 156.10 JPY (payout ratio 39%), and the 150.0 Bln JPY share buyback program was fully executed; ORIX also cancelled all treasury shares exceeding 2% of shares outstanding. For FY2026, ORIX will maintain a 39% dividend payout ratio and estimates DPS of 187.36 JPY, assuming net income of 530.0 Bln JPY is achieved (the FY2026 DPS floor is the FY2025 DPS of 156.10 JPY), and has set a share buyback program of 250.0 Bln JPY.
| Item | FY2026 Guidance (FY27.3) | FY2025 Actual (FY26.3) | FY2024 Actual (FY25.3) |
|---|---|---|---|
| Dividend per Share (DPS) | 187.36 JPY* | 156.10 JPY | 120.01 JPY |
| Dividend Payout Ratio | 39% | 39% | 39% |
| Share Buybacks | 250.0 Bln JPY | 150.0 Bln JPY | 50.0 Bln JPY |
Medium-Term Plan / Topics
ORIX is continuing three key initiatives toward its long-term vision — portfolio optimization, sophisticated risk management, and new business creation — and from FY2026 (FY27.3) has added ‘business model transformation’ as a new priority, centered on its two core business models, ‘Alternative Investment and Operations’ and ‘Business Solutions.’ Medium-term target for FY2027 (FY28.3) is ROE of 11.0%; long-term vision for FY2034 (FY35.3) is ROE of 15.0%. Assets under management (AUM, excluding AUA) reached 81 Tln JPY as of FY2025, against a long-term target of 100 Tln JPY. Key topics during FY2025 included establishing a joint domestic PE fund with the Qatar Investment Authority, completing the tender offer for I-NET, and, after fiscal year-end, announcing the sale of SGK Holdings (Sugiko) in March 2026 and signing an agreement in April 2026 to sell all shares of ORIX Bank to Daiwa Securities Group, with completion planned by October 2026. As of end-FY2025, ORIX’s credit ratings were S&P BBB+ (Stable), Moody’s A3 (Stable), Fitch A- (Stable), R&I AA (Stable), and JCR AA (Stable).
This article is an analysis based on publicly available information and is not a recommendation to buy or sell any specific securities. Investment decisions are your own responsibility.
![[Obayashi] Investors’ Guide 2026 — The Complete 24-Article Breakdown](https://japan-equity.com/wp-content/uploads/2026/07/hub_cover-1024x1024.png)
![[Obayashi] IR & SR Policy — Feeding Dialogue Back into Management](https://japan-equity.com/wp-content/uploads/2026/07/p32_sq-1024x1024.jpg)
![[Obayashi] Real Estate Development — 18.7% Margin, ¥287.7bn Unrealized Gains](https://japan-equity.com/wp-content/uploads/2026/07/p20_sq-1024x1024.jpg)
![[Obayashi] Domestic Civil Engineering — Resilience Spending Supports 9.6% Margin](https://japan-equity.com/wp-content/uploads/2026/07/p11_sq-1024x1024.jpg)
![[Obayashi] Share Price & External Ratings — vs TOPIX, ESG Index Inclusion](https://japan-equity.com/wp-content/uploads/2026/07/p40_sq-1024x1024.jpg)
![[Construction] ¥75.5tn Investment, Shrinking Workforce — Big-5 Market Share](https://japan-equity.com/wp-content/uploads/2026/07/p12_sq-1024x1024.jpg)



![[Obayashi] Capital Policy & Shareholder Returns — ROE 10%+, DOE ~5%, ¥100bn Buyback](https://japan-equity.com/wp-content/uploads/2026/07/p27_sq-1024x1024.jpg)
![[Obayashi] Reducing Cross-Shareholdings — ¥285.2bn Sold in Five Years](https://japan-equity.com/wp-content/uploads/2026/07/p29_sq-1024x1024.jpg)
![[Obayashi] ¥750bn Investment Plan — ¥300bn to Development, ¥190bn to Tech/DX](https://japan-equity.com/wp-content/uploads/2026/07/p30_sq-1024x1024.jpg)
![[Obayashi] MTP2022 KPIs — Operating Profit ~2x Target, ROE 14.4%](https://japan-equity.com/wp-content/uploads/2026/07/p25_sq-1024x1024.jpg)
![[Obayashi] Cash Allocation — ¥420bn Investment CF Over Five Years](https://japan-equity.com/wp-content/uploads/2026/07/p26_sq-1024x1024.jpg)
![[Obayashi] Green Energy — 44 Plants, 344MW, and the Green Hydrogen Challenge](https://japan-equity.com/wp-content/uploads/2026/07/p21_sq-1024x1024.jpg)
![[Obayashi] Tackling the Labor Shortage — Robotics Construction®](https://japan-equity.com/wp-content/uploads/2026/07/p14_sq-1024x1024.jpg)
