
This article is based on publicly available IR materials and is not a recommendation to buy or sell any specific securities.
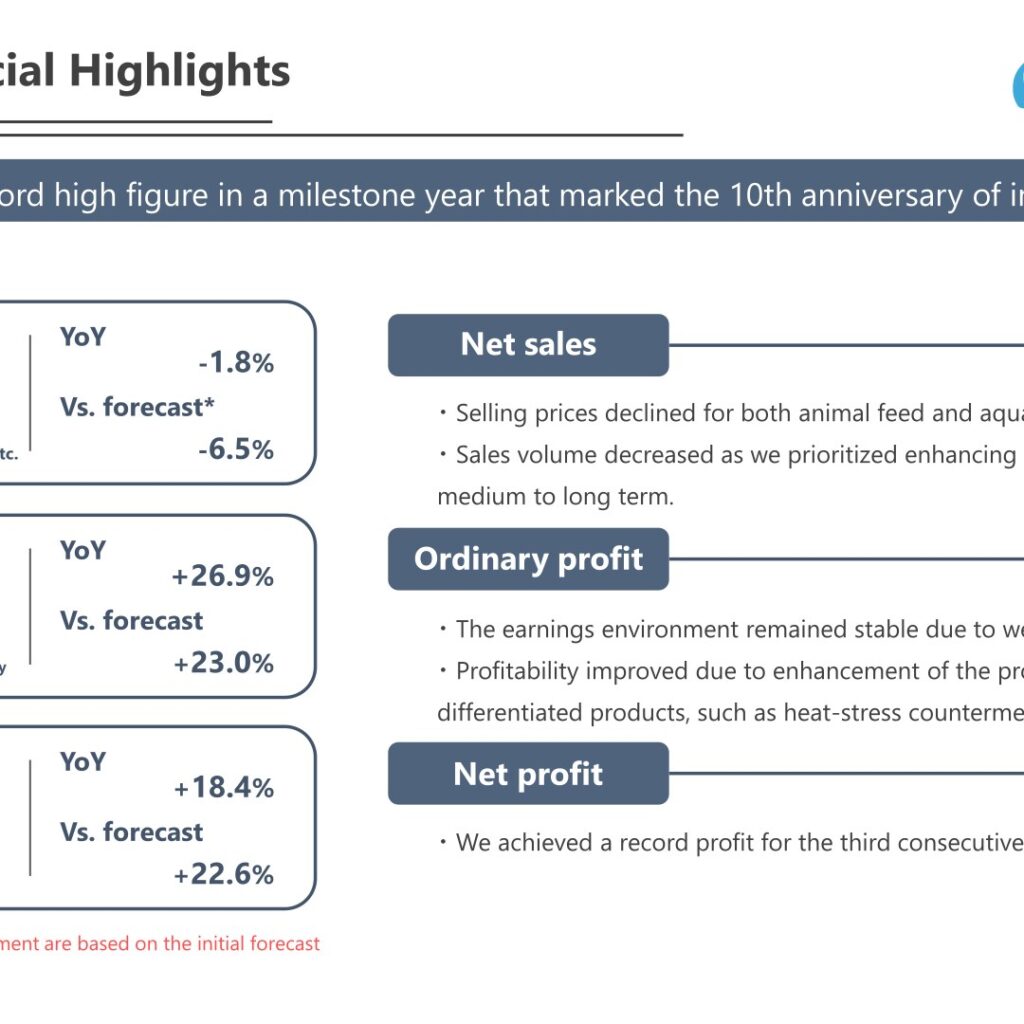
Note: FEED ONE’s fiscal year ended March 31, 2026, and the company labels the period “FYE3/2026”; this article classifies it as FY2025 under our site convention, while all figures, tables and labels below follow the company’s own presentation. FEED ONE CO., LTD. (TSE Prime, 2060) reported net sales of ¥290,675 million for FYE3/2026, down 1.8% year on year, as selling prices declined for both animal feed and aquatic feed and sales volume decreased under a policy that prioritized enhancing the profit base. Profit nevertheless hit a record high at every profit level: operating profit rose 27.6% to ¥8,091 million, ordinary profit rose 26.9% to ¥8,612 million, and profit attributable to owners of parent rose 18.4% to ¥6,377 million. The company describes FYE3/2026 as “a milestone year that marked the 10th anniversary of integration” and notes it achieved a record profit for the third consecutive year. For FYE3/2027 it forecasts new record profits once again, with net sales of ¥317,000 million and ordinary profit of ¥8,800 million.
Consolidated Results (Full-Year Actual)
The presentation attributes the decline in net sales to lower animal feed selling prices and lower sales volume, while the earnings environment remained stable due to weak raw material prices. Profitability improved through enhancement of the profit base, with sales expanding in differentiated products such as heat-stress countermeasure products. Against the initial forecast announced on May 8, 2025, net sales came in at a progress rate of 93.5% while ordinary profit reached 123.0% and profit attributable to owners of parent 122.6%. Gross profit rose 6.2% to ¥33,847 million even as net sales fell, and SG&A expenses increased only 0.9%.
| Item (Millions of Yen) | FY3/2025 | FY3/2026 | YoY | Full-Year Forecast Progress |
|---|---|---|---|---|
| Net Sales | 296,045 | 290,675 | -1.8% | 93.5% |
| Cost of Sales | 264,171 | 256,828 | -2.8% | – |
| Gross Profit | 31,874 | 33,847 | +6.2% | 100.1% |
| SG&A Expenses | 25,531 | 25,755 | +0.9% | – |
| Operating Profit | 6,343 | 8,091 | +27.6% | 119.0% |
| Ordinary Profit | 6,789 | 8,612 | +26.9% | 123.0% |
| Profit attributable to owners of parent | 5,387 | 6,377 | +18.4% | 122.6% |
On the management indicators the company highlights, sales volume was 3.73 million tons (-1.4% YoY, -2.1% vs. forecast), EBITDA was ¥12.7 billion (+20.6% YoY, +14.1% vs. forecast), ROE was 11.0% (+0.7pt YoY, +2.0pt vs. forecast) and ROIC was 7.7% (+1.6pt YoY, +1.7pt vs. forecast). Total investment amount was ¥11.8 billion (+18.6% vs. forecast). The company states that EBITDA, ROE and ROIC “far exceeded the figures in the Medium-term Management Plan,” which targets 3.90 million tons of volume, ¥11.5 billion of EBITDA, ROE of 8% or more and ROIC of 6% or more for FYE3/2027. It assumes cost of equity of 8% and WACC of 6% for the period of the Medium-term Management Plan.
Segment Results
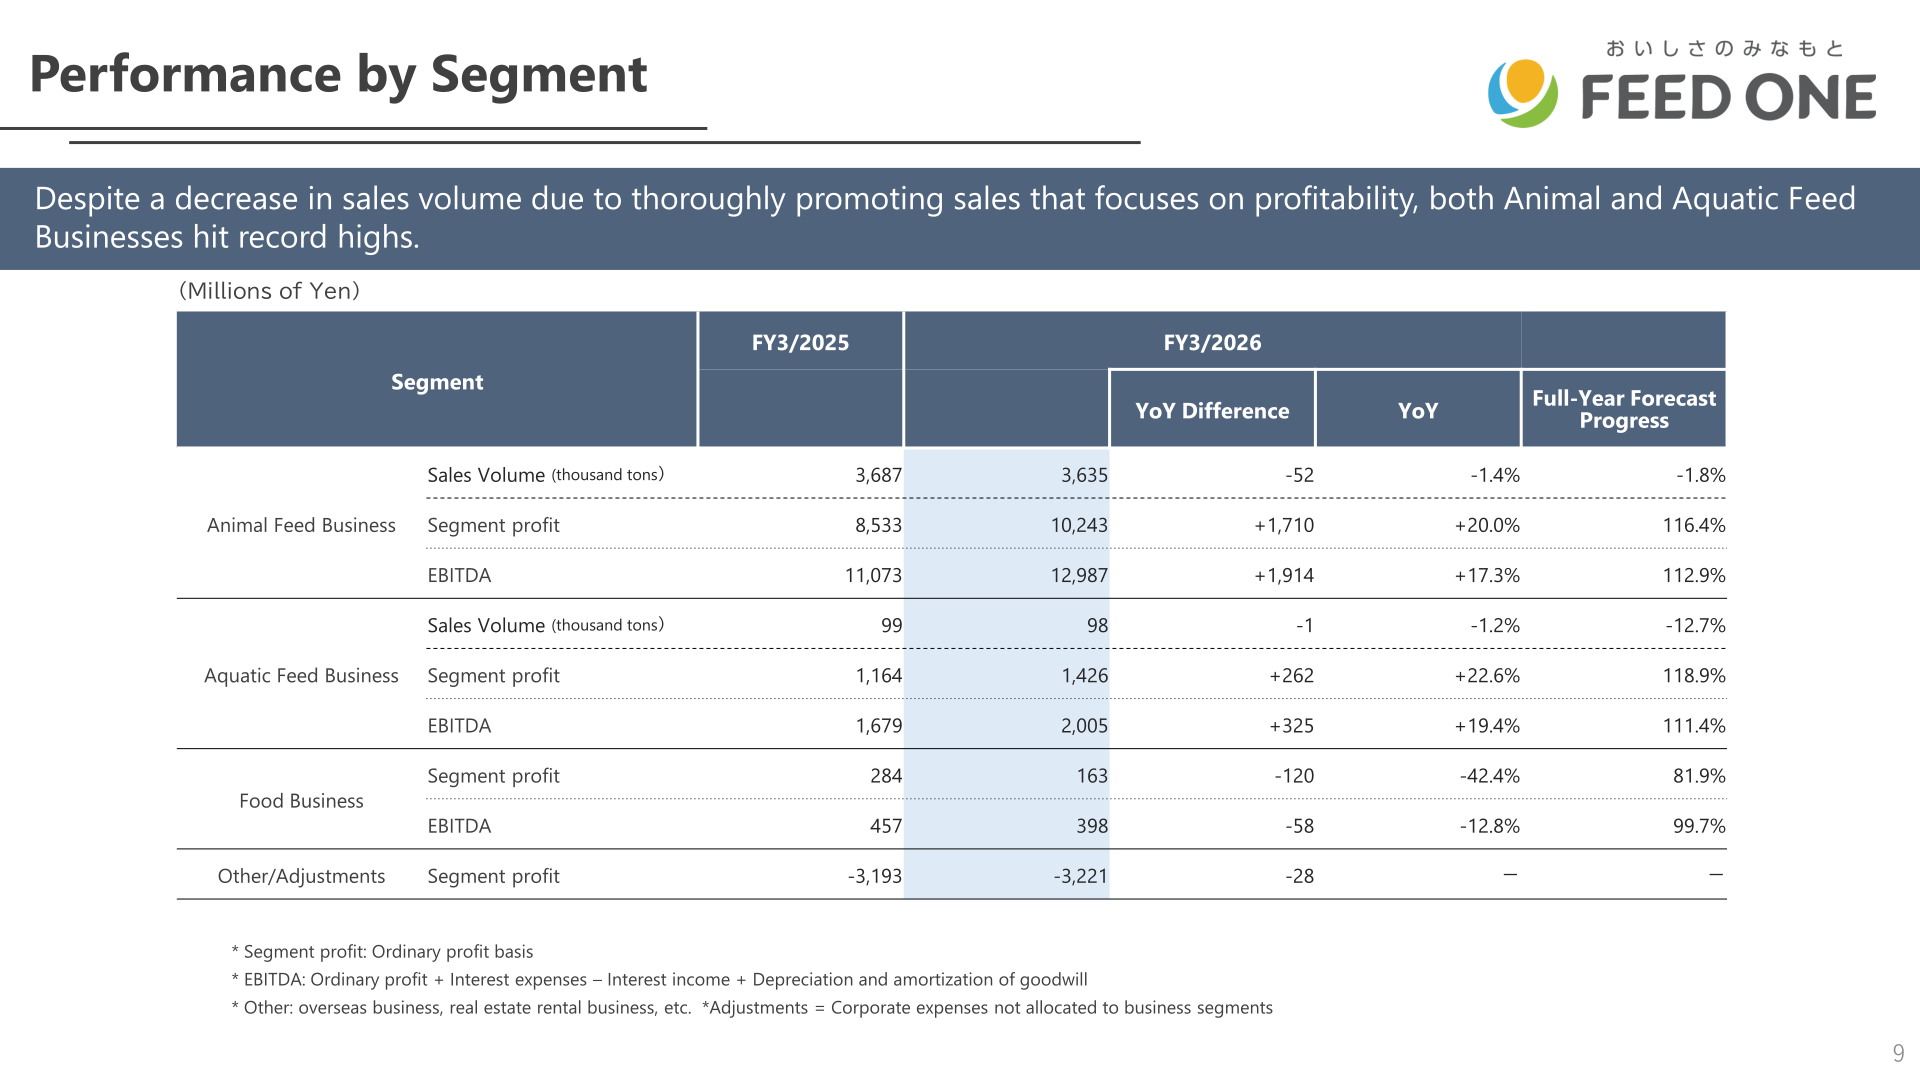
Both the Animal Feed and Aquatic Feed Businesses hit record highs despite lower sales volume. Animal Feed segment profit rose 20.0% to ¥10,243 million, reaching 116.4% of the full-year forecast; the company notes segment profit of over ¥10.0 billion was achieved for the first time after the integration. Aquatic Feed segment profit rose 22.6% to ¥1,426 million (118.9% of forecast), supported also by raw material prices serving as a tailwind. Food Business segment profit fell 42.4% to ¥163 million (81.9% of forecast), reflecting egg prices remaining high and increased depreciation associated with the operation of a new factory (the new Magic Pearl factory began operation on March 31, 2025). Segment profit is on an ordinary profit basis, and EBITDA is defined as ordinary profit + interest expenses – interest income + depreciation and amortization of goodwill.
| Segment | Metric (Millions of Yen) | FY3/2025 | FY3/2026 | YoY Difference | YoY |
|---|---|---|---|---|---|
| Animal Feed Business | Sales Volume (thousand tons) | 3,687 | 3,635 | -52 | -1.4% |
| Animal Feed Business | Segment profit | 8,533 | 10,243 | +1,710 | +20.0% |
| Animal Feed Business | EBITDA | 11,073 | 12,987 | +1,914 | +17.3% |
| Aquatic Feed Business | Sales Volume (thousand tons) | 99 | 98 | -1 | -1.2% |
| Aquatic Feed Business | Segment profit | 1,164 | 1,426 | +262 | +22.6% |
| Aquatic Feed Business | EBITDA | 1,679 | 2,005 | +325 | +19.4% |
| Food Business | Segment profit | 284 | 163 | -120 | -42.4% |
| Food Business | EBITDA | 457 | 398 | -58 | -12.8% |
| Other/Adjustments | Segment profit | -3,193 | -3,221 | -28 | – |
The bridge of ordinary profit from ¥6,789 million to ¥8,612 million (+¥1,823 million, +26.9%) shows, in the Animal Feed Business, a decrease in sales volume of -377 offset by an increase in gross profit of +2,001, an increase in SG&A expenses of -181 and an increase in non-operating income of +268; in the Aquatic Feed Business, a decrease in sales volume of -36 and an increase in gross profit of +380; a decrease in profit in the Poultry and Egg business, etc. of -120 in the Food Business; other of -80; and -28 in other/adjustments. By segment, ROIC was 13.3% for Animal Feed, 6.6% for Aquatic Feed, 2.2% for Food and 7.7% corporate-wide in FYE3/2026; the company notes Aquatic Feed ROIC would be 12.1% excluding the investment in the new aquatic feed factory currently in construction (about ¥7.0 billion).
Financial Position and Cash Flow
Equity increased ¥7,038 million to ¥62,385 million, lifting the equity ratio from 44.0% to 46.4% and lowering the D/E ratio from 0.50 to 0.40. Fixed assets rose to ¥54,547 million from ¥44,086 million as construction in progress for the new aquatic feed factory increased, while long-term borrowings increased from the H1 syndicated loan and short-term borrowings decreased. Operating cash flow reached a record-high ¥17,090 million, up 99.4% (+¥8,520 million) year on year, on profit before income taxes of ¥8,603 million, depreciation of ¥3,932 million and a ¥4,279 million year-on-year improvement in working capital. Investing cash flow was -¥11,552 million and financing cash flow -¥4,732 million, leaving cash and cash equivalents at ¥11,093 million at year-end versus ¥10,287 million at the beginning.
Next-Year Forecast
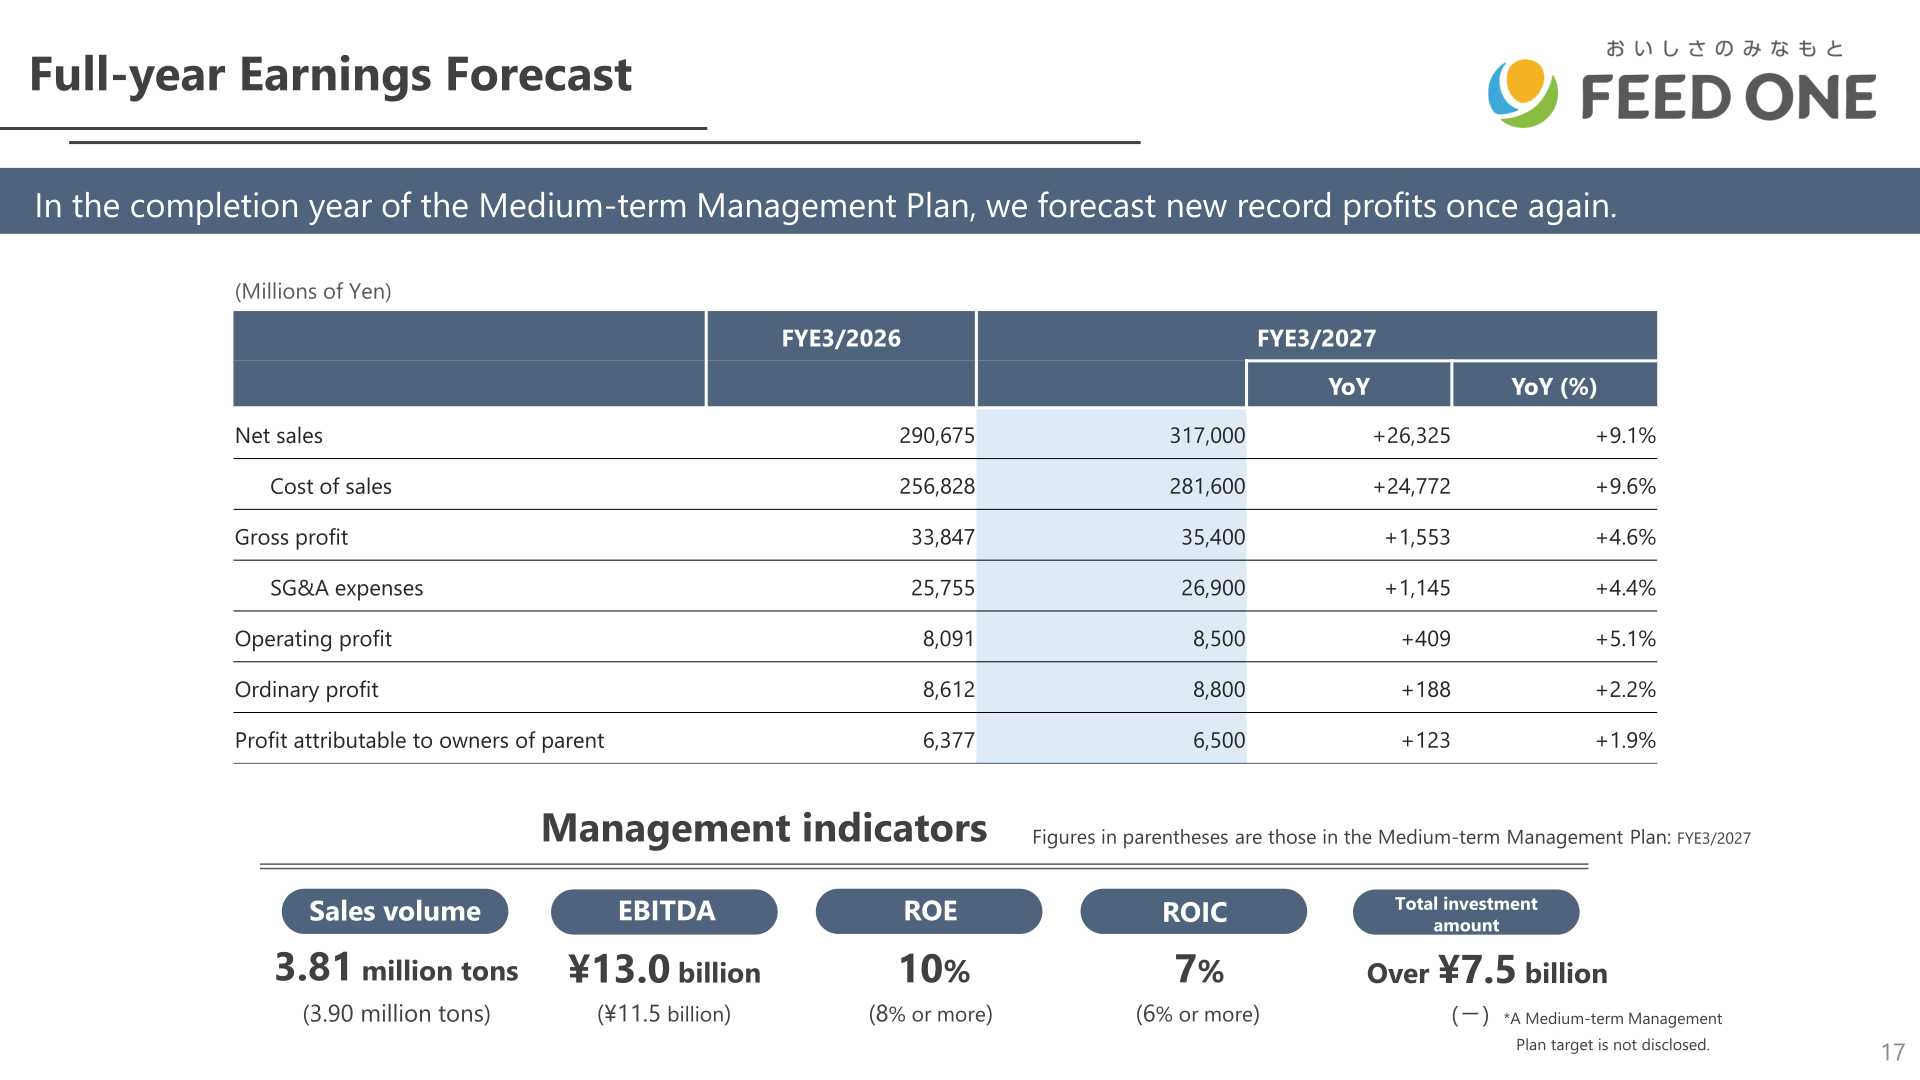
FYE3/2027 is the completion year of the Medium-term Management Plan, and FEED ONE forecasts new record profits once again. Net sales are projected to rise 9.1% to ¥317,000 million with ordinary profit up 2.2% to ¥8,800 million and profit attributable to owners of parent up 1.9% to ¥6,500 million. Management indicator targets are sales volume of 3.81 million tons, EBITDA of ¥13.0 billion, ROE of 10%, ROIC of 7% and total investment amount of over ¥7.5 billion (Medium-term Management Plan figures for FYE3/2027 are 3.90 million tons, ¥11.5 billion, 8% or more and 6% or more respectively). On the situation in the Middle East, the company forecasts the impact to be limited despite structural issues in the food supply chain and recent geopolitical risks, citing quarterly selling price revisions and compensation under the compound feed price stabilization system as countermeasures.
| Item (Millions of Yen) | FYE3/2026 | FYE3/2027 Forecast | YoY | YoY (%) |
|---|---|---|---|---|
| Net sales | 290,675 | 317,000 | +26,325 | +9.1% |
| Cost of sales | 256,828 | 281,600 | +24,772 | +9.6% |
| Gross profit | 33,847 | 35,400 | +1,553 | +4.6% |
| SG&A expenses | 25,755 | 26,900 | +1,145 | +4.4% |
| Operating profit | 8,091 | 8,500 | +409 | +5.1% |
| Ordinary profit | 8,612 | 8,800 | +188 | +2.2% |
| Profit attributable to owners of parent | 6,377 | 6,500 | +123 | +1.9% |
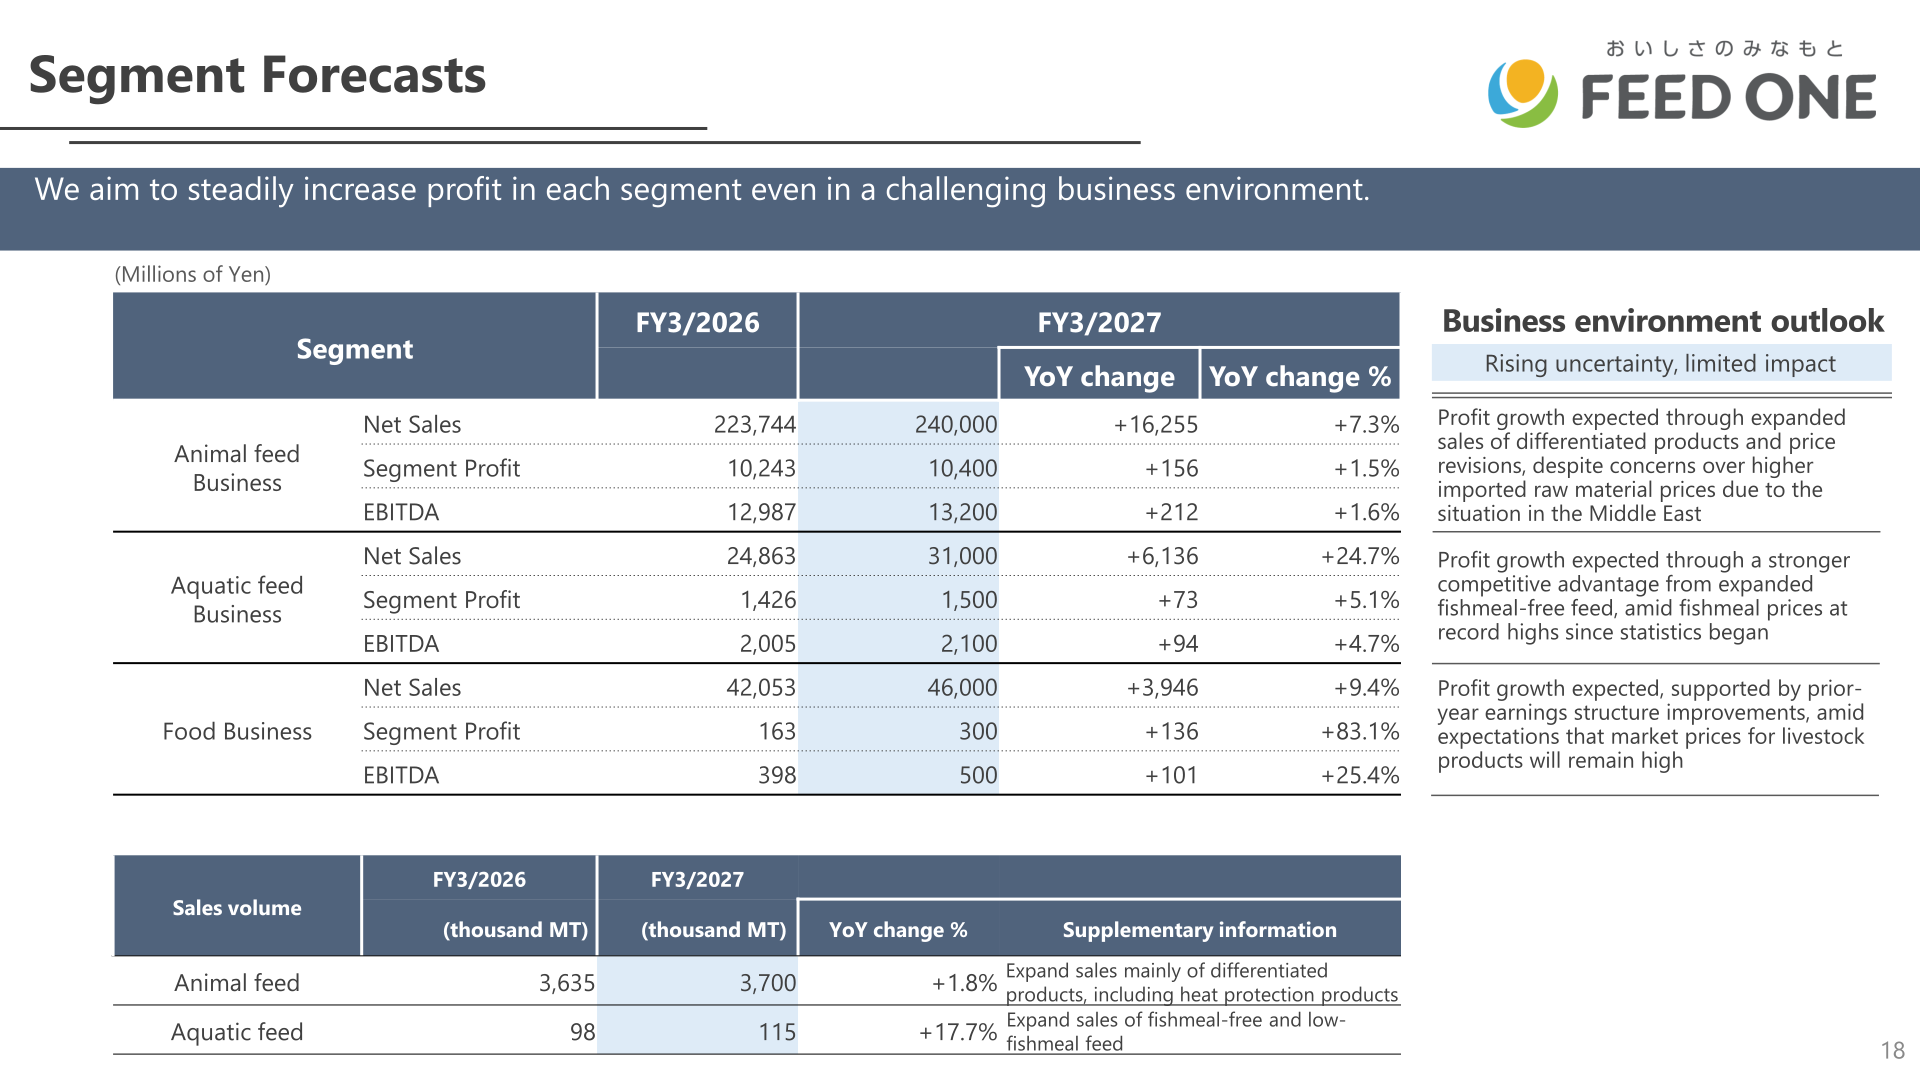
By segment, the company aims to steadily increase profit in each business. Animal feed volume is planned at 3,700 thousand MT (+1.8%) through expanded sales mainly of differentiated products including heat protection products, and aquatic feed volume at 115 thousand MT (+17.7%) through expanded sales of fishmeal-free and low-fishmeal feed amid fishmeal prices at record highs since statistics began.
| Segment | Metric (Millions of Yen) | FY3/2026 | FY3/2027 | YoY change | YoY change % |
|---|---|---|---|---|---|
| Animal feed Business | Net Sales | 223,744 | 240,000 | +16,255 | +7.3% |
| Animal feed Business | Segment Profit | 10,243 | 10,400 | +156 | +1.5% |
| Animal feed Business | EBITDA | 12,987 | 13,200 | +212 | +1.6% |
| Aquatic feed Business | Net Sales | 24,863 | 31,000 | +6,136 | +24.7% |
| Aquatic feed Business | Segment Profit | 1,426 | 1,500 | +73 | +5.1% |
| Aquatic feed Business | EBITDA | 2,005 | 2,100 | +94 | +4.7% |
| Food Business | Net Sales | 42,053 | 46,000 | +3,946 | +9.4% |
| Food Business | Segment Profit | 163 | 300 | +136 | +83.1% |
| Food Business | EBITDA | 398 | 500 | +101 | +25.4% |
Shareholder Returns
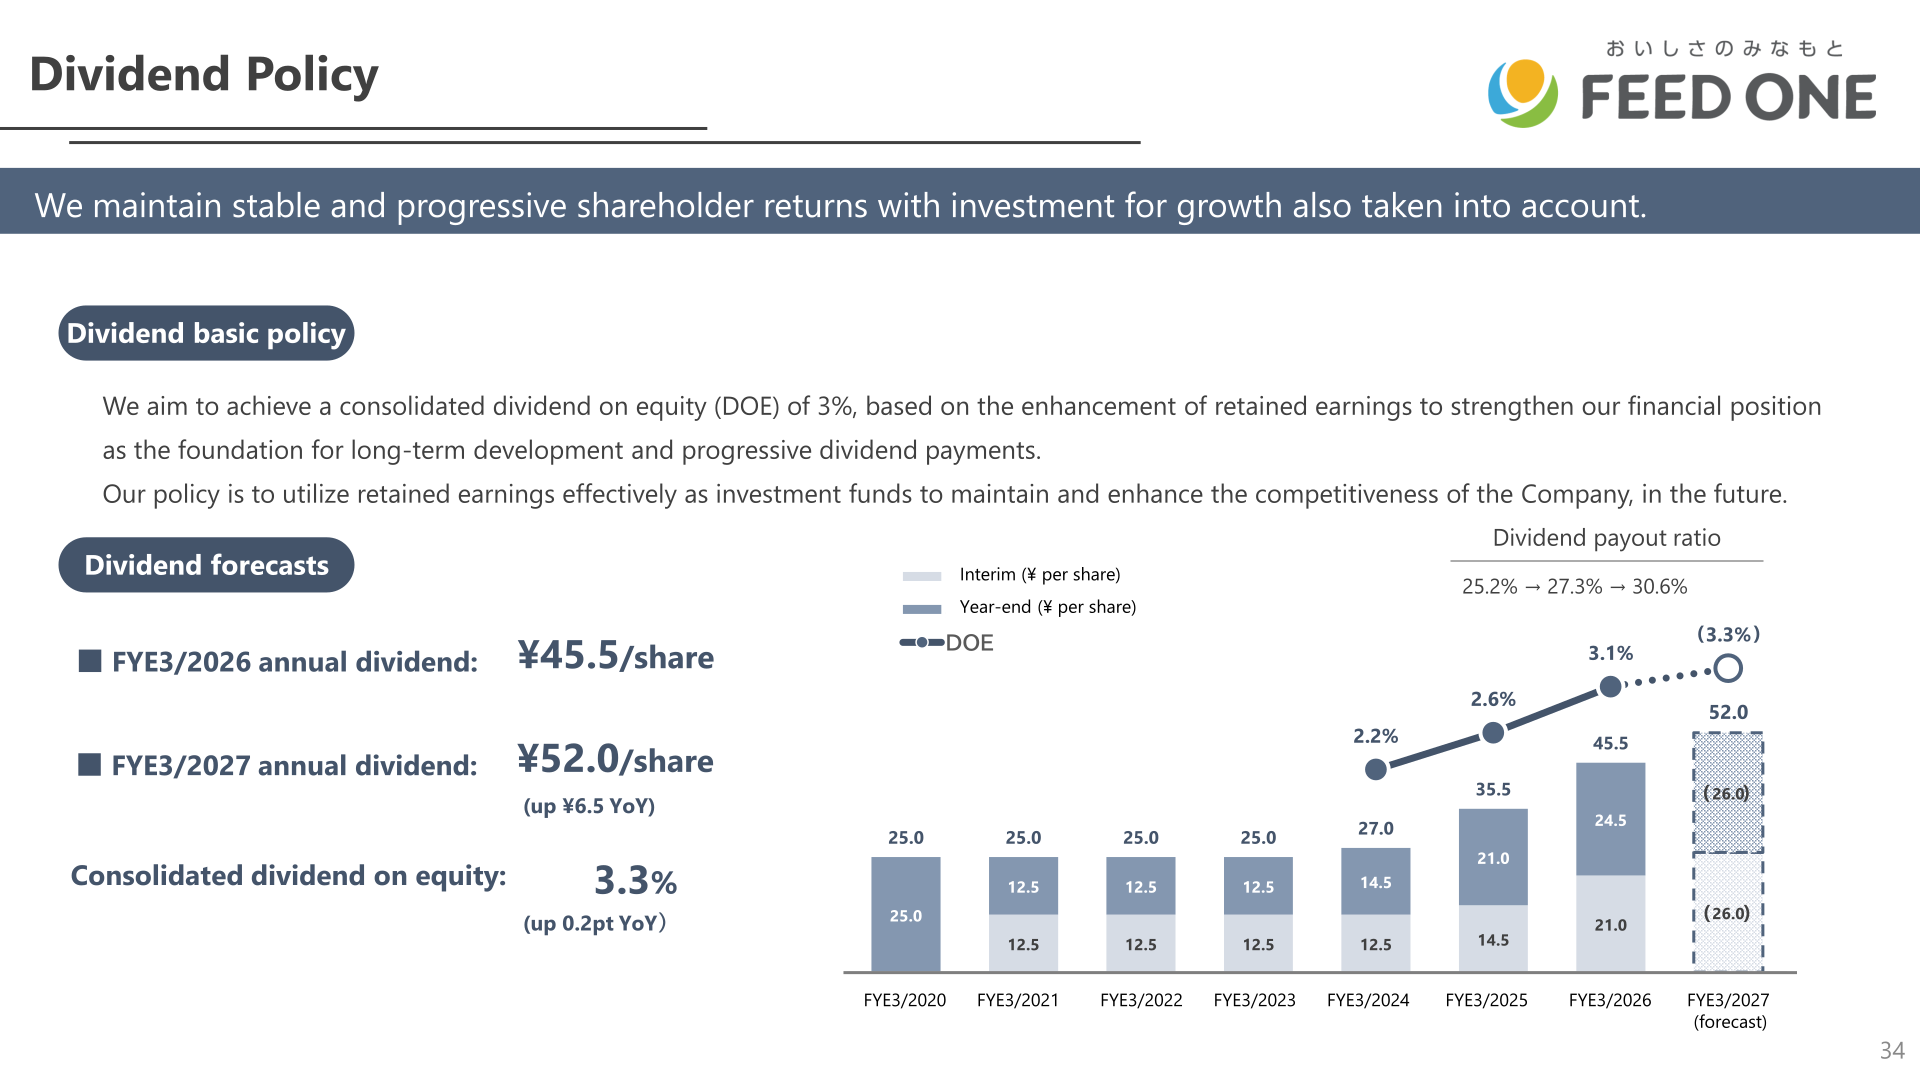
FEED ONE revised its dividend policy in the milestone year. The previous policy targeted a consolidated payout ratio of 25% or more; the new policy aims to achieve a consolidated dividend on equity (DOE) of 3%, based on the enhancement of retained earnings to strengthen the financial position as the foundation for long-term development and progressive dividend payments. The company’s policy to utilize retained earnings effectively as investment funds to maintain and enhance competitiveness remains unchanged. For FYE3/2026 the annual dividend was ¥45.5 per share: an interim dividend of ¥21.0, comprising an ordinary dividend of ¥16.0 and a commemorative dividend of ¥5 to mark the 10th anniversary of the full integration, and a year-end dividend of ¥24.5, an increase of ¥3.5 from ¥21.0 considering the earnings results and other factors. For FYE3/2027 the company forecasts an annual dividend of ¥52.0 per share, up ¥6.5 year on year, with consolidated DOE of 3.3% (up 0.2pt year on year). The dividend payout ratio moves 25.2% → 27.3% → 30.6%.
| Item | FYE3/2025 | FYE3/2026 | FYE3/2027 (forecast) |
|---|---|---|---|
| Annual dividend (¥ per share) | 35.5 | 45.5 | 52.0 |
| Dividend payout ratio | 25.2% | 27.3% | 30.6% |
Medium-Term Plan and Topics
FEED ONE positions FYE3/2027 as the final year of the 1st stage of Phase 2 (FYE3/2025 to FYE3/2034) of its long-term vision, describing it as a year to ensure that the outcomes of strategic investments and structural reforms take root in the forms of profitability and ROIC. Goals for the year are record-high profits once again, EBITDA of around ¥13.0 billion and ROIC in the 7% range. With a total investment of about ¥80.0 billion in Phase 2, the FYE3/2034 targets are EBITDA of ¥16 billion or more, ROE of 10% or more, ROIC of 8% or more and market share of 20% or more. Named investments include a new aquatic feed factory in Aichi Prefecture (about ¥13.0 billion, FYE3/2029), a research facility of cattle farming in Fukushima Prefecture (about ¥1.0 billion, FYE3/2028) and expanded calf milk replacer facilities at the Tomakomai Factory in Hokkaido (about ¥2.0 billion, within FYE3/2028).
Operational priorities include expanding heat-stress countermeasure products, releasing insect protein products (a field trial on over 300,000 fish was implemented in FYE3/2026 with a patent application filed; the FYE3/2027 target is 4,000 tons and 60 deals), and reducing the average fish meal content from 40.5% in FYE3/2026 to 30% in FYE3/2027. About 100 product lines were reduced in each of the Animal and Aquatic Feed Businesses in FYE3/2026, with further reductions of 100 brands in animal feed and 89 brands in aquatic feed planned, and inventory turnover days targeted to move from 23 days to 22 days.
On market evaluation, the company notes PBR has remained below 1 for a long time and PER has been less than 8 for more than three years while ROE has stayed over 10% for more than three years, and that its EV/EBITDA ratio of 4.6 times in FYE3/2026 is below the food sector average of the 7x to 9x range. It targets ROE of 10% and PER of about 15 to achieve a PBR of 1x and 1.5x or higher, through higher profit margins, financial leverage and equity management with an equity ratio kept at around 50%, and more dialogue with investors.
This article is an analysis based on publicly available information and is not a recommendation to buy or sell any specific securities. Investment decisions are your own responsibility.
















