
This article is based on publicly available IR materials and is not a recommendation to buy or sell any specific securities.
Note: Hibiya Engineering labels the fiscal year ended March 31, 2026 as “FY3/2026” (and as “FY2025” in its medium-term management plan tables). This article follows this site’s convention of classifying the most recent completed fiscal year as FY2025, while the labels used in the text and tables below follow the company’s materials.
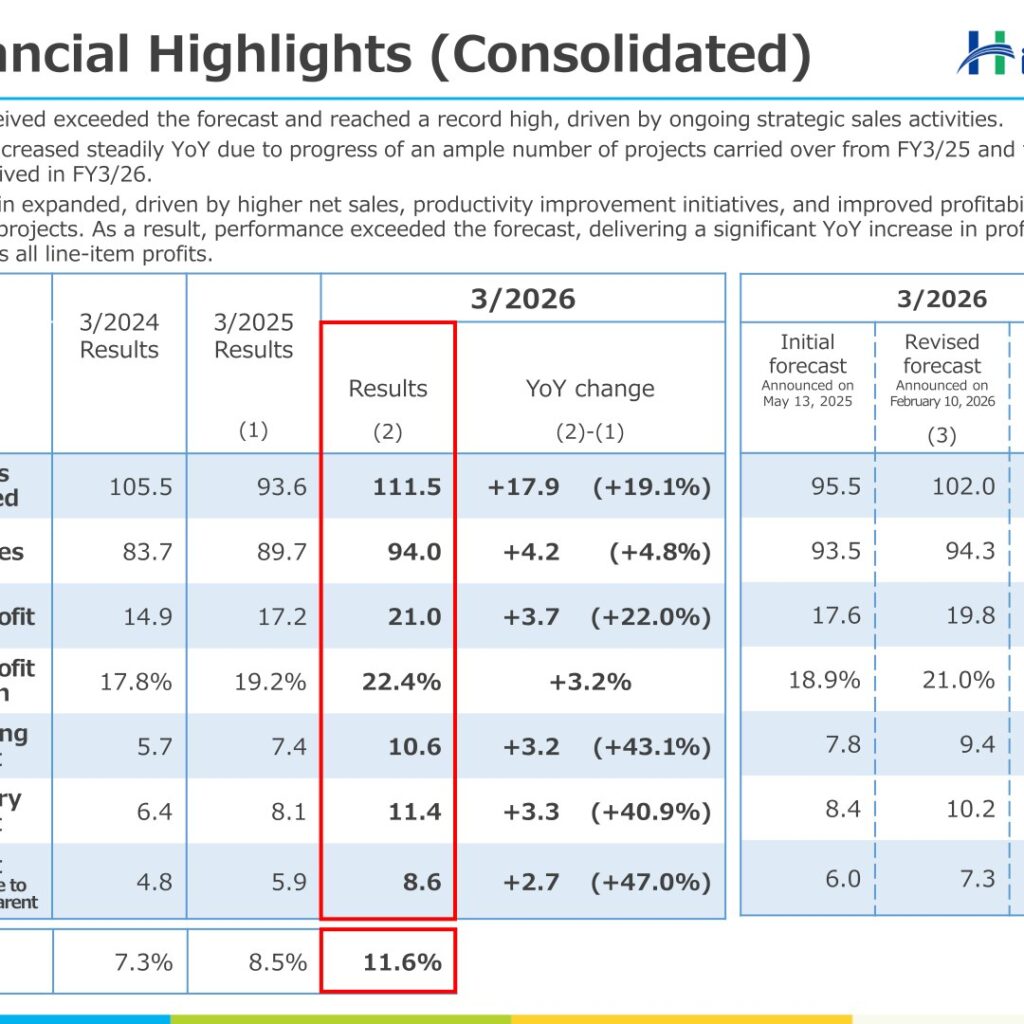
Hibiya Engineering, Ltd. reported record results for FY3/2026, the fiscal year ended March 31, 2026. Orders received rose 19.1% year on year to ¥111.5 bn and reached a record high, net sales grew 4.8% to ¥94.0 bn, and operating profit jumped 43.1% to ¥10.6 bn. Profit attributable to owners of parent increased 47.0% to ¥8.6 bn and ROE reached 11.6%. The company states that performance exceeded its forecast and that record highs were set across all line-item profits.
Consolidated Results (Full-Year Actual)
According to the presentation, orders received exceeded the forecast and reached a record high, driven by ongoing strategic sales activities. Net sales increased steadily year on year due to progress of an ample number of projects carried over from FY3/25 and those for orders received in FY3/26. Profit margin expanded, driven by higher net sales, productivity improvement initiatives, and improved profitability on certain completed projects. The gross profit margin rose 3.2 percentage points to 22.4%, and results came in ahead of the revised forecast announced on February 10, 2026 for every line except net sales, which was ¥0.2 bn below the revised figure of ¥94.3 bn.
| Item (Billion yen) | 3/2024 Results | 3/2025 Results | 3/2026 Results | YoY change | 3/2026 Revised forecast (Feb 10, 2026) | vs. revised forecast |
|---|---|---|---|---|---|---|
| Orders received | 105.5 | 93.6 | 111.5 | +17.9 (+19.1%) | 102.0 | +9.5 |
| Net sales | 83.7 | 89.7 | 94.0 | +4.2 (+4.8%) | 94.3 | -0.2 |
| Gross profit | 14.9 | 17.2 | 21.0 | +3.7 (+22.0%) | 19.8 | +1.2 |
| Gross profit margin | 17.8% | 19.2% | 22.4% | +3.2% | 21.0% | +1.4% |
| Operating profit | 5.7 | 7.4 | 10.6 | +3.2 (+43.1%) | 9.4 | +1.2 |
| Ordinary profit | 6.4 | 8.1 | 11.4 | +3.3 (+40.9%) | 10.2 | +1.2 |
| Profit attributable to owners of parent | 4.8 | 5.9 | 8.6 | +2.7 (+47.0%) | 7.3 | +1.3 |
| ROE | 7.3% | 8.5% | 11.6% |
On the consolidated income statement presented in the reference section (in million yen), net sales were ¥94,080 million (+¥4,294 million), cost of sales ¥73,021 million (+¥502 million), gross profit ¥21,058 million (+¥3,792 million), SG&A expenses ¥10,387 million (+¥578 million), operating profit ¥10,670 million (+¥3,214 million), ordinary profit ¥11,466 million (+¥3,328 million), profit before income taxes ¥11,877 million (+¥3,142 million) and profit ¥8,733 million (+¥2,761 million). Total assets stood at ¥110,935 million as of March 31, 2026 (+¥11,020 million), and total net assets at ¥80,531 million (+¥8,847 million).
Orders Received, Net Sales and Backlog by Customer and Category
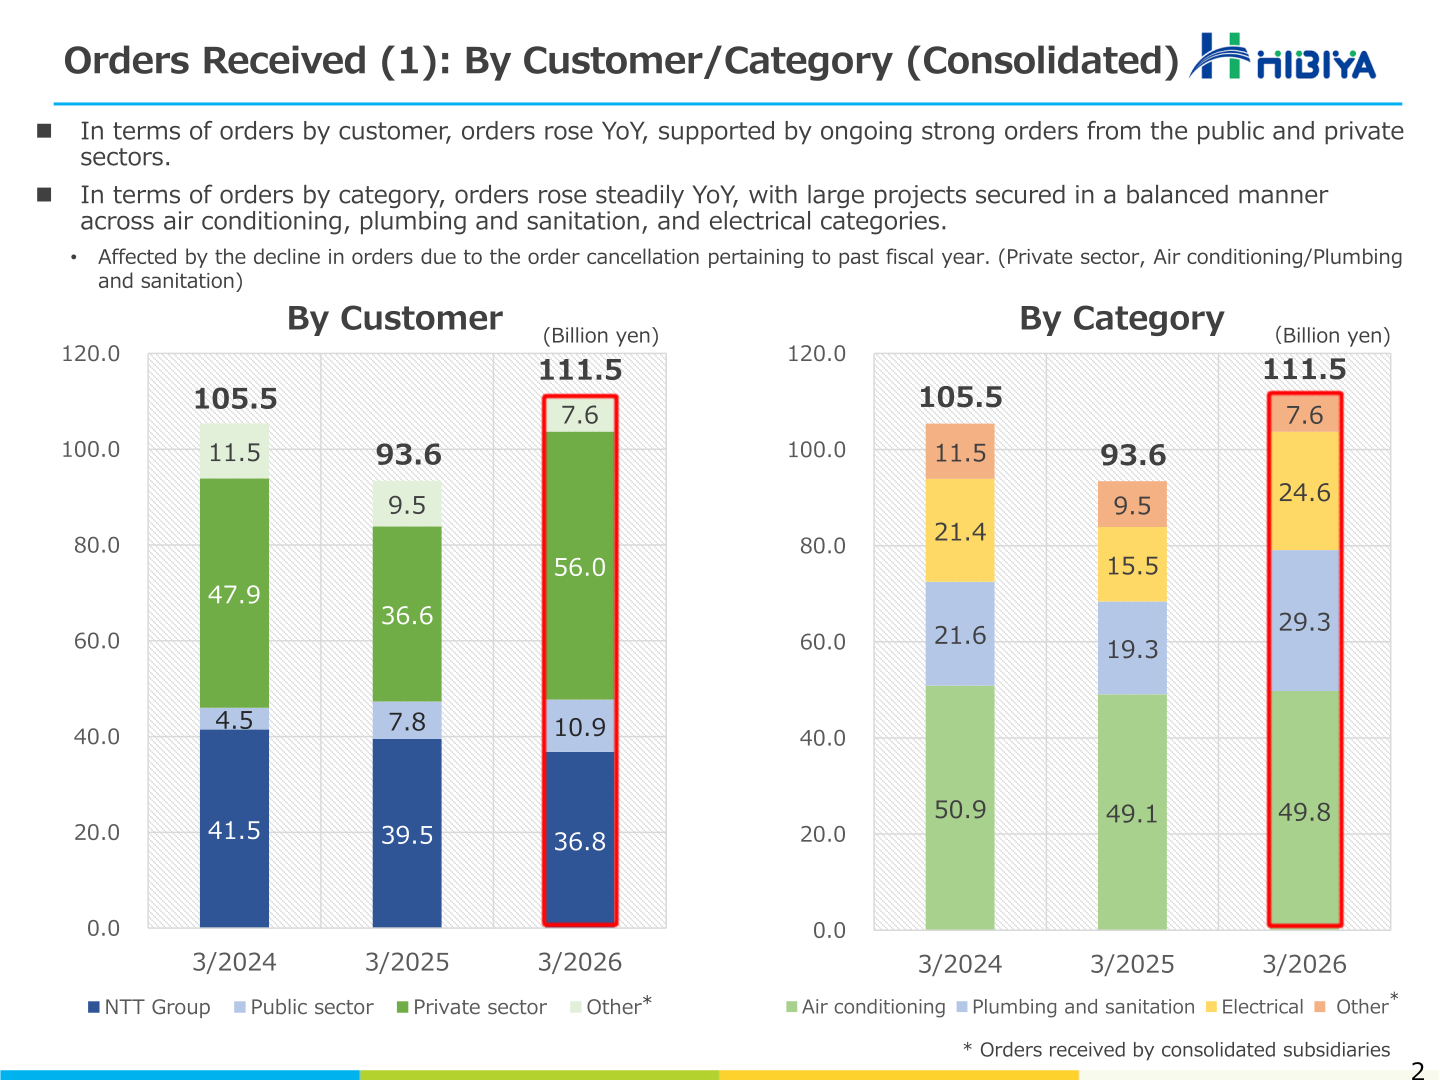
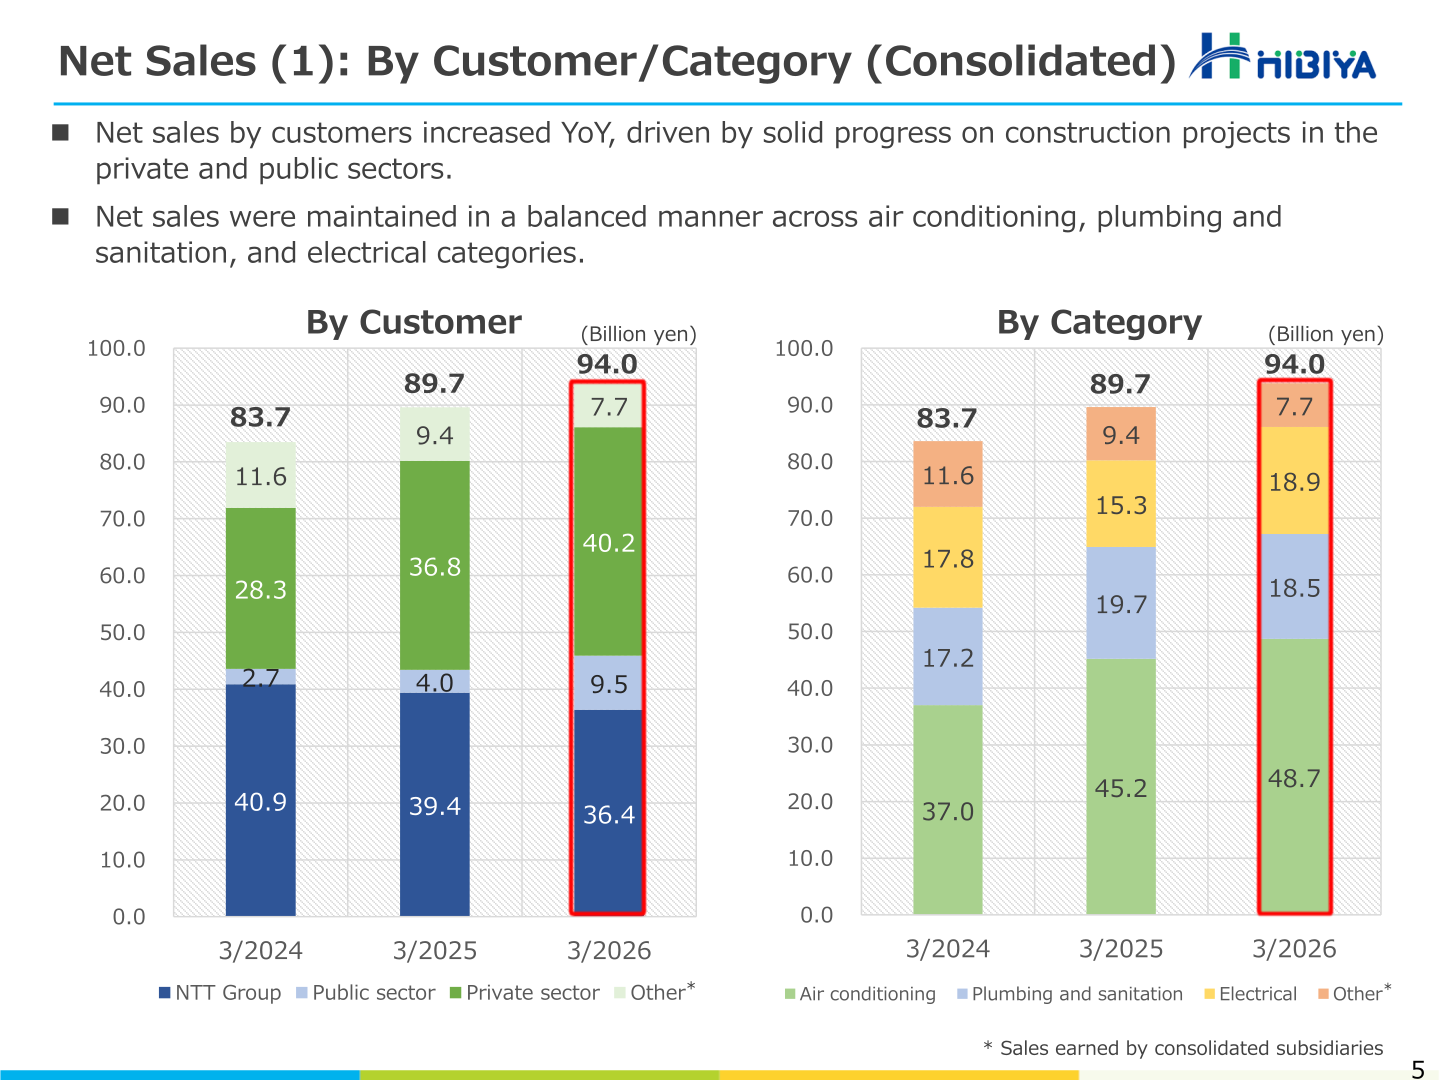
Orders by customer rose year on year, supported by ongoing strong orders from the public and private sectors, while orders by category rose steadily with large projects secured in a balanced manner across air conditioning, plumbing and sanitation, and electrical categories. The company notes that orders were affected by a decline due to an order cancellation pertaining to a past fiscal year (private sector; air conditioning / plumbing and sanitation). Net sales by customer increased on solid progress of construction projects in the private and public sectors. Projects carried over (backlog) increased significantly to ¥103.1 bn from ¥85.6 bn a year earlier, driven by solid progress in securing large projects in the private sector.
| Breakdown (Billion yen) | Orders received 3/2026 | Orders received 3/2025 | Net sales 3/2026 | Net sales 3/2025 |
|---|---|---|---|---|
| By customer: NTT Group | 36.8 | 39.5 | 36.4 | 39.4 |
| By customer: Public sector | 10.9 | 7.8 | 9.5 | 4.0 |
| By customer: Private sector | 56.0 | 36.6 | 40.2 | 36.8 |
| By customer: Other (consolidated subsidiaries) | 7.6 | 9.5 | 7.7 | 9.4 |
| By category: Air conditioning | 49.8 | 49.1 | 48.7 | 45.2 |
| By category: Plumbing and sanitation | 29.3 | 19.3 | 18.5 | 19.7 |
| By category: Electrical | 24.6 | 15.5 | 18.9 | 15.3 |
| By category: Other (consolidated subsidiaries) | 7.6 | 9.5 | 7.7 | 9.4 |
| Total | 111.5 | 93.6 | 94.0 | 89.7 |
On a non-consolidated basis, orders received were ¥103.9 bn, with Data centers/Information at ¥49.1 bn, Office buildings at ¥27.4 bn, Manufacturing/Distribution at ¥12.1 bn, Education/Healthcare at ¥3.2 bn, Hotels/Resorts at ¥2.7 bn and Other at ¥9.1 bn. Non-consolidated net sales were ¥86.2 bn, of which Data centers/Information accounted for ¥37.0 bn and Office buildings ¥32.6 bn. New construction accounted for 58.3% of non-consolidated orders received (¥60.5 bn) and renovation 41.7% (¥43.3 bn).
Next-Year Forecast and the Ninth Medium-term Management Plan
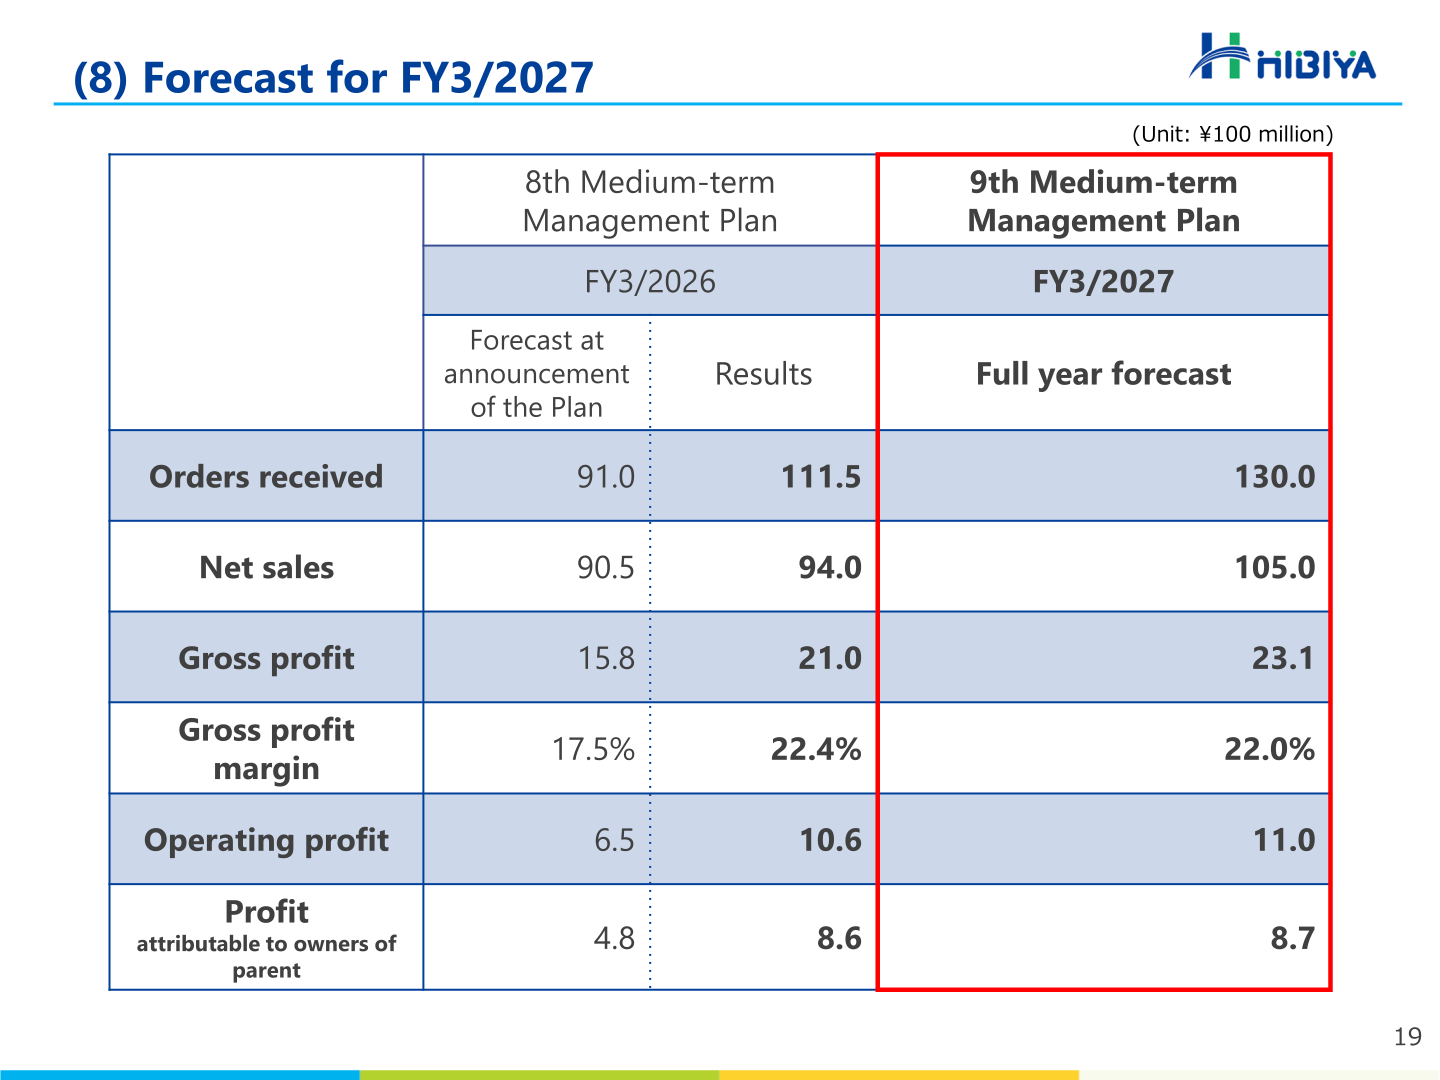
Alongside the results, the company published the review of its Eighth Medium-term Management Plan and the new Ninth Medium-term Management Plan covering FY2026 to FY2028, under the Management Vision “Deeper, Greater, and Beyond”. The Eighth Plan’s key indicators — orders received, net sales, operating profit and profit attributable to owners of parent — all reached their targets, against final-year targets of ¥91.0 bn, ¥90.5 bn, ¥6.5 bn and ¥4.8 bn respectively. For the final year of the Ninth Plan (FY2028), the company targets orders received of ¥120.0 bn, net sales of ¥113.0 bn, operating profit of ¥12.5 bn, ordinary profit of ¥13.2 bn, profit attributable to owners of parent of ¥9.5 bn, and ROE in the 12% range. The plan sets out a business growth strategy (marketing, alliance and smart operation strategies) and a management foundation strategy (human resources, data-driven management and financial capital strategies).
| Item (Billion yen unless noted) | FY3/2026 Results | FY3/2027 Full-year forecast | FY2028 Ninth MTMP final-year target |
|---|---|---|---|
| Orders received | 111.5 | 130.0 | 120.0 |
| Net sales | 94.0 | 105.0 | 113.0 |
| Gross profit | 21.0 | 23.1 | – |
| Gross profit margin | 22.4% | 22.0% | – |
| Operating profit | 10.6 | 11.0 | 12.5 |
| Ordinary profit | 11.4 | – | 13.2 |
| Profit attributable to owners of parent | 8.6 | 8.7 | 9.5 |
| ROE | 11.6% | – | In the 12% range |
Shareholder Returns
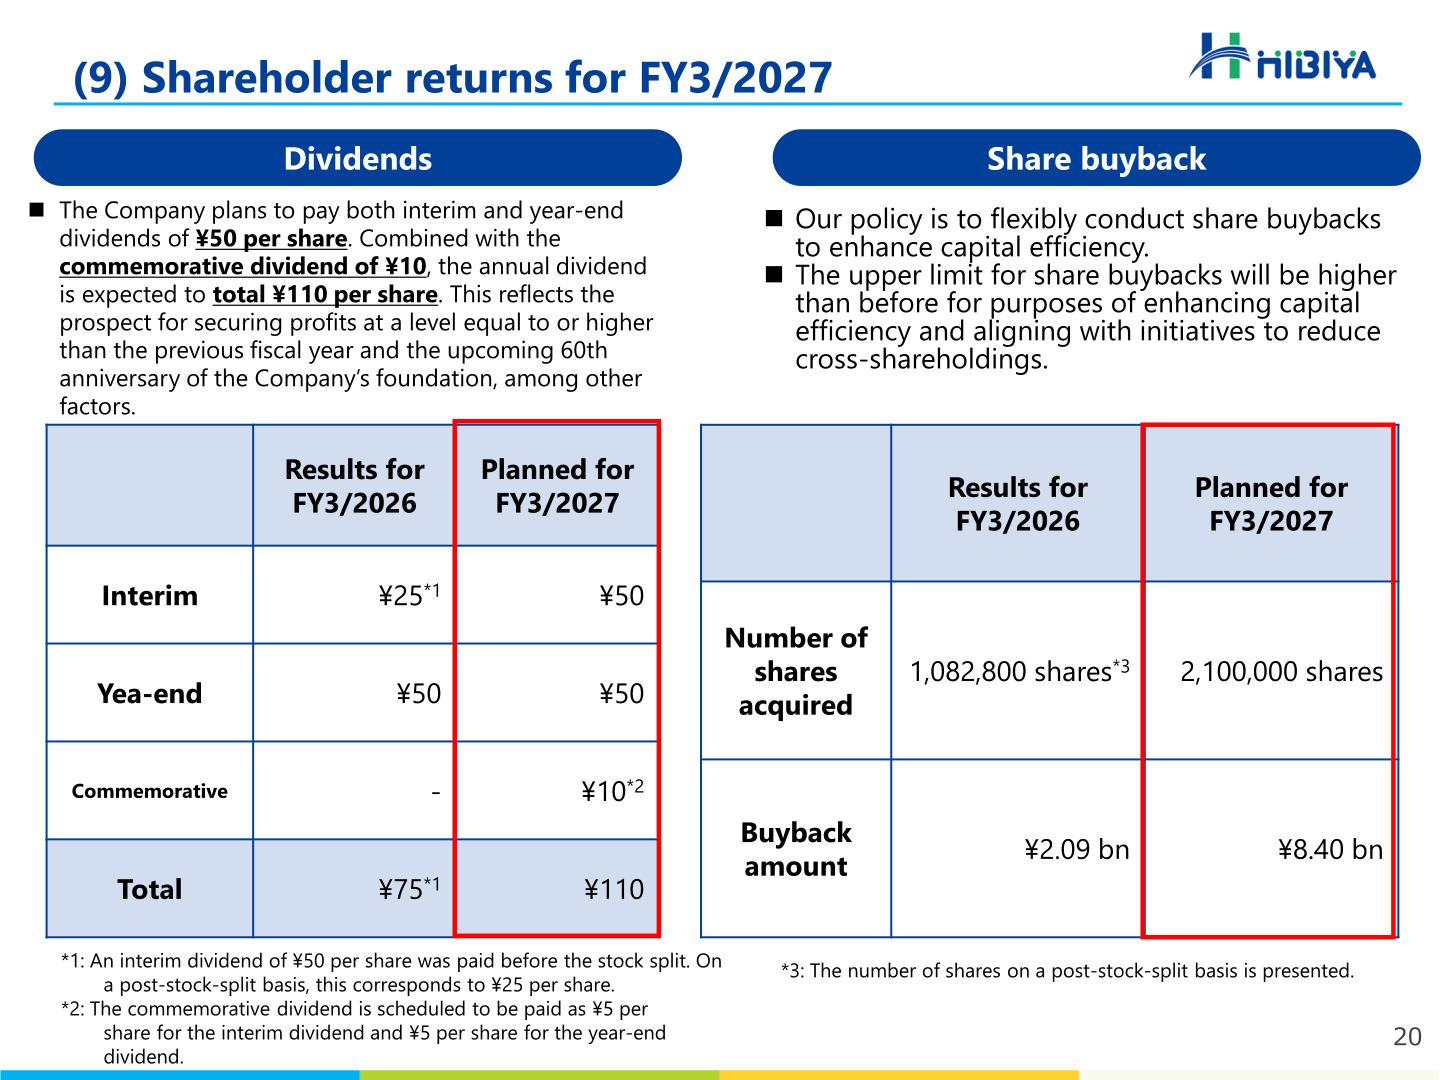
With a record date of March 31, 2026, the company split its common shares at a 2-for-1 ratio. Because FY3/2026 profits significantly exceeded the initial forecast, the company revised its results forecast and raised its dividend on February 10, 2026; as profit then exceeded the upwardly revised forecast, the year-end dividend was increased by ¥10, from ¥40 to ¥50 per share. The FY3/2026 year-end dividend was to be submitted for approval at the 61st Annual General Meeting of Shareholders scheduled for June 25, 2026. On a pre-split basis the FY3/2026 dividend plan is an interim dividend of ¥50 and a year-end dividend of (¥100), for a total of (¥150), against FY3/2025 actuals of ¥44 interim, ¥50 year-end and ¥94 total; the consolidated payout ratio rises from 35.5% to 37.4% and DOE from 3.0% to 4.4%. On a post-stock-split basis, the interim dividend of ¥50 paid before the split corresponds to ¥25 per share, giving a FY3/2026 total of ¥75 per share. For FY3/2027 the company plans interim and year-end dividends of ¥50 each plus a commemorative dividend of ¥10 (¥5 at the interim and ¥5 at the year-end) marking the 60th anniversary of its foundation, for an annual total of ¥110 per share. The Ninth Medium-term Management Plan’s financial capital strategy calls for paying dividends generally at a payout ratio of 50%, conducting share buybacks flexibly, and allocating ¥20.0 bn to shareholder returns and ¥15.0 bn to growth investment over FY2026–FY2028.
| Item | FY3/2026 Results | FY3/2027 Planned |
|---|---|---|
| Interim dividend per share (post-stock-split basis) | ¥25 | ¥50 |
| Year-end dividend per share | ¥50 | ¥50 |
| Commemorative dividend per share | – | ¥10 |
| Total dividend per share | ¥75 | ¥110 |
| Number of shares acquired (post-stock-split basis) | 1,082,800 shares | 2,100,000 shares |
| Share buyback amount | ¥2.09 bn | ¥8.40 bn |
| Payout ratio (consolidated) | 37.4% | – |
Topics
Under the Eighth Medium-term Management Plan the company expanded orders for data centers and large-scale redevelopment projects; its own orders for telecommunications facilities and data centers were ¥48,849 million in FY3/26 against ¥53,056 million in FY3/25 and ¥24,552 million in FY3/17. In November 2024 it opened the Data Center Trial Field with NTT Data to verify and co-create next-generation cooling technologies, hosting approximately 1,026 representatives from 226 companies and expanding participation from seven to eleven companies. Major projects completed in FY3/2026 include OIMACHI TRACKS BUSINESS TOWER, TAKANAWA GATEWAY CITY RESIDENCE, AP L-tage Kokutaiji Building, Patina Osaka, Tono Chubu Medical Center, the Dassai Sake Rice Warehouse, and ZEB renovation projects for the Nara General Prefectural Government Building and the Koriyama Fire Department building.
This article is an analysis based on publicly available information and is not a recommendation to buy or sell any specific securities. Investment decisions are your own responsibility.
















