
This article is based on publicly available IR materials and is not a recommendation to buy or sell any specific securities.
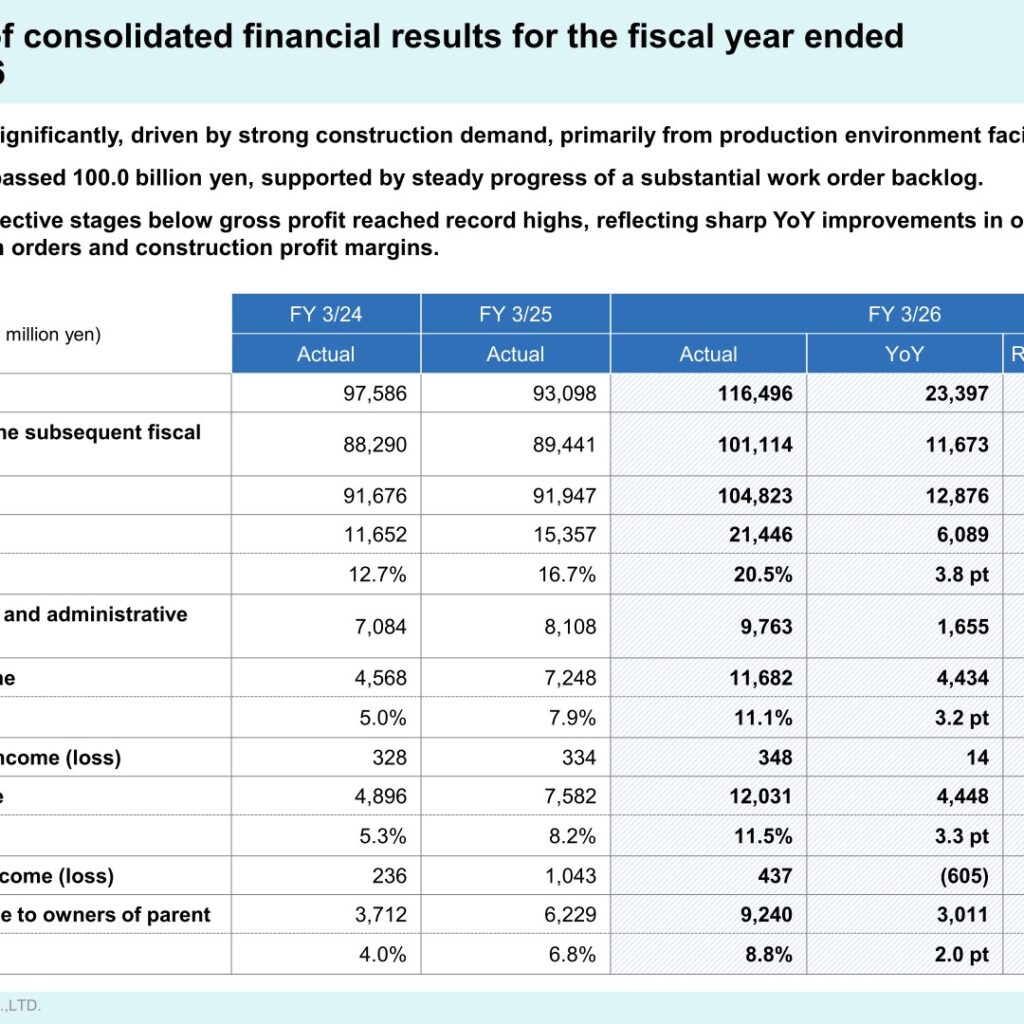
Note: This article covers the fiscal year ended March 31, 2026, which japan-equity.com classifies as FY2025; the company labels this period “FY 3/26” and the tables below keep the company’s own labels. Asahi Kogyosha Co., Ltd. (TSE Prime, Securities Code: 1975) reported orders of 116,496 million yen, up 25.1% year on year, and net sales of 104,823 million yen, up 14.0%, for the fiscal year ended March 2026. Operating income rose 61.2% to 11,682 million yen and profit attributable to owners of parent rose 48.3% to 9,240 million yen. The company states that orders grew significantly, driven by strong construction demand, primarily from production environment facilities, that net sales surpassed 100.0 billion yen supported by steady progress of a substantial work order backlog, and that profits at respective stages below gross profit reached record highs.
Consolidated Results (Full-Year Actual)
Gross profit rose 39.7% to 21,446 million yen and the gross margin improved 3.8 pt to 20.5%. Selling, general, and administrative expenses increased 20.4% to 9,763 million yen. Ordinary income rose 58.7% to 12,031 million yen, for an ordinary income margin of 11.5%. Carryovers for the subsequent fiscal year stood at 101,114 million yen, up 13.1%. Figures are in millions of yen as presented in the materials.
| Item (Unit: million yen) | FY 3/26 Actual | FY 3/25 Actual | YoY | Rate of change (%) |
|---|---|---|---|---|
| Orders | 116,496 | 93,098 | 23,397 | 25.1 |
| Carryovers for the subsequent fiscal year | 101,114 | 89,441 | 11,673 | 13.1 |
| Net sales | 104,823 | 91,947 | 12,876 | 14.0 |
| Gross profit | 21,446 | 15,357 | 6,089 | 39.7 |
| Gross profit margin | 20.5% | 16.7% | 3.8 pt | – |
| Selling, general, and administrative expenses | 9,763 | 8,108 | 1,655 | 20.4 |
| Operating income | 11,682 | 7,248 | 4,434 | 61.2 |
| Operating margin | 11.1% | 7.9% | 3.2 pt | – |
| Ordinary income | 12,031 | 7,582 | 4,448 | 58.7 |
| Ordinary income margin | 11.5% | 8.2% | 3.3 pt | – |
| Extraordinary income (loss) | 437 | 1,043 | (605) | (58.0) |
| Profit attributable to owners of parent | 9,240 | 6,229 | 3,011 | 48.3 |
| Net margin | 8.8% | 6.8% | 2.0 pt | – |
On the balance sheet, total assets rose 19,835 million yen from the end of the previous fiscal year to 100,697 million yen, which the company attributes to growth in accounts receivable and cash and deposits associated with favorable progress on orders and sales. Total liabilities increased 11,004 million yen to 49,838 million yen on higher interest-bearing debt raised for the construction of the Tsukuba Technical Research Institute and the like, with interest-bearing debt at 7,991 million yen. Net assets increased 8,831 million yen to 50,858 million yen. The shareholders’ equity ratio was 50.5% and ROE was 19.9%. Cash flow from operating activities was positive by 12,732 million yen, cash flow from investing activities was negative 5,472 million yen, and cash flow from financing activities was positive by 498 million yen; the balance of cash and cash equivalents was 26,266 million yen, an increase of 7,876 million yen.
Segment Results
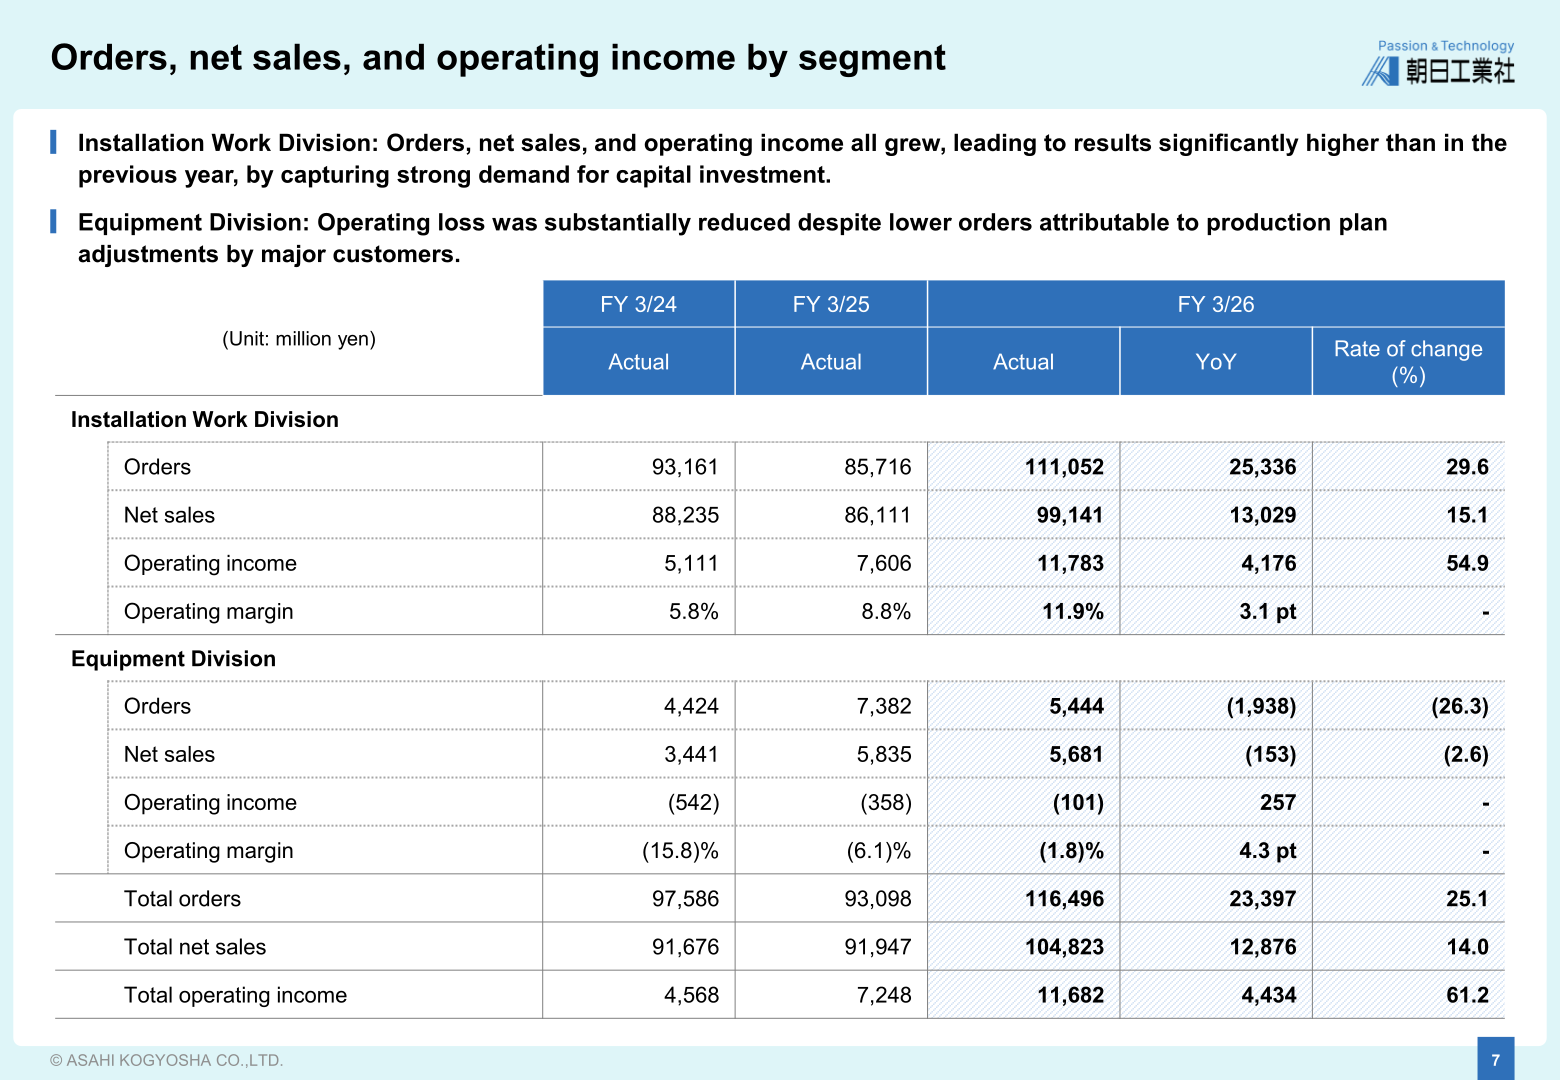
In the Installation Work Division, orders, net sales, and operating income all grew, leading to results significantly higher than in the previous year by capturing strong demand for capital investment. In the Equipment Division, the operating loss was substantially reduced despite lower orders attributable to production plan adjustments by major customers.
| Segment | Metric (Unit: million yen) | FY 3/26 | FY 3/25 | YoY | Rate of change (%) |
|---|---|---|---|---|---|
| Installation Work Division | Orders | 111,052 | 85,716 | 25,336 | 29.6 |
| Installation Work Division | Net sales | 99,141 | 86,111 | 13,029 | 15.1 |
| Installation Work Division | Operating income | 11,783 | 7,606 | 4,176 | 54.9 |
| Installation Work Division | Operating margin | 11.9% | 8.8% | 3.1 pt | – |
| Equipment Division | Orders | 5,444 | 7,382 | (1,938) | (26.3) |
| Equipment Division | Net sales | 5,681 | 5,835 | (153) | (2.6) |
| Equipment Division | Operating income | (101) | (358) | 257 | – |
| Equipment Division | Operating margin | (1.8)% | (6.1)% | 4.3 pt | – |
| Total | Orders | 116,496 | 93,098 | 23,397 | 25.1 |
| Total | Net sales | 104,823 | 91,947 | 12,876 | 14.0 |
| Total | Operating income | 11,682 | 7,248 | 4,434 | 61.2 |
Within the Installation Work Division, orders for production environment facilities (factories, laboratories, data centers, etc.) were 58,861 million yen, up 18.6%, and orders for living/cultural environment facilities were 22,242 million yen, up 84.4%. On the sales side, production environment facilities generated 47,537 million yen, up 20.4%, and health/medical environment facilities generated 10,616 million yen, up 55.2%. In the Equipment Division, FPD (liquid crystal)-related orders were 4,193 million yen, up 7.8%, while semiconductor-related orders fell 48.7% to 844 million yen and dryer-related and other orders fell 78.0% to 407 million yen.
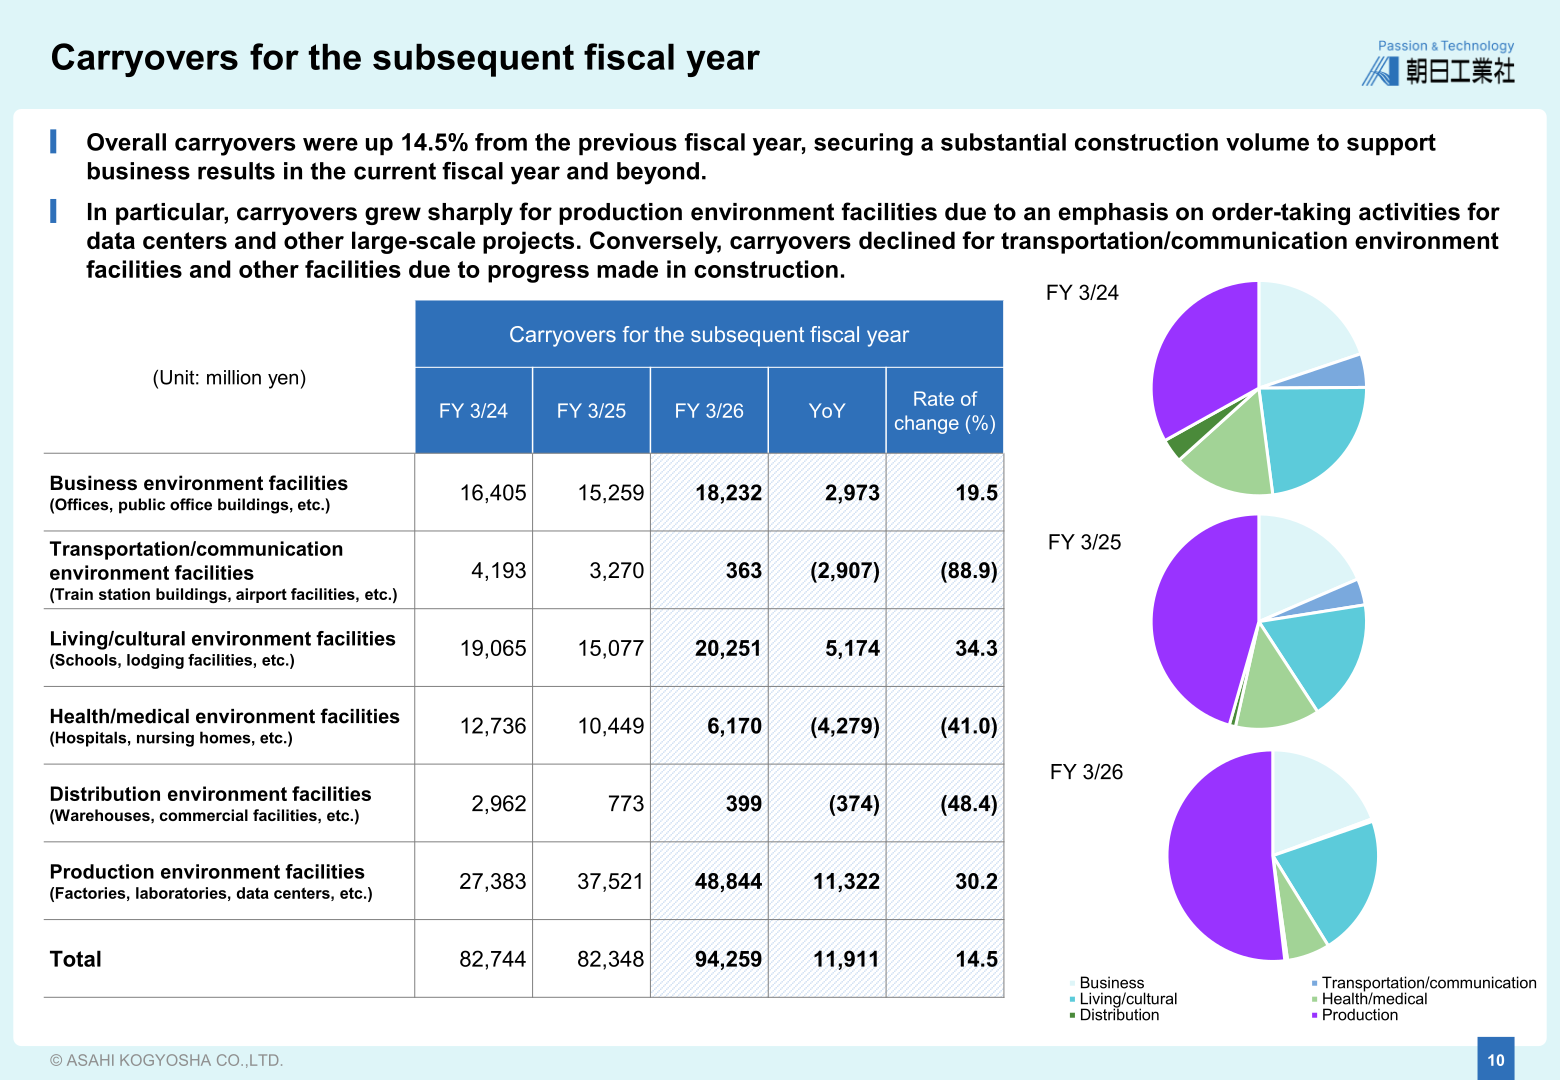
Carryovers for the subsequent fiscal year totaled 94,259 million yen on the facility-domain breakdown, up 14.5% from the previous fiscal year, which the company says secures a substantial construction volume to support business results in the current fiscal year and beyond. Carryovers for production environment facilities grew 30.2% to 48,844 million yen due to an emphasis on order-taking activities for data centers and other large-scale projects, while carryovers for transportation/communication environment facilities declined 88.9% to 363 million yen and those for health/medical environment facilities declined 41.0% to 6,170 million yen due to progress made in construction.
Full-Year Forecast
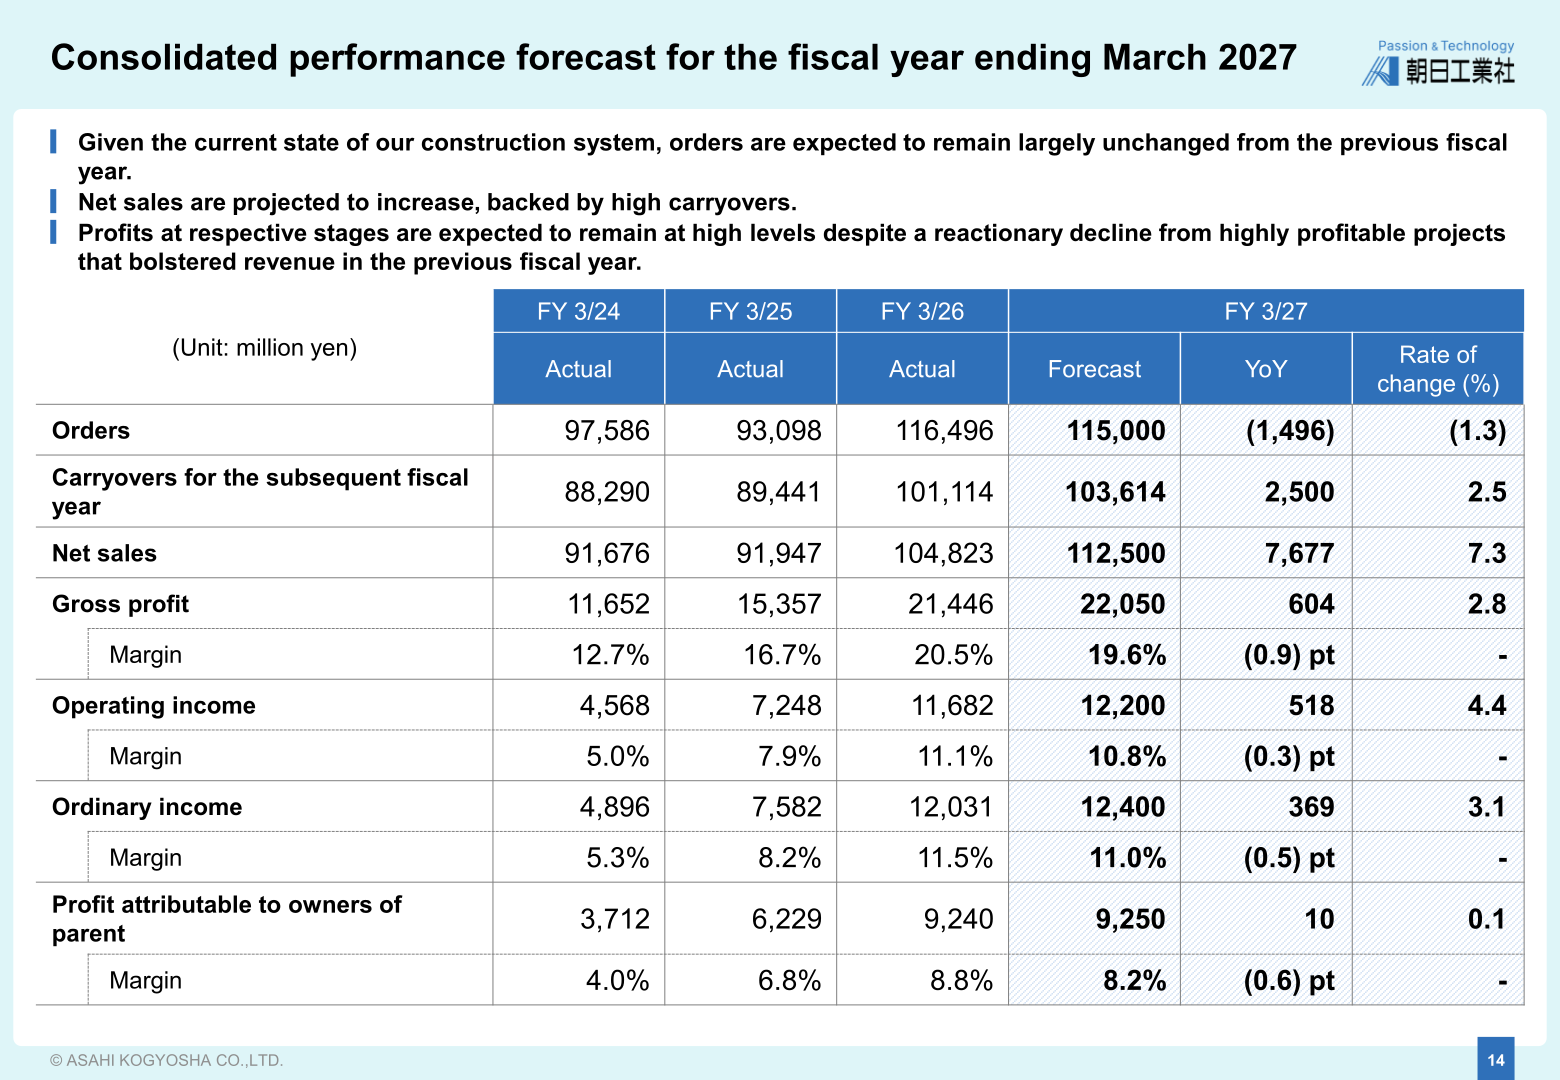
For the fiscal year ending March 2027, the company expects orders to remain largely unchanged from the previous fiscal year given the current state of its construction system, while net sales are projected to increase backed by high carryovers. Profits at respective stages are expected to remain at high levels despite a reactionary decline from highly profitable projects that bolstered revenue in the previous fiscal year.
| Item (Unit: million yen) | FY 3/27 Forecast | FY 3/26 Actual | YoY | Rate of change (%) |
|---|---|---|---|---|
| Orders | 115,000 | 116,496 | (1,496) | (1.3) |
| Carryovers for the subsequent fiscal year | 103,614 | 101,114 | 2,500 | 2.5 |
| Net sales | 112,500 | 104,823 | 7,677 | 7.3 |
| Gross profit | 22,050 | 21,446 | 604 | 2.8 |
| Gross profit margin | 19.6% | 20.5% | (0.9) pt | – |
| Operating income | 12,200 | 11,682 | 518 | 4.4 |
| Operating margin | 10.8% | 11.1% | (0.3) pt | – |
| Ordinary income | 12,400 | 12,031 | 369 | 3.1 |
| Ordinary income margin | 11.0% | 11.5% | (0.5) pt | – |
| Profit attributable to owners of parent | 9,250 | 9,240 | 10 | 0.1 |
| Net margin | 8.2% | 8.8% | (0.6) pt | – |
By segment, the company plans net sales growth in the Installation Work Division due to steady progress on the work order backlog, though orders are expected to decline slightly given the current state of its construction system. In the Equipment Division, orders are expected to increase based on continuing recovery in FPD-related demand, and net sales are also projected to increase by recording of dryer-related sales on large-scale orders received in FY 3/2025.
Shareholder Returns
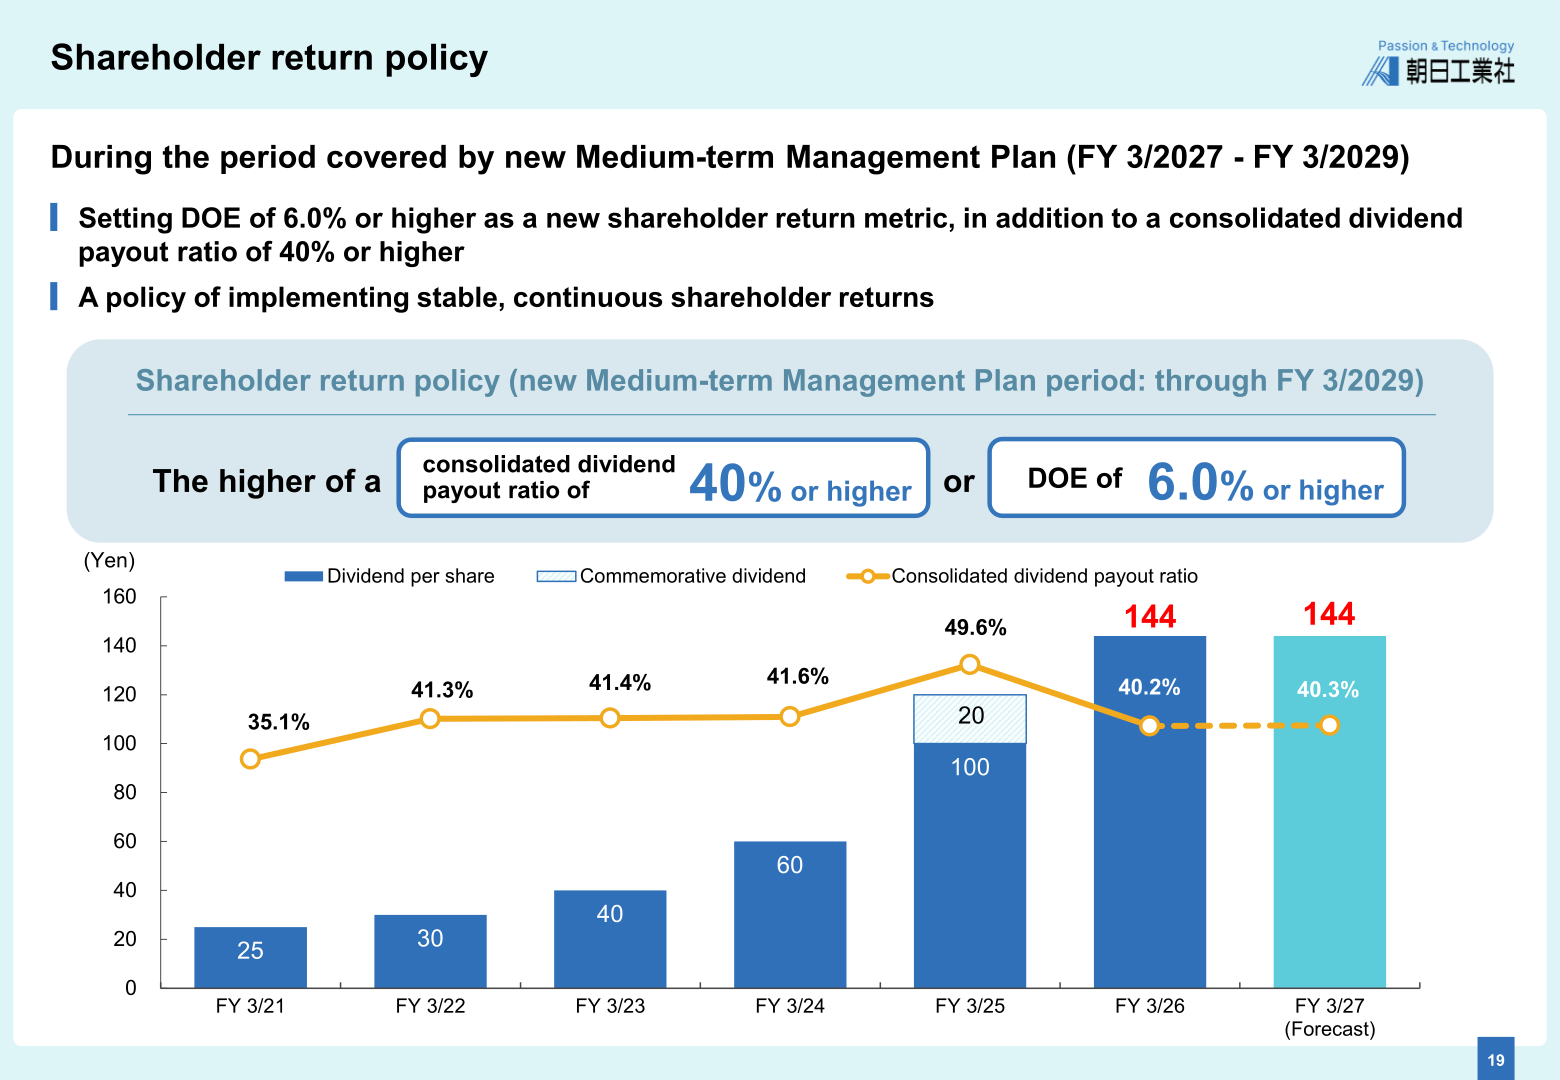
The annual dividend for the fiscal year ended March 2026 was 144.0 yen per share (ordinary dividend), against a total of 120.0 yen per share in the previous fiscal year, which had included a 50.0 yen extraordinary dividend and a 20.0 yen commemorative dividend paid to mark the 100th anniversary of the company’s founding. For the fiscal year ending March 2027, the annual dividend is planned at 144.0 yen per share, unchanged from the previous year, and the company states the payout ratio will be maintained in the 40% range. Earnings per share is expected to remain broadly flat year on year.
| Item | FY 3/26 (A) | FY 3/27 initial forecast (B) | Difference B – A | Change (%) |
|---|---|---|---|---|
| Earnings per share (yen) | 358.13 | 357.48 | (0.65) | (0.2) |
| Dividend per share – ordinary dividend (yen) | 144.0 | 144.0 | ‐ | ‐ |
| Dividend per share – total (yen) | 144.0 | 144.0 | 0 | ‐ |
| Total dividends paid (million yen) | 3,720 | 3,726 | 6 | 0.2 |
| Dividend payout ratio (%) | 40.2 | 40.3 | 0.1pt | ‐ |
For the period covered by the new Medium-term Management Plan (FY 3/2027 – FY 3/2029), the company has set DOE of 6.0% or higher as a new shareholder return metric in addition to a consolidated dividend payout ratio of 40% or higher, applying the higher of the two, under a policy of implementing stable, continuous shareholder returns. The number of shareholders at fiscal year-end was 7,264 and the share price at fiscal year-end was 3,410 yen.
Medium-Term Plan and Topics
The company says that by steadily executing the 18th Medium-term Management Plan strategy of Strengthening Profitability and Improving Productivity, it achieved record-high profits for three consecutive fiscal years, and that in FY 3/2027 it plans to achieve record profits for the fourth year in a row, aiming for further growth under the new Medium-term Management Plan. As a topic, the company announced that a new corporate analysis report from Shared Research Inc. is scheduled for release on June 17, 2026 (tentative), covering its lines of business, growth strategies, and an analysis of its strengths and weaknesses.
On the business structure, consolidated net sales of 104,823 million yen for FY 3/26 comprised the Installation Work Division at 99,141 million yen (94.6%) and the Equipment Division at 5,681 million yen (5.4%). Within the Installation Work Division, production environment facilities accounted for 47.9% of net sales by business domain in FY 3/2026, followed by living/cultural environment facilities at 17.2% and business environment facilities at 16.5%. Within the Equipment Division, FPD-related products accounted for 68.3% of sales, semiconductor-related for 25.3%, and dryer-related and others for 6.4%.
This article is an analysis based on publicly available information and is not a recommendation to buy or sell any specific securities. Investment decisions are your own responsibility.
















