
This article is based on publicly available IR materials and is not a recommendation to buy or sell any specific securities.
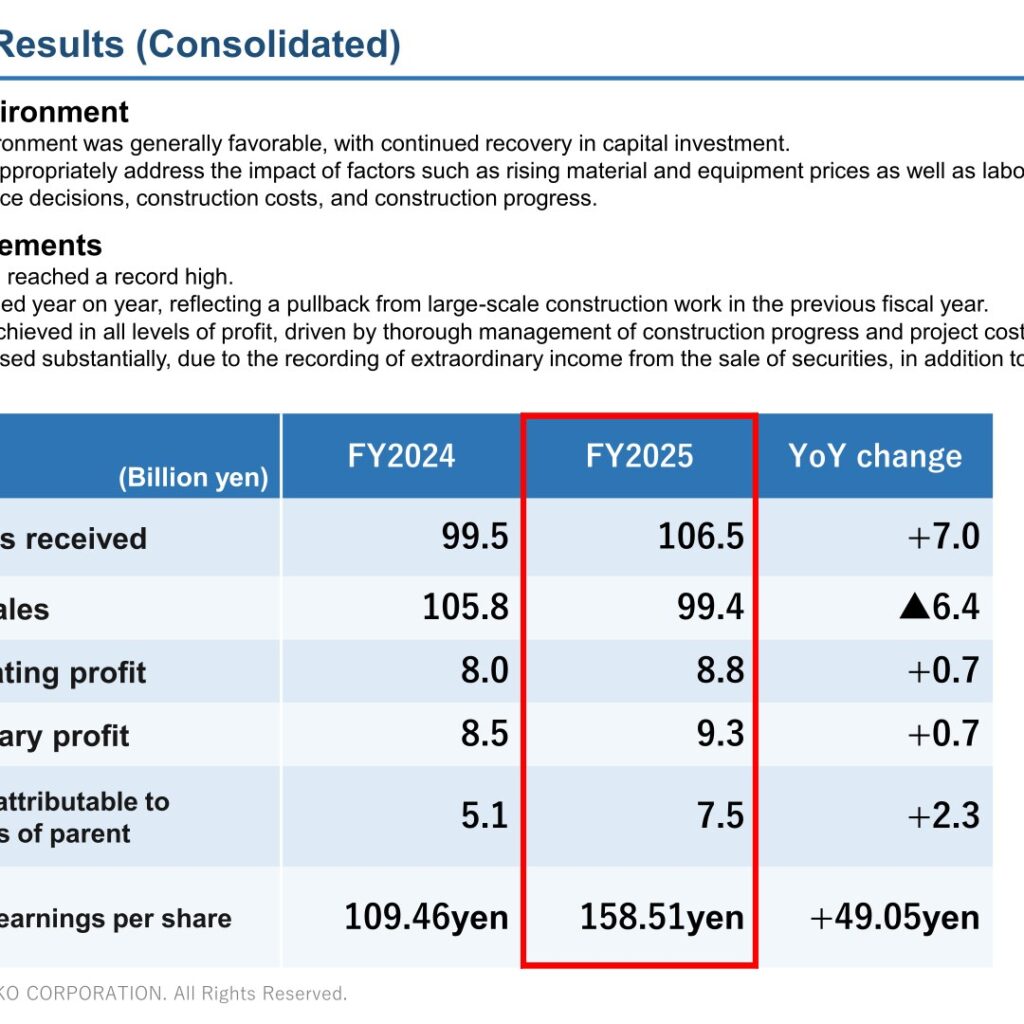
YONDENKO CORPORATION (TSE Prime Market: 1939) released its FY2025 Financial Results Briefing Materials in May 2026, covering the fiscal year ended March 31, 2026, which the company labels FY2025. Consolidated orders received reached a record high of 106.5 billion yen, up 7.0 billion yen year on year, while net sales declined to 99.4 billion yen, down 6.4 billion yen, reflecting a pullback from large-scale construction work completed in the previous fiscal year. Record highs were achieved at all levels of profit, driven by thorough management of construction progress and project costs, with profit attributable to owners of parent rising to 7.5 billion yen on the back of extraordinary income from the sale of securities.
Consolidated Results (Full-Year Actual)
The company describes the order environment as generally favorable, with continued recovery in capital investment, while noting that it is necessary to appropriately address the impact of factors such as rising material and equipment prices as well as labor shortages on order acceptance decisions, construction costs, and construction progress. Operating profit rose to 8.8 billion yen and ordinary profit to 9.3 billion yen, both up 0.7 billion yen year on year. Basic earnings per share increased by 49.05 yen to 158.51 yen.
| Item (Billion yen) | FY2024 | FY2025 | YoY change |
|---|---|---|---|
| Orders received | 99.5 | 106.5 | +7.0 |
| Net sales | 105.8 | 99.4 | ▲6.4 |
| Operating profit | 8.0 | 8.8 | +0.7 |
| Ordinary profit | 8.5 | 9.3 | +0.7 |
| Profit attributable to owners of parent | 5.1 | 7.5 | +2.3 |
| Basic earnings per share | 109.46yen | 158.51yen | +49.05yen |
On a five-year view, the gross profit margin improved to 18.7% in FY2025 from 17.4% in FY2024, the operating profit margin to 8.9% from 7.6%, and ROE to 11.0% from 8.2%. Total assets stood at 103.8 billion yen as of March 31, 2026, up 4.2 billion yen, with net assets of 71.1 billion yen and an equity ratio of 68.4%, up 3.3 points. Cash flows from operating activities were 4.0 billion yen against negative 0.5 billion yen a year earlier, and cash and cash equivalents at the end of the period were 17.5 billion yen.
Orders and Net Sales by Type of Construction (Non-consolidated)
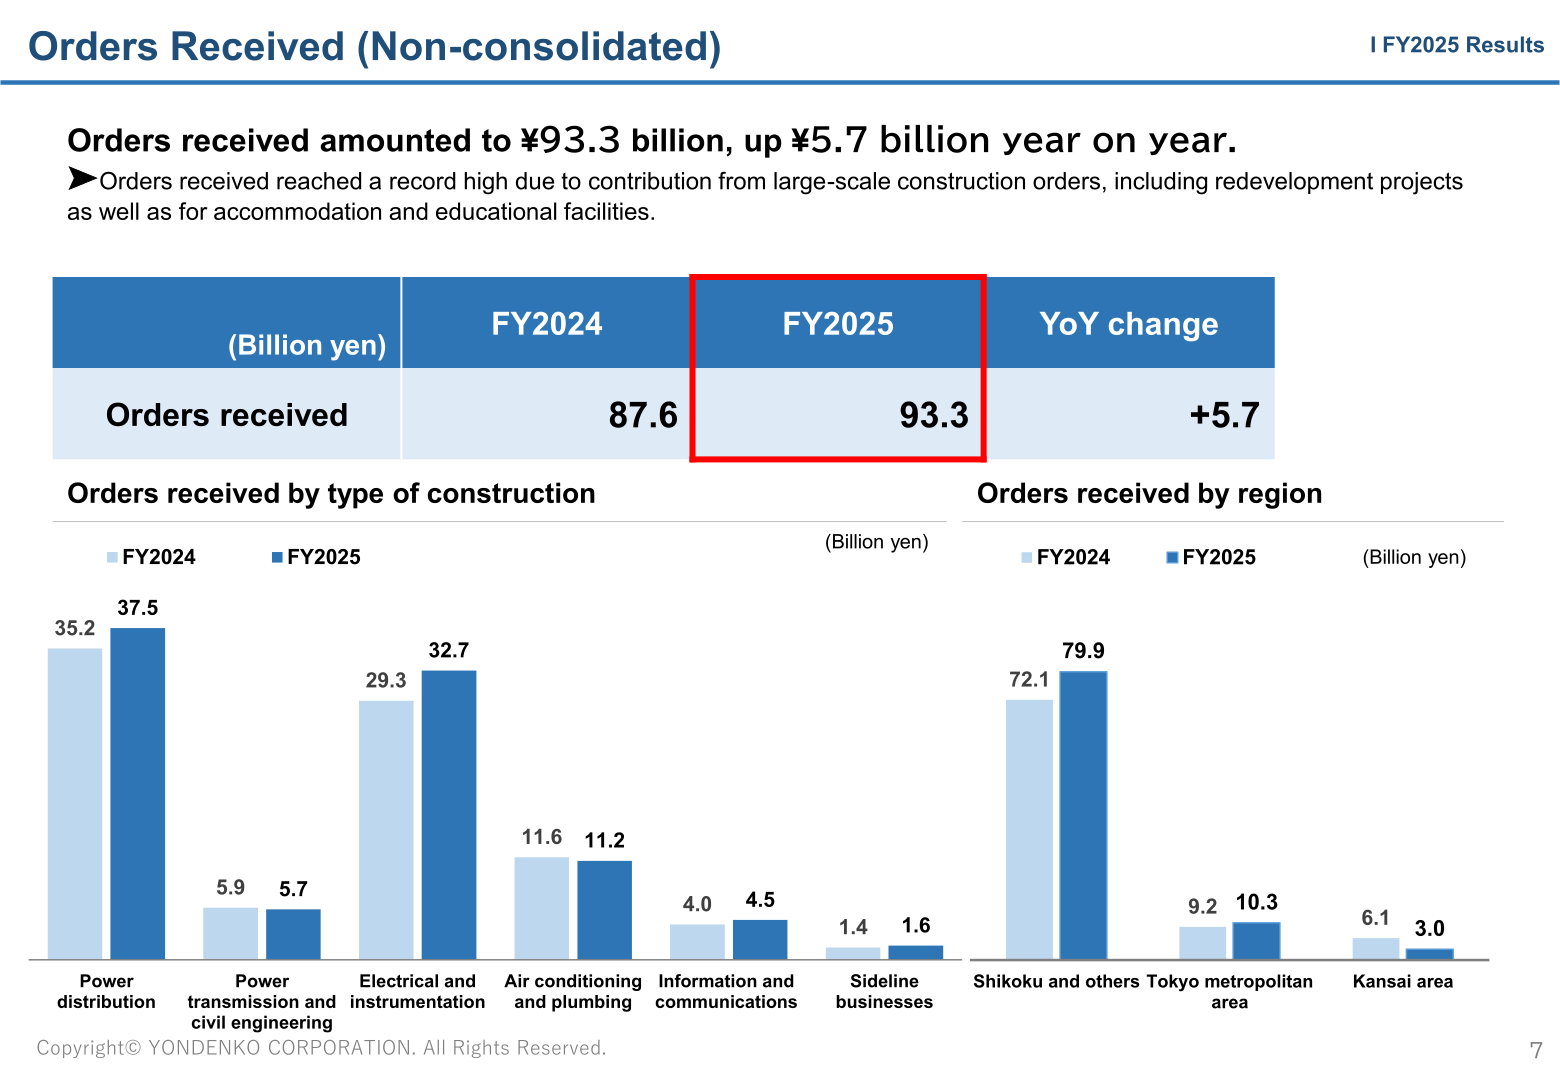
On a non-consolidated basis, orders received amounted to 93.3 billion yen, up 5.7 billion yen year on year and a record high, with the company citing contributions from large-scale construction orders including redevelopment projects as well as accommodation and educational facilities. Non-consolidated net sales were 84.0 billion yen, down 10.0 billion yen, impacted by a reactionary decline from large-scale construction work in the previous fiscal year; the materials explain that whereas net sales were boosted in the previous fiscal year by the completion of large construction projects, FY2025 marks the initial stages of newly started large-scale projects. Net sales of construction contracts carried forward rose 9.2 billion yen to 56.9 billion yen as of March 31, 2026.
| Type of construction (Billion yen) | Orders received FY2024 | Orders received FY2025 | Net sales FY2024 | Net sales FY2025 |
|---|---|---|---|---|
| Power distribution | 35.2 | 37.5 | 35.3 | 36.7 |
| Power transmission and civil engineering | 5.9 | 5.7 | 5.0 | 5.2 |
| Electrical and instrumentation | 29.3 | 32.7 | 35.5 | 26.5 |
| Air conditioning and plumbing | 11.6 | 11.2 | 10.8 | 9.2 |
| Information and communications | 4.0 | 4.5 | 5.8 | 4.6 |
| Sideline businesses | 1.4 | 1.6 | 1.4 | 1.6 |
| Total (Non-consolidated) | 87.6 | 93.3 | 94.1 | 84.0 |
By region, non-consolidated orders received in Shikoku and others rose to 79.9 billion yen from 72.1 billion yen and the Tokyo metropolitan area to 10.3 billion yen from 9.2 billion yen, while the Kansai area declined to 3.0 billion yen from 6.1 billion yen. Non-consolidated net sales by region were 72.3 billion yen in Shikoku and others, 8.0 billion yen in the Tokyo metropolitan area, and 3.6 billion yen in the Kansai area, against 75.7 billion yen, 12.4 billion yen and 5.8 billion yen respectively in FY2024.
Medium-Term Management Guidelines 2025 and Capital Profitability
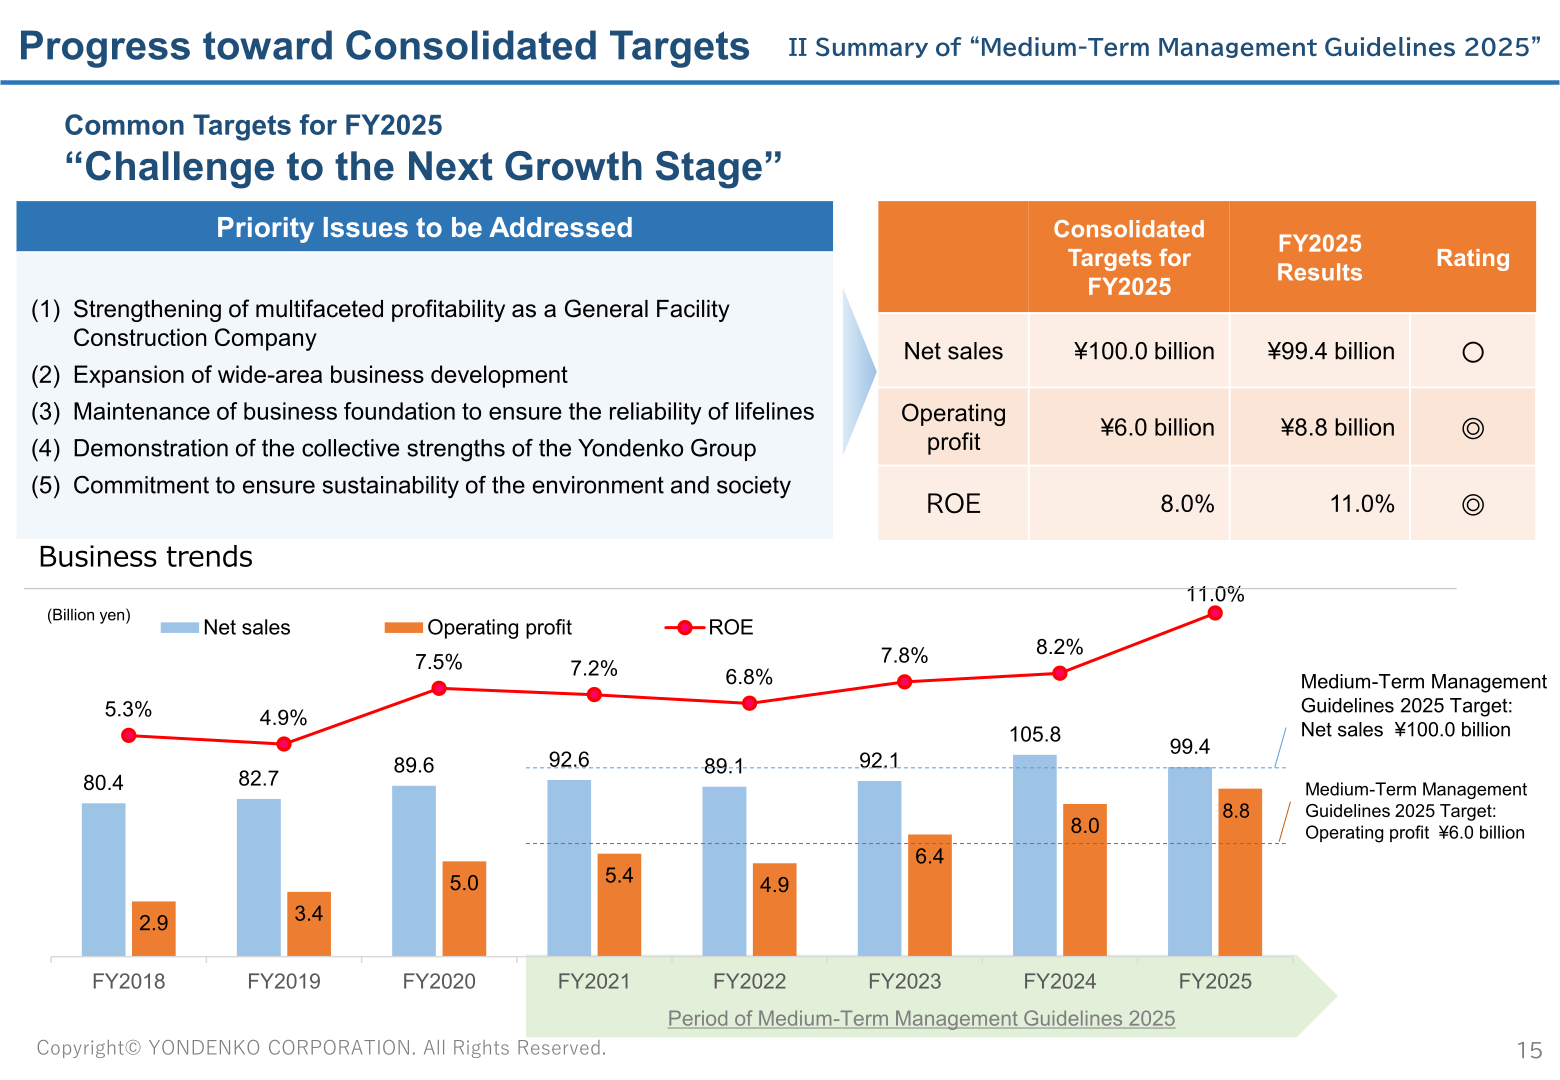
FY2025 was the final year of the “Medium-Term Management Guidelines 2025.” Against consolidated targets for FY2025 of net sales of 100.0 billion yen, operating profit of 6.0 billion yen and ROE of 8.0%, the company reported results of 99.4 billion yen (rated 〇), 8.8 billion yen (rated ◎) and 11.0% (rated ◎). Under the capital profitability initiatives announced in August 2023, FY2025 consolidated operating profit was 8,822 million yen, ordinary profit 9,327 million yen and profit attributable to owners of parent 7,500 million yen, with PBR at 1.23 times and ROE at 11.0%. Consolidated headcount rose to 2,805 as of April 2026 from 2,773 a year earlier, and the base pay increase and regular increment rate averaged 6.13% for FY2026.
In January 2026, the company announced a new five-year plan, the “Medium-Term Management Guidelines 2030,” under which it aims to secure stable revenue in the Shikoku region while significantly expanding the revenue base of facility construction in the Tokyo metropolitan and Kansai areas. FY2030 consolidated targets are net sales of 120.0 billion yen, operating profit of 11.0 billion yen and ROE of 10.0%.
Next-Year Forecast
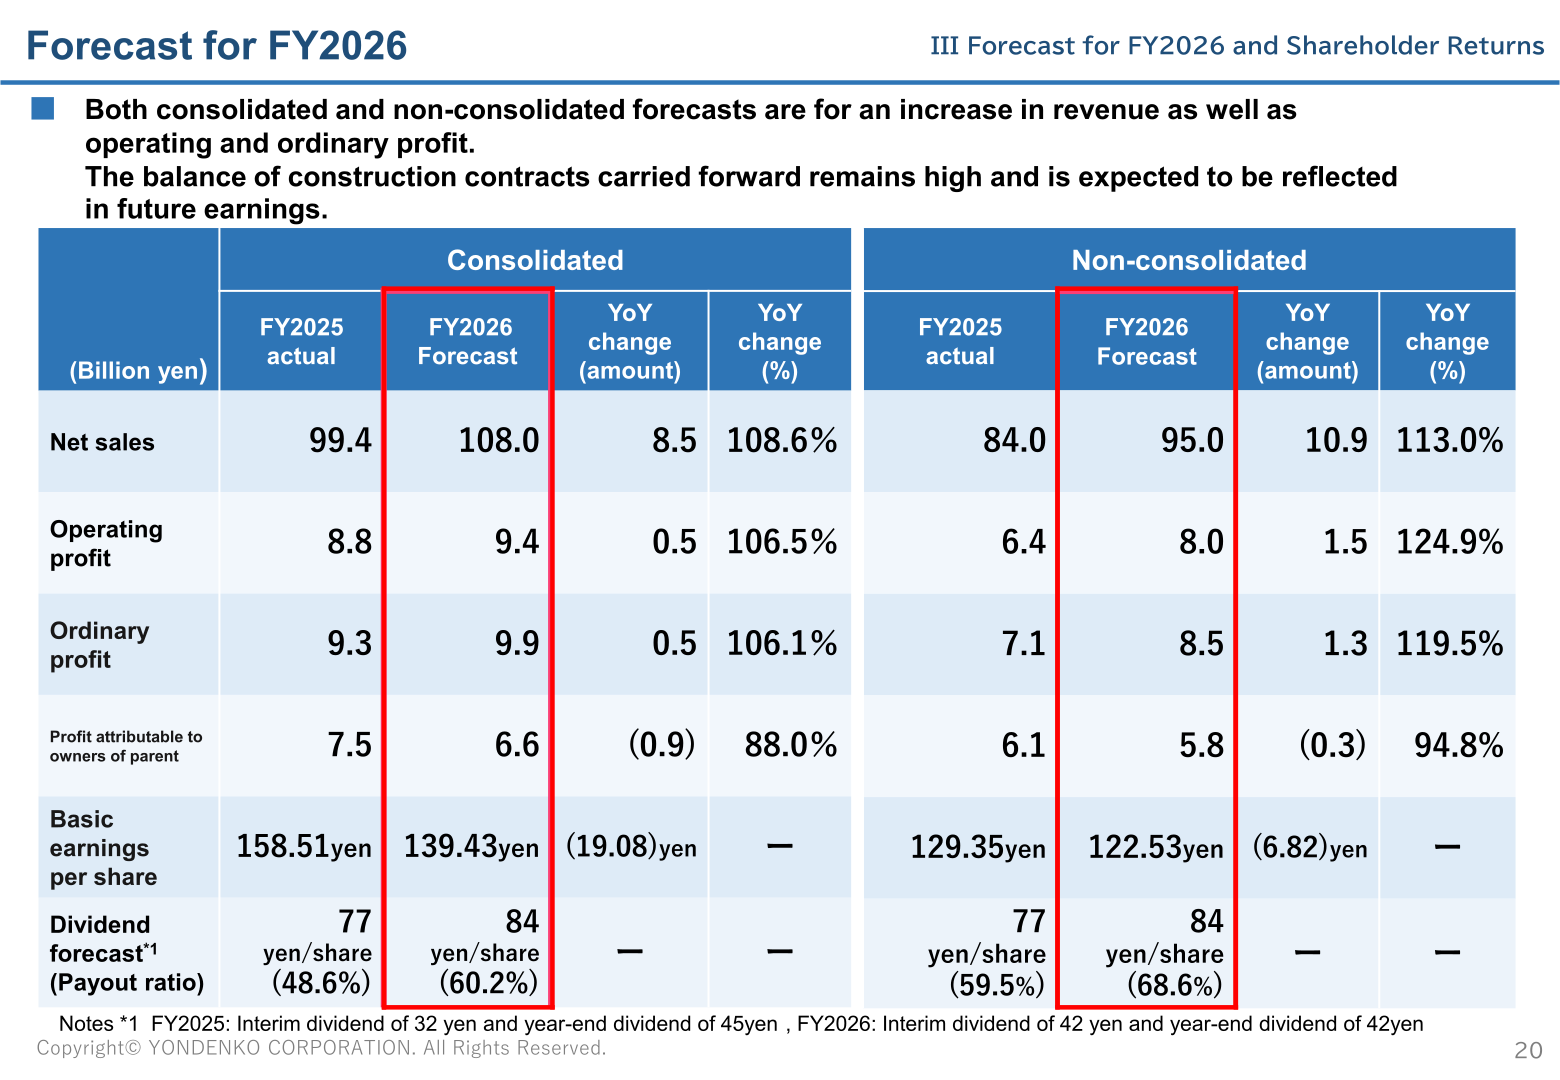
For FY2026, the company forecasts increases in revenue as well as operating and ordinary profit on both a consolidated and a non-consolidated basis, noting that the balance of construction contracts carried forward remains high and is expected to be reflected in future earnings. Consolidated net sales are forecast at 108.0 billion yen and operating profit at 9.4 billion yen, while profit attributable to owners of parent is projected to decline to 6.6 billion yen.
| Item (Billion yen) | Consolidated FY2025 actual | Consolidated FY2026 forecast | Non-consolidated FY2025 actual | Non-consolidated FY2026 forecast |
|---|---|---|---|---|
| Net sales | 99.4 | 108.0 | 84.0 | 95.0 |
| Operating profit | 8.8 | 9.4 | 6.4 | 8.0 |
| Ordinary profit | 9.3 | 9.9 | 7.1 | 8.5 |
| Profit attributable to owners of parent | 7.5 | 6.6 | 6.1 | 5.8 |
| Basic earnings per share | 158.51yen | 139.43yen | 129.35yen | 122.53yen |
Shareholder Returns
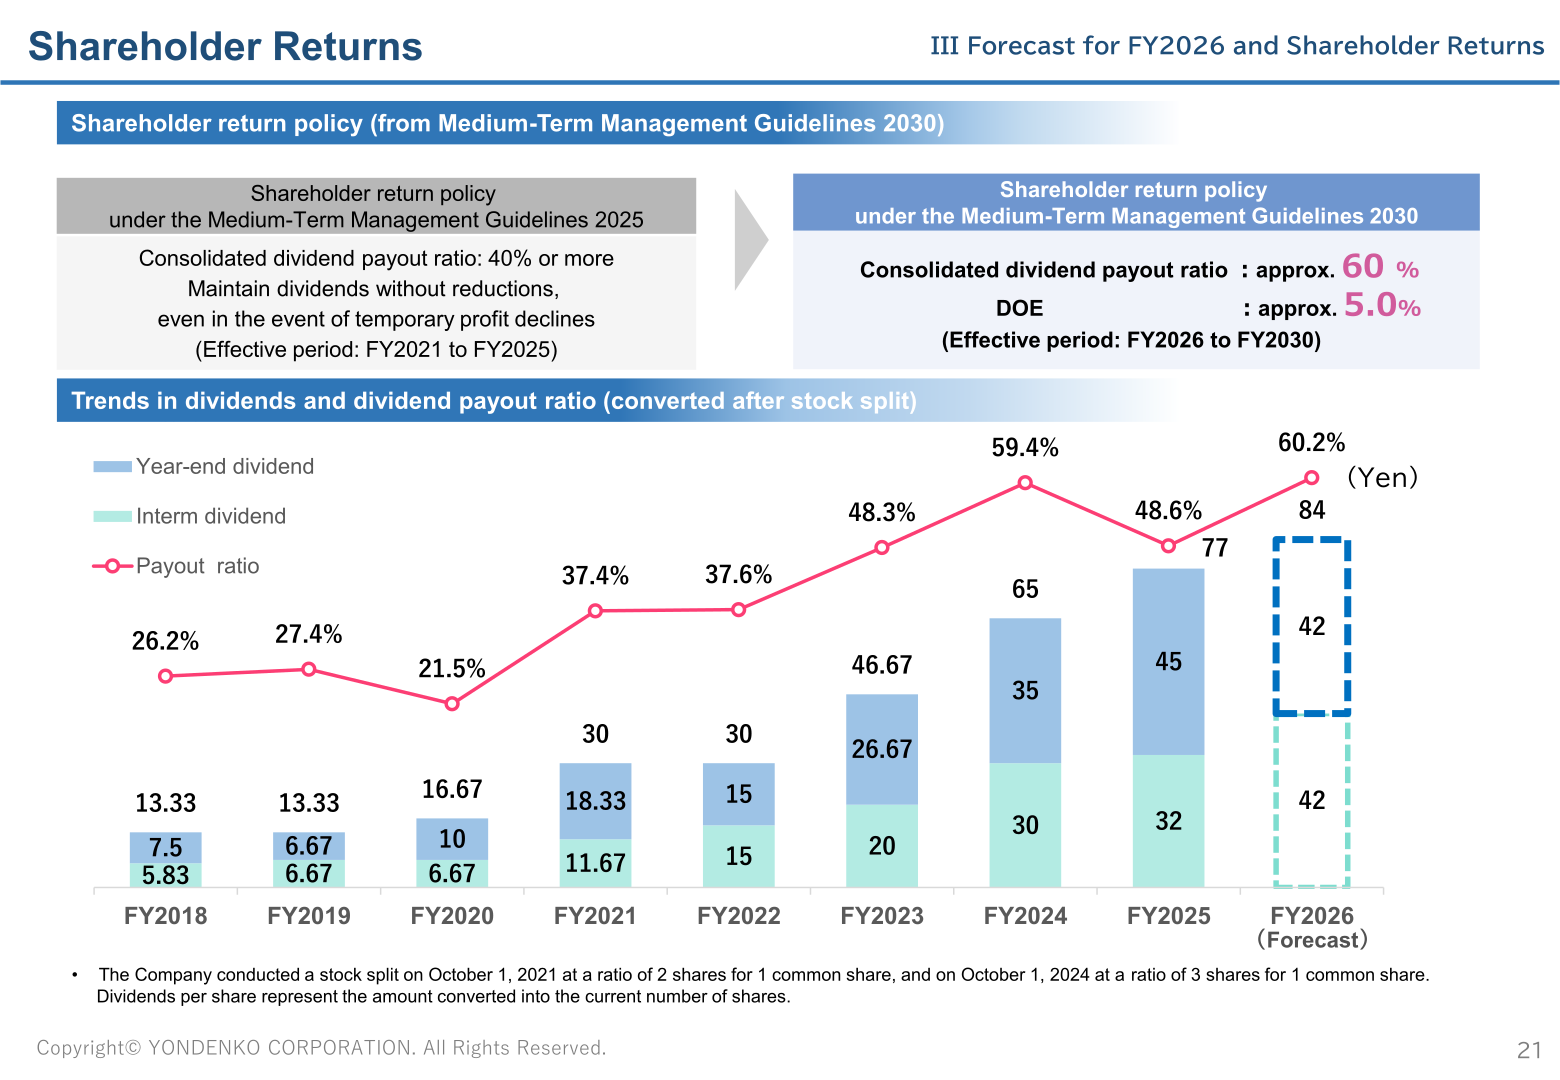
The FY2025 annual dividend was 77 yen per share, comprising an interim dividend of 32 yen and a year-end dividend of 45 yen, for a consolidated payout ratio of 48.6%. For FY2026 the company forecasts an annual dividend of 84 yen per share, made up of an interim dividend of 42 yen and a year-end dividend of 42 yen, for a payout ratio of 60.2%. The shareholder return policy under the Medium-Term Management Guidelines 2025 (effective FY2021 to FY2025) was a consolidated dividend payout ratio of 40% or more and maintaining dividends without reductions even in the event of temporary profit declines; under the Medium-Term Management Guidelines 2030 (effective FY2026 to FY2030) the policy is a consolidated dividend payout ratio of approximately 60% and DOE of approximately 5.0%. Dividends per share represent amounts converted into the current number of shares, following stock splits of 2 shares for 1 common share on October 1, 2021 and 3 shares for 1 common share on October 1, 2024.
| Dividends per share (Yen) | FY2024 | FY2025 | FY2026 (Forecast) |
|---|---|---|---|
| Interim dividend | 30 | 32 | 42 |
| Year-end dividend | 35 | 45 | 42 |
| Annual dividend | 65 | 77 | 84 |
| Consolidated dividend payout ratio | 59.4% | 48.6% | 60.2% |
This article is an analysis based on publicly available information and is not a recommendation to buy or sell any specific securities. Investment decisions are your own responsibility.
















