
This article is based on publicly available IR materials and is not a recommendation to buy or sell any specific securities.
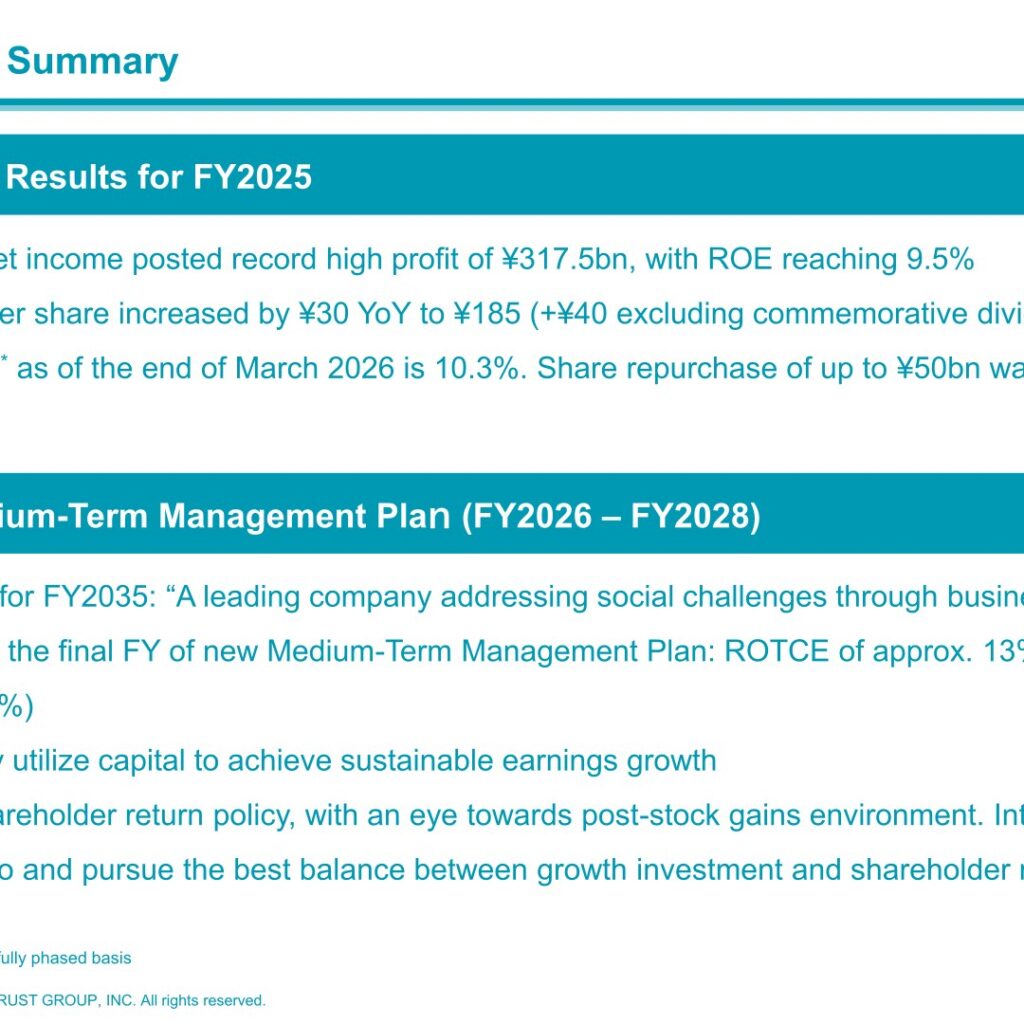
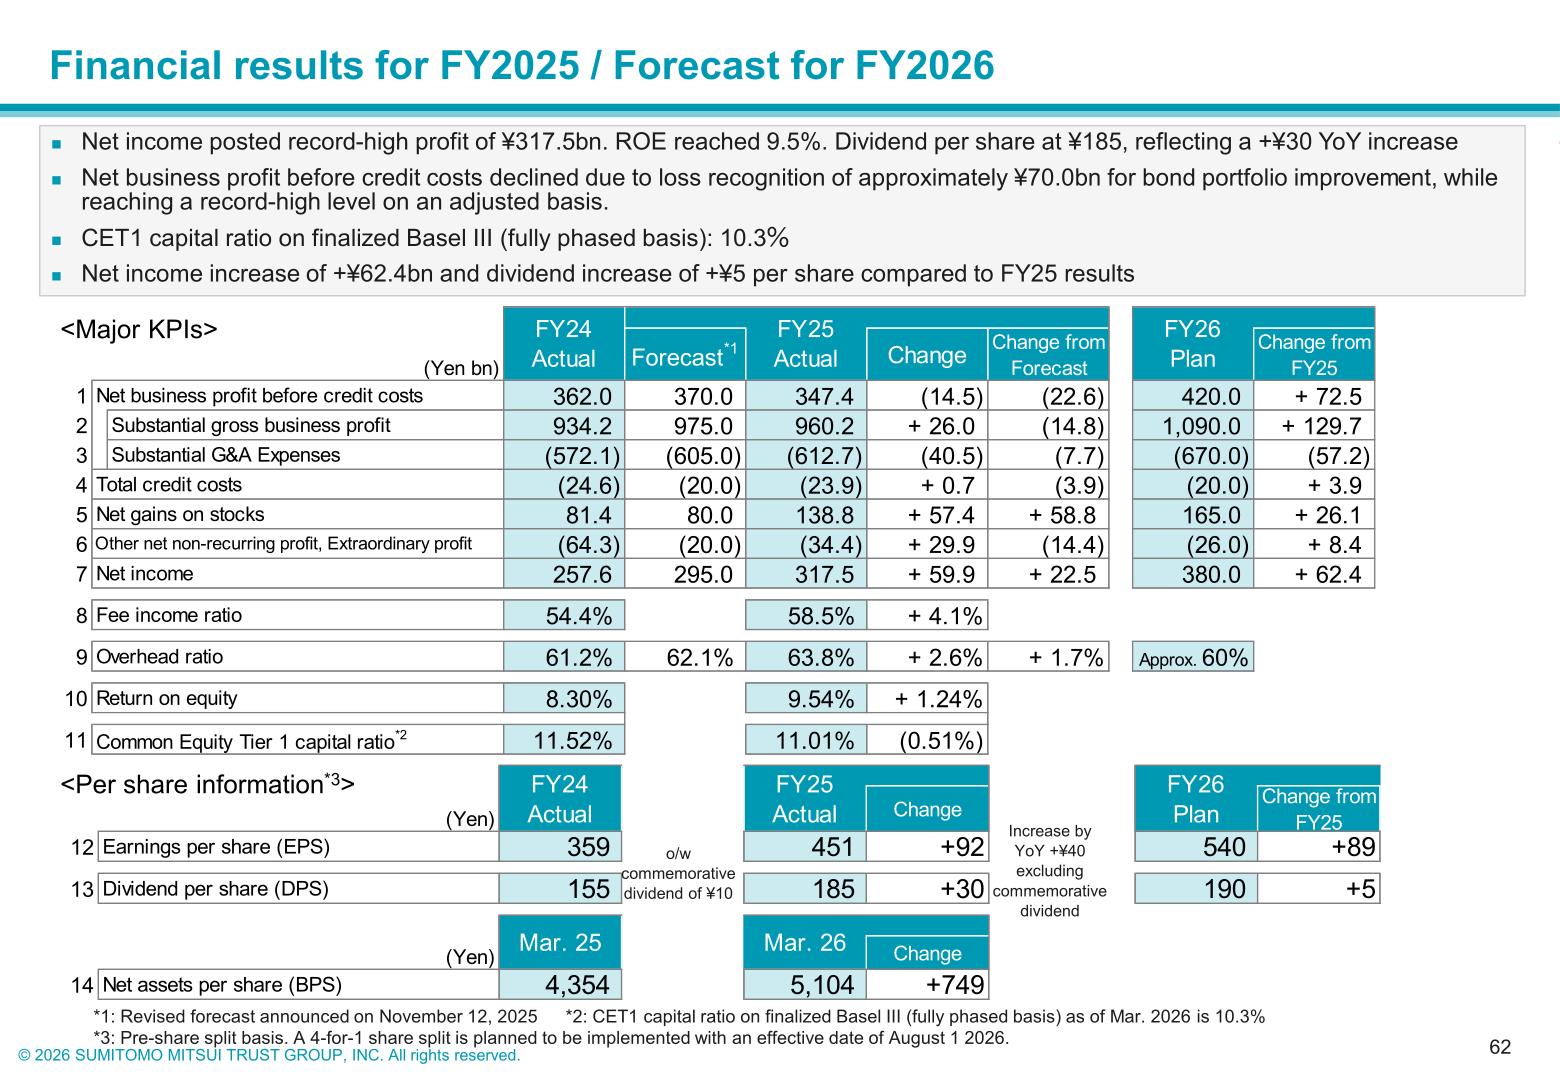
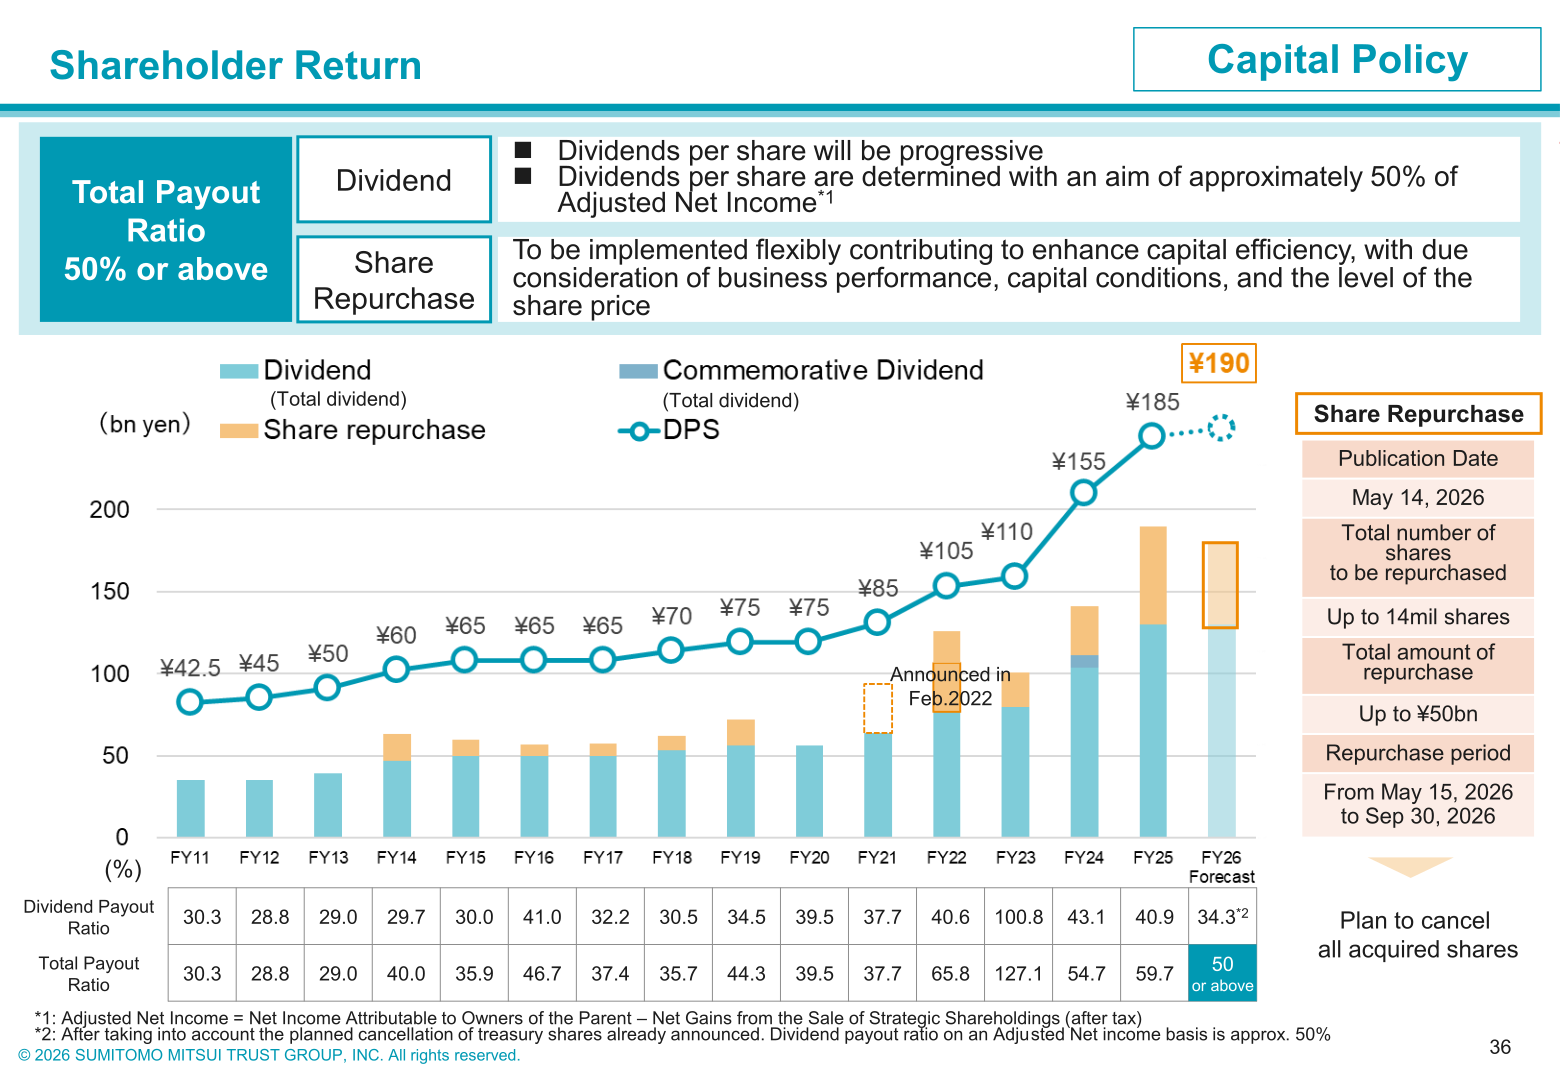
Sumitomo Mitsui Trust Group, Inc. (8309) reported FY2025 (fiscal year ended March 31, 2026) consolidated net income attributable to owners of the parent of ¥317.5bn, a record-high profit and an increase of ¥59.9bn year-on-year, with return on equity (ROE) reaching 9.5% (9.54%). Net business profit before credit costs was ¥347.4bn, down ¥14.5bn year-on-year, reflecting a loss recognition of approximately ¥70.0bn associated with an improvement of the bond portfolio, while reaching a record-high level on an adjusted basis. The Common Equity Tier 1 (CET1) capital ratio on a finalized Basel III fully phased basis was 10.3% as of the end of March 2026. Dividend per share for FY2025 was ¥185 (+¥30 year-on-year, including a commemorative dividend of ¥10; +¥40 year-on-year excluding the commemorative dividend), and the company announced a share repurchase of up to ¥50.0bn (up to 14 million shares) to be executed from May 15, 2026 to September 30, 2026.
Consolidated Results (Full-Year Actual)
Net business profit before credit costs of ¥347.4bn declined ¥14.5bn year-on-year, primarily due to the loss recognition of approximately ¥70.0bn associated with the improvement of the bond portfolio to enhance future profitability. Substantial gross business profit rose ¥26.0bn year-on-year to ¥960.2bn, driven by growth in effective interest related earnings (+¥19.2bn, mainly reflecting the rise in domestic interest rates and higher earnings related to investment partnerships) and net fees and commissions and related profit (+¥52.9bn, driven by strong performance in asset management and asset administration businesses, stock transfer agency services, and corporate credit related business). Substantial G&A expenses increased ¥40.5bn year-on-year to ¥612.7bn due to higher IT system related costs and personnel expenses, in line with the initial plan. Net income increased ¥59.9bn year-on-year to a record-high ¥317.5bn, exceeding the revised forecast of ¥295.0bn (108% of target level), supported by net gains on stocks of ¥138.8bn, which included a gain on sales of strategic shareholdings of ¥161.6bn and realized losses from cancellation of bear funds of ¥(29.2)bn (hedging positions by bear funds have been reduced to zero). Total credit costs were ¥(23.9)bn, including approximately ¥8.0bn of special loan loss provision recorded to prepare for geopolitical risks.
| Item | FY2024 Actual | FY2025 Actual | Change |
|---|---|---|---|
| Net business profit before credit costs (Yen bn) | 362.0 | 347.4 | (14.5) |
| Substantial gross business profit (Yen bn) | 934.2 | 960.2 | +26.0 |
| Effective interest related earnings (Yen bn) | 374.9 | 394.1 | +19.2 |
| Net fees and commissions and related profit (Yen bn) | 508.5 | 561.5 | +52.9 |
| Other profit (Yen bn) | 50.6 | 4.5 | (46.1) |
| Substantial G&A expenses (Yen bn) | (572.1) | (612.7) | (40.5) |
| Total credit costs (Yen bn) | (24.6) | (23.9) | +0.7 |
| Net gains on stocks (Yen bn) | 81.4 | 138.8 | +57.4 |
| Other net non-recurring profit (Yen bn) | (51.1) | (60.9) | (9.8) |
| Ordinary profit (Yen bn) | 367.6 | 401.4 | +33.8 |
| Extraordinary profit (Yen bn) | (13.2) | 26.5 | +39.8 |
| Income before income taxes (Yen bn) | 354.4 | 428.0 | +73.6 |
| Total income taxes (Yen bn) | (95.2) | (107.5) | (12.2) |
| Net income (Yen bn) | 257.6 | 317.5 | +59.9 |
| Earnings per share, EPS (Yen, pre-share-split basis) | 359 | 451 | +92 |
| Dividend per share, DPS (Yen) | 155 | 185 | +30 |
| Fee income ratio | 54.4% | 58.5% | +4.1pt |
| Overhead ratio, OHR | 61.2% | 63.8% | +2.6pt |
| Return on equity, ROE | 8.30% | 9.54% | +1.24pt |
Capital Adequacy and Balance Sheet
As of the end of March 2026, total assets were ¥82,174.2bn (+¥3,927.1bn from March 2025), with loans and bills discounted of ¥33,277.3bn and deposits and NCD of ¥50,350.4bn. Net assets per share (BPS) increased ¥749 to ¥5,104. The Common Equity Tier 1 (CET1) capital ratio (transitional basis) was 11.01% as of March 2026, down 0.51 percentage points from March 2025, mainly due to an increase in credit risk-weighted assets resulting from growth in corporate credit. On a finalized Basel III fully phased basis, the CET1 capital ratio was 10.3% as of March 2026, down 0.3 percentage points from March 2025, and is expected to be 10.1% after completion of the announced share repurchase.
| Item | Mar.2025 | Mar.2026 | Change |
|---|---|---|---|
| Total assets (Yen bn) | 78,247.1 | 82,174.2 | +3,927.1 |
| Loans and bills discounted (Yen bn) | 32,206.9 | 33,277.3 | +1,070.3 |
| Securities (Yen bn) | 11,496.1 | 13,418.5 | +1,922.4 |
| Deposits and NCD (Yen bn) | 47,366.0 | 50,350.4 | +2,984.3 |
| Total net assets (Yen bn) | 3,127.3 | 3,590.9 | +463.6 |
| Net assets per share, BPS (Yen) | 4,354 | 5,104 | +749 |
| Loan-deposit ratio (SuMiTB) | 68.5% | 67.5% | (1.0pt) |
| NPL ratio (SuMiTB) | 0.3% | 0.2% | (0.1pt) |
| Common Equity Tier 1 capital ratio (transitional basis) | 11.52% | 11.01% | (0.51pt) |
| Total capital ratio | 14.34% | 13.69% | (0.65pt) |
| Total risk-weighted assets (Yen bn) | 23,132.7 | 25,794.3 | +2,661.5 |
Segment Results
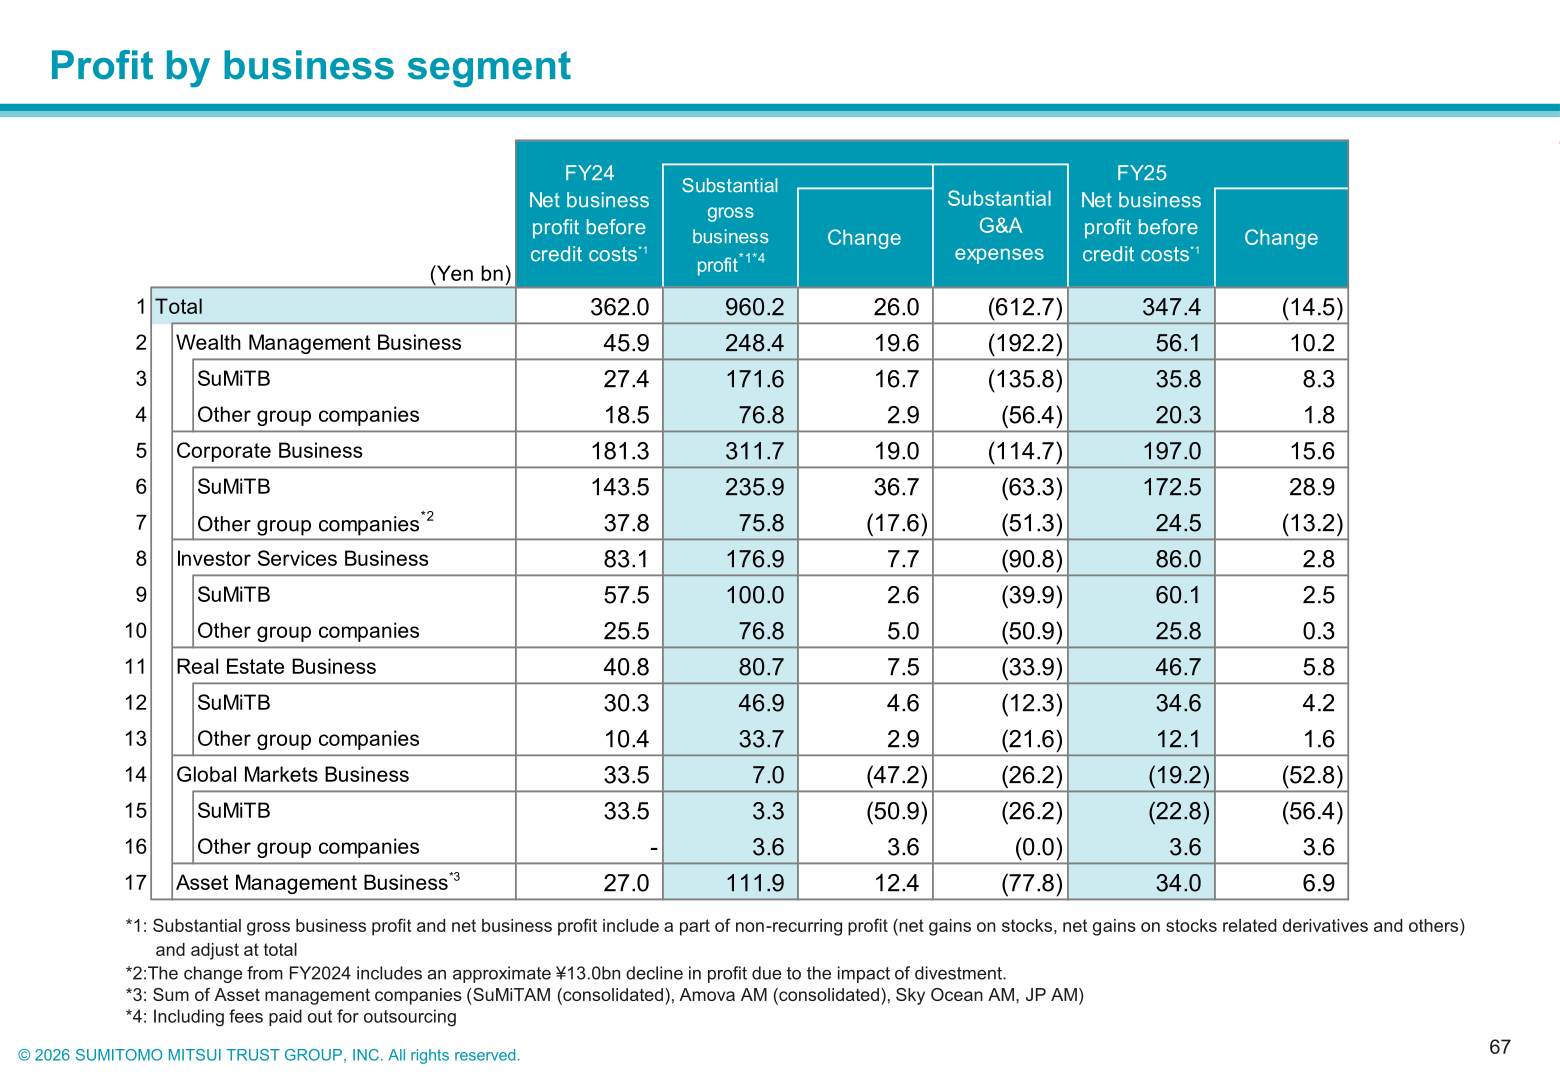
Effective from FY2026, the Group reorganized its business segments: the former “Investor Services Business” and “Asset Management Business” were integrated into a new “Asset Management Group,” and “SBI Sumishin Net Bank” was reclassified from “Others” to the “Wealth Management Business.” The FY2025 actual results below are presented on the previous segmentation basis. Corporate Business posted the largest net business profit before credit costs at ¥197.0bn (+¥15.6bn YoY), followed by Investor Services Business at ¥86.0bn (+¥2.8bn YoY) and Wealth Management Business at ¥56.1bn (+¥10.2bn YoY). Global Markets Business posted net business profit before credit costs of ¥(19.2)bn, down ¥52.8bn YoY, mainly reflecting the loss recognition associated with the improvement of the bond portfolio at SuMiTB.
| Business Segment | FY2024 | FY2025 | Change |
|---|---|---|---|
| Total (SuMiTG Consolidated) | 362.0 | 347.4 | (14.5) |
| Wealth Management Business | 45.9 | 56.1 | +10.2 |
| Corporate Business | 181.3 | 197.0 | +15.6 |
| Investor Services Business | 83.1 | 86.0 | +2.8 |
| Real Estate Business | 40.8 | 46.7 | +5.8 |
| Global Markets Business | 33.5 | (19.2) | (52.8) |
| Asset Management Business | 27.0 | 34.0 | +6.9 |
By group company, SuMiTB (non-consolidated) posted net business profit before credit costs of ¥244.5bn (down ¥44.3bn YoY, reflecting the bond portfolio loss recognition) and net income of ¥263.4bn (up ¥23.8bn YoY, including dividends from subsidiaries of ¥37.2bn). SuMi TRUST Panasonic Finance recorded net income of ¥16.0bn (+¥7.5bn YoY), mainly due to extraordinary profit from the share transfer of the North American railcar leasing business. SuMi TRUST Club posted a net loss of ¥(6.3)bn (down ¥7.4bn YoY), mainly due to an impairment loss on fixed assets.
| Group Company | Net Business Profit before Credit Costs FY2024 | FY2025 | Change |
|---|---|---|---|
| SuMiTB (non-consolidated) | 288.9 | 244.5 | (44.3) |
| SuMiTAM | 8.3 | 12.1 | +3.7 |
| Amova Asset Management (consolidated) | 18.1 | 21.4 | +3.3 |
| SuMi TRUST Realty | 9.5 | 11.0 | +1.5 |
| SuMi TRUST Panasonic Finance (consolidated) | 12.6 | 13.5 | +0.8 |
| Sumitomo Mitsui Trust Bank (U.S.A.) | 15.1 | 14.7 | (0.4) |
| Sumitomo Mitsui Trust (Hong Kong) | 3.3 | 3.4 | +0.1 |
| SuMi TRUST Guarantee (consolidated) | 11.0 | 10.8 | (0.2) |
| SuMi TRUST Club (consolidated) | 1.4 | 1.4 | (0.0) |
| SBI Sumishin Net Bank | 13.2 | 15.4 | +2.1 |
| UBS SuMi TRUST Wealth Management | 2.9 | 4.9 | +2.0 |
| Group Company | Net Income FY2024 | FY2025 | Change |
|---|---|---|---|
| SuMiTB (non-consolidated) | 239.5 | 263.4 | +23.8 |
| SuMiTAM | 5.7 | 7.7 | +1.9 |
| Amova Asset Management (consolidated) | 12.4 | 15.3 | +2.8 |
| SuMi TRUST Realty | 6.5 | 8.1 | +1.5 |
| SuMi TRUST Panasonic Finance (consolidated) | 8.4 | 16.0 | +7.5 |
| Sumitomo Mitsui Trust Bank (U.S.A.) | 11.8 | 11.5 | (0.2) |
| Sumitomo Mitsui Trust (Hong Kong) | 2.8 | 2.9 | +0.1 |
| SuMi TRUST Guarantee (consolidated) | 7.8 | 8.0 | +0.1 |
| SuMi TRUST Club (consolidated) | 1.1 | (6.3) | (7.4) |
| SBI Sumishin Net Bank | 9.6 | 11.0 | +1.4 |
| UBS SuMi TRUST Wealth Management | 2.3 | 3.9 | +1.5 |
Assets Under Management / Custody (AUM/AUC)
Assets under management (AUM) increased ¥27.2trn from March 2025 to ¥167.9trn as of March 2026, mainly due to growth in market value, with SuMiTAM AUM increasing ¥17.9trn to ¥111.8trn and Amova Asset Management AUM increasing ¥8.2trn to ¥43.1trn. Domestic assets under custody/administration (AUC) also grew, with investment trust AUC up ¥13.9trn to ¥120.7trn and non-investment trust AUC up ¥1.3trn to ¥101.1trn. Assets Under Fiduciary (AUF), a group-wide KPI encompassing AUM, AUC and other entrusted assets, reached approximately ¥750trn as of March 2026.
| Item | Mar.2025 | Mar.2026 | Change |
|---|---|---|---|
| Assets under management, AUM total (Yen trn) | 140.6 | 167.9 | +27.2 |
| AUM: SuMiTB (Yen trn) | 11.7 | 12.9 | +1.1 |
| o/w Private asset (Yen trn) | 8.8 | 9.9 | +0.8 |
| AUM: SuMiTAM (Yen trn) | 93.9 | 111.8 | +17.9 |
| AUM: Amova AM (Yen trn) | 34.9 | 43.1 | +8.2 |
| Domestic AUC: Investment trust (Yen trn) | 106.7 | 120.7 | +13.9 |
| Domestic AUC: Non investment trust (Yen trn) | 99.8 | 101.1 | +1.3 |
| Overseas AUC: Global custody (USD 10bn) | 42.7 | 46.6 | +3.8 |
| Overseas AUC: Fund administration (USD 10bn) | 10.3 | 11.6 | +1.2 |
FY2026 Forecast
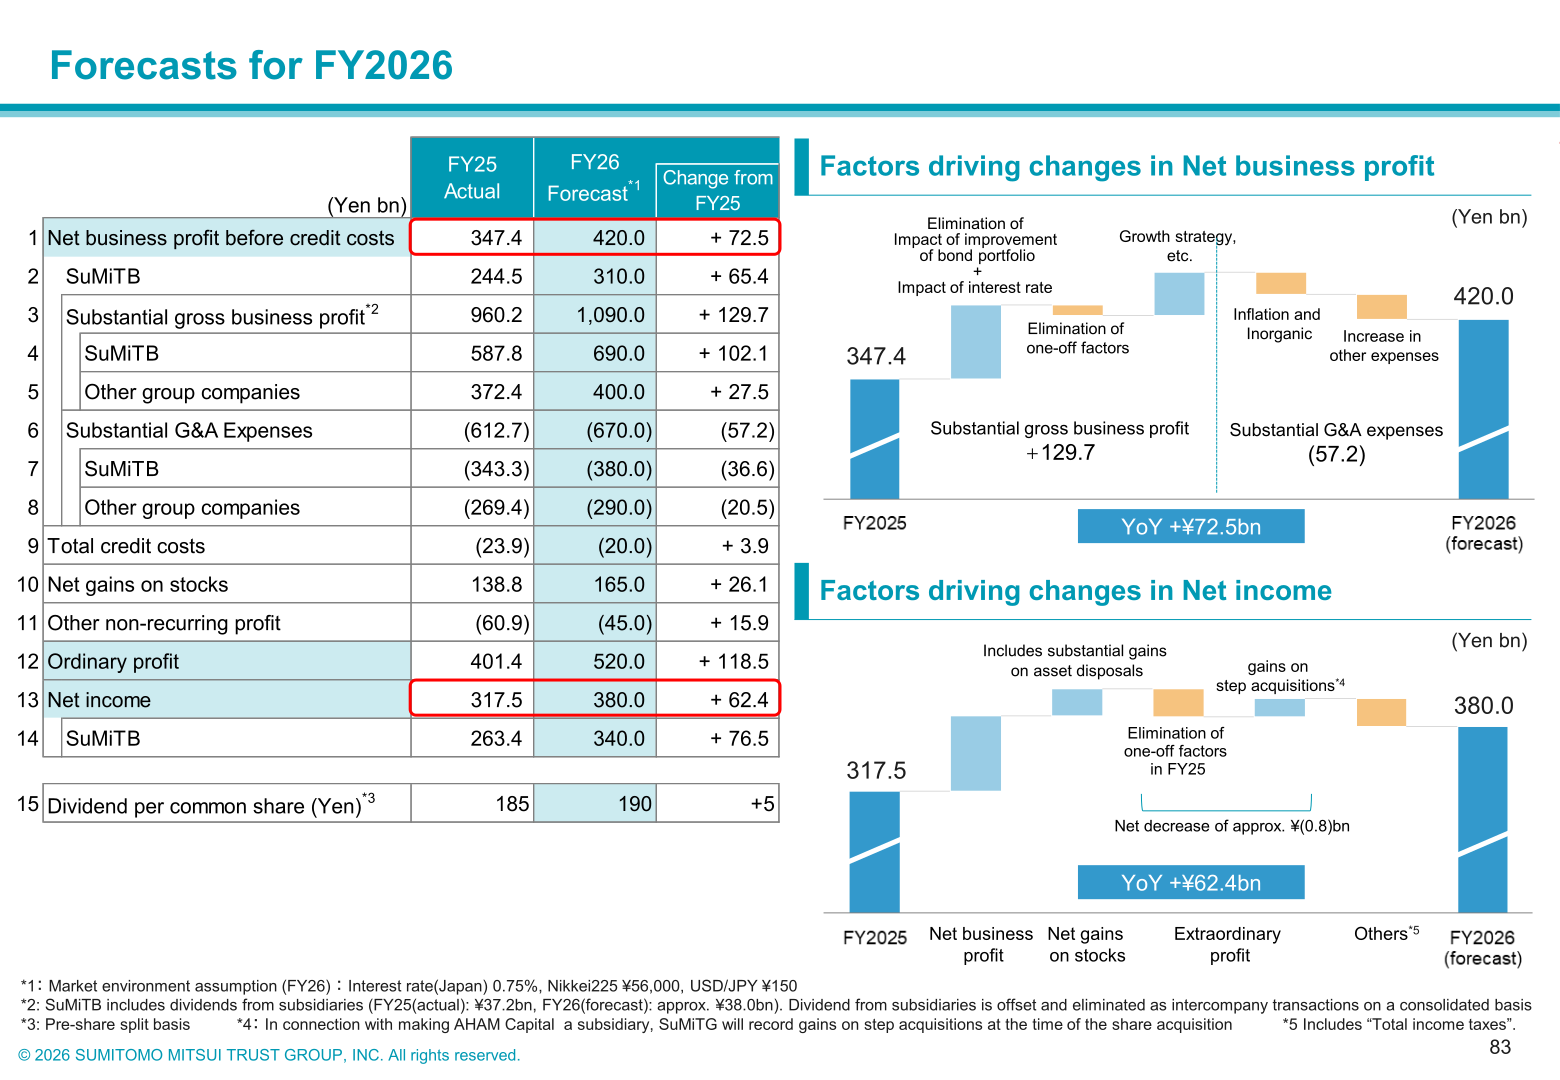
For FY2026, the Group forecasts net business profit before credit costs of ¥420.0bn (+¥72.5bn YoY) and net income of ¥380.0bn (+¥62.4bn YoY), based on market environment assumptions of a Japan policy interest rate of 0.75%, Nikkei 225 at ¥56,000, and USD/JPY at ¥150. Substantial gross business profit is forecast to grow to ¥1,090.0bn (+¥129.7bn YoY), while substantial G&A expenses are forecast to increase to ¥670.0bn (+¥57.2bn YoY). By business segment (new segmentation), net business profit before credit costs is forecast at ¥77.0bn for Wealth Management Business, ¥188.0bn for Corporate Business, ¥122.0bn for Asset Management Group, ¥48.0bn for Real Estate Business, and ¥58.0bn for Global Markets Business. Dividend per share for FY2026 is forecast at ¥190 (+¥5 YoY, pre-share-split basis).
| Item | FY2025 Actual | FY2026 Forecast | Change |
|---|---|---|---|
| Net business profit before credit costs (Yen bn) | 347.4 | 420.0 | +72.5 |
| Substantial gross business profit (Yen bn) | 960.2 | 1,090.0 | +129.7 |
| Substantial G&A expenses (Yen bn) | (612.7) | (670.0) | (57.2) |
| Total credit costs (Yen bn) | (23.9) | (20.0) | +3.9 |
| Net gains on stocks (Yen bn) | 138.8 | 165.0 | +26.1 |
| Other non-recurring profit (Yen bn) | (60.9) | (45.0) | +15.9 |
| Ordinary profit (Yen bn) | 401.4 | 520.0 | +118.5 |
| Net income (Yen bn) | 317.5 | 380.0 | +62.4 |
| Dividend per common share (Yen, pre-share-split basis) | 185 | 190 | +5 |
New Medium-Term Management Plan (FY2026–FY2028) and FY2028 Targets
The New Medium-Term Management Plan (FY2026–FY2028), themed “Shaping the Future through Bold Challenges,” sets an aspiration for FY2035 of becoming “a leading company addressing social challenges through business,” targeting ROTCE of 16% (ROE of 12%) and net business profit before credit costs of ¥1trn (a CAGR of +11% from FY2025 to FY2035). For the final year of the new plan (FY2028), the Group targets ROTCE of approximately 13% (ROE of approximately 11%) and net income of ¥410.0bn, up from the FY2025 actual of ROTCE 9.9% (ROE 9.5%) and net income of ¥317.5bn. Cumulative capital allocation over FY2026–FY2028 comprises profit accumulation of approximately ¥900.0bn (net income excluding net gains on stocks) and capital creation of ¥300.0bn or above (through reduction of strategic shareholdings and low-profitability corporate lending), to be allocated to growth investment of ¥600.0bn or above (organic and inorganic) and shareholder return of ¥600.0bn or above, under a commitment to a total payout ratio of 50% or above. Key growth strategies are Enhancement of Asset Management Business, Balance Sheet Transformation, and Enhancement of Wealth Management Business, targeting substantial gross business profit growth from ¥960.2bn (FY2025) to ¥1,235.0bn (FY2028).
| KPI | FY2025 Actual | FY2026 Forecast | FY2028 Target | By FY2035 Aspiration |
|---|---|---|---|---|
| ROTCE (ROE) | 9.9% (9.5%) | Upper 11% range (Mid-10% range) | Approx. 13% (Approx. 11%) | 16% (12%) |
| Substantial gross business profit (Yen bn) | 960.2 | 1,090.0 | 1,235.0 | – |
| Net business profit (Yen bn) | 347.4 | 420.0 | 500.0 | ¥1trn |
| Net income (Yen bn) | 317.5 | 380.0 | 410.0 | – |
| Overhead ratio, OHR | 63.8% | Approx. 60% | Below 60% | Low-50% range |
| Fee income ratio | 58.5% | Mid-50% range | Mid-50% range | 60% |
| CET1 ratio (finalized Basel III, fully phased basis) | 10.3% | Stably maintain 10% or above | Stably maintain 10% or above | Stably maintain 10% or above |
Shareholder Returns
The Group revised its shareholder return policy in anticipation of a post-stock-gains environment, committing to a total payout ratio of 50% or above, comprising a progressive dividend targeting approximately 50% of Adjusted Net income (Net income minus net gains from the sale of strategic shareholdings, after tax) as a guideline, plus flexible share repurchases implemented with due consideration of business performance, capital conditions, and share price levels. Based on the FY2026 earnings forecast, this policy implies net income of ¥380.0bn, net gains from sale of strategic shareholdings (after tax) of ¥113.0bn, and Adjusted Net income of ¥267.0bn, leading to an estimated dividend of approximately ¥133.5bn and share repurchase of above ¥56.5bn, for total shareholder return of above ¥190.0bn. Separately, on May 14, 2026, the Group announced a share repurchase of up to 14 million shares for a total amount of up to ¥50.0bn, to be executed from May 15, 2026 to September 30, 2026, with a plan to cancel all acquired shares. For the previous Medium-Term Management Plan (FY2023–FY2025), the dividend payout ratio target of 40% or above was achieved with an actual result of 40.9%.
| Item | FY2026 Forecast-based Image |
|---|---|
| Net income | ¥380.0bn |
| Net gains from sale of strategic shareholdings (after tax) | ¥113.0bn |
| Adjusted Net income | ¥267.0bn |
| Dividend (approx. 50% of Adjusted Net income) | Approx. ¥133.5bn |
| Share repurchase | Above ¥56.5bn |
| Total shareholder return | Above ¥190.0bn |
| Total payout ratio | 50% or above |
Topics: Reduction of Strategic Shareholdings
The Group raised its FY2025–FY2028 cumulative cost-basis reduction target for strategic shareholdings by ¥40.0bn, from ¥260.0bn to ¥300.0bn, aiming to bring the ratio of market value of strategic shareholdings to consolidated total net assets to less than 20% by the end of March 2029, down from 40.7% as of March 2026 and 68.0% as of March 2021. In FY2025, strategic shareholdings were reduced by ¥74.9bn on a cost basis, and the amount agreed to be sold in FY2026 had reached approximately ¥16.0bn as of the end of March 2026.
This article is an analysis based on publicly available information and is not a recommendation to buy or sell any specific securities. Investment decisions are your own responsibility.
![[Obayashi] Investors’ Guide 2026 — The Complete 24-Article Breakdown](https://japan-equity.com/wp-content/uploads/2026/07/hub_cover-1024x1024.png)
![[Obayashi] IR & SR Policy — Feeding Dialogue Back into Management](https://japan-equity.com/wp-content/uploads/2026/07/p32_sq-1024x1024.jpg)
![[Obayashi] Domestic Civil Engineering — Resilience Spending Supports 9.6% Margin](https://japan-equity.com/wp-content/uploads/2026/07/p11_sq-1024x1024.jpg)
![[Obayashi] Overseas Construction — Orders Reach ¥1.2tn](https://japan-equity.com/wp-content/uploads/2026/07/p15_sq-1024x1024.jpg)
![[Obayashi] Share Price & External Ratings — vs TOPIX, ESG Index Inclusion](https://japan-equity.com/wp-content/uploads/2026/07/p40_sq-1024x1024.jpg)
![[Construction] ¥75.5tn Investment, Shrinking Workforce — Big-5 Market Share](https://japan-equity.com/wp-content/uploads/2026/07/p12_sq-1024x1024.jpg)



![[Obayashi] Capital Policy & Shareholder Returns — ROE 10%+, DOE ~5%, ¥100bn Buyback](https://japan-equity.com/wp-content/uploads/2026/07/p27_sq-1024x1024.jpg)
![[Obayashi] Reducing Cross-Shareholdings — ¥285.2bn Sold in Five Years](https://japan-equity.com/wp-content/uploads/2026/07/p29_sq-1024x1024.jpg)
![[Obayashi] ¥750bn Investment Plan — ¥300bn to Development, ¥190bn to Tech/DX](https://japan-equity.com/wp-content/uploads/2026/07/p30_sq-1024x1024.jpg)
![[Obayashi] MTP2022 KPIs — Operating Profit ~2x Target, ROE 14.4%](https://japan-equity.com/wp-content/uploads/2026/07/p25_sq-1024x1024.jpg)
![[Obayashi] Cash Allocation — ¥420bn Investment CF Over Five Years](https://japan-equity.com/wp-content/uploads/2026/07/p26_sq-1024x1024.jpg)
![[Obayashi] Green Energy — 44 Plants, 344MW, and the Green Hydrogen Challenge](https://japan-equity.com/wp-content/uploads/2026/07/p21_sq-1024x1024.jpg)
![[Obayashi] Tackling the Labor Shortage — Robotics Construction®](https://japan-equity.com/wp-content/uploads/2026/07/p14_sq-1024x1024.jpg)
