
This article is based on publicly available IR materials and is not a recommendation to buy or sell any specific securities.
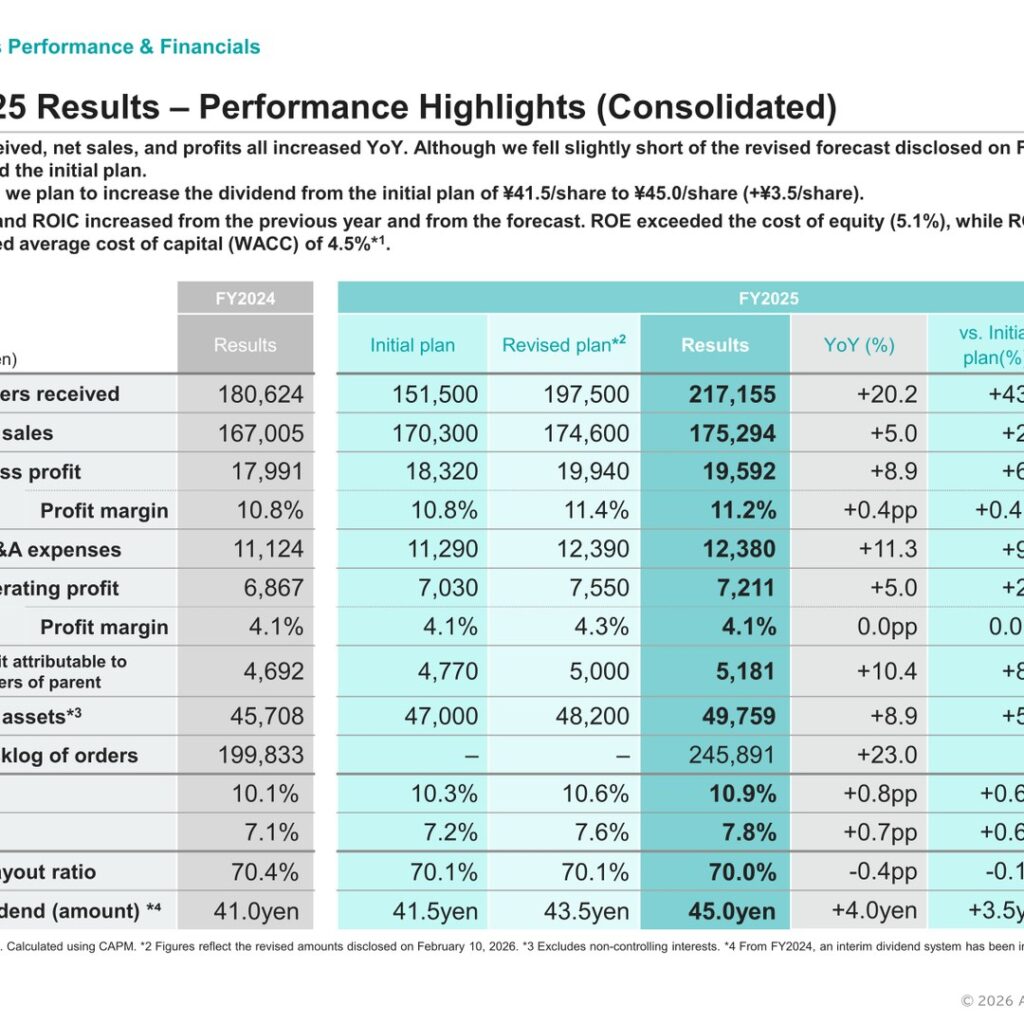
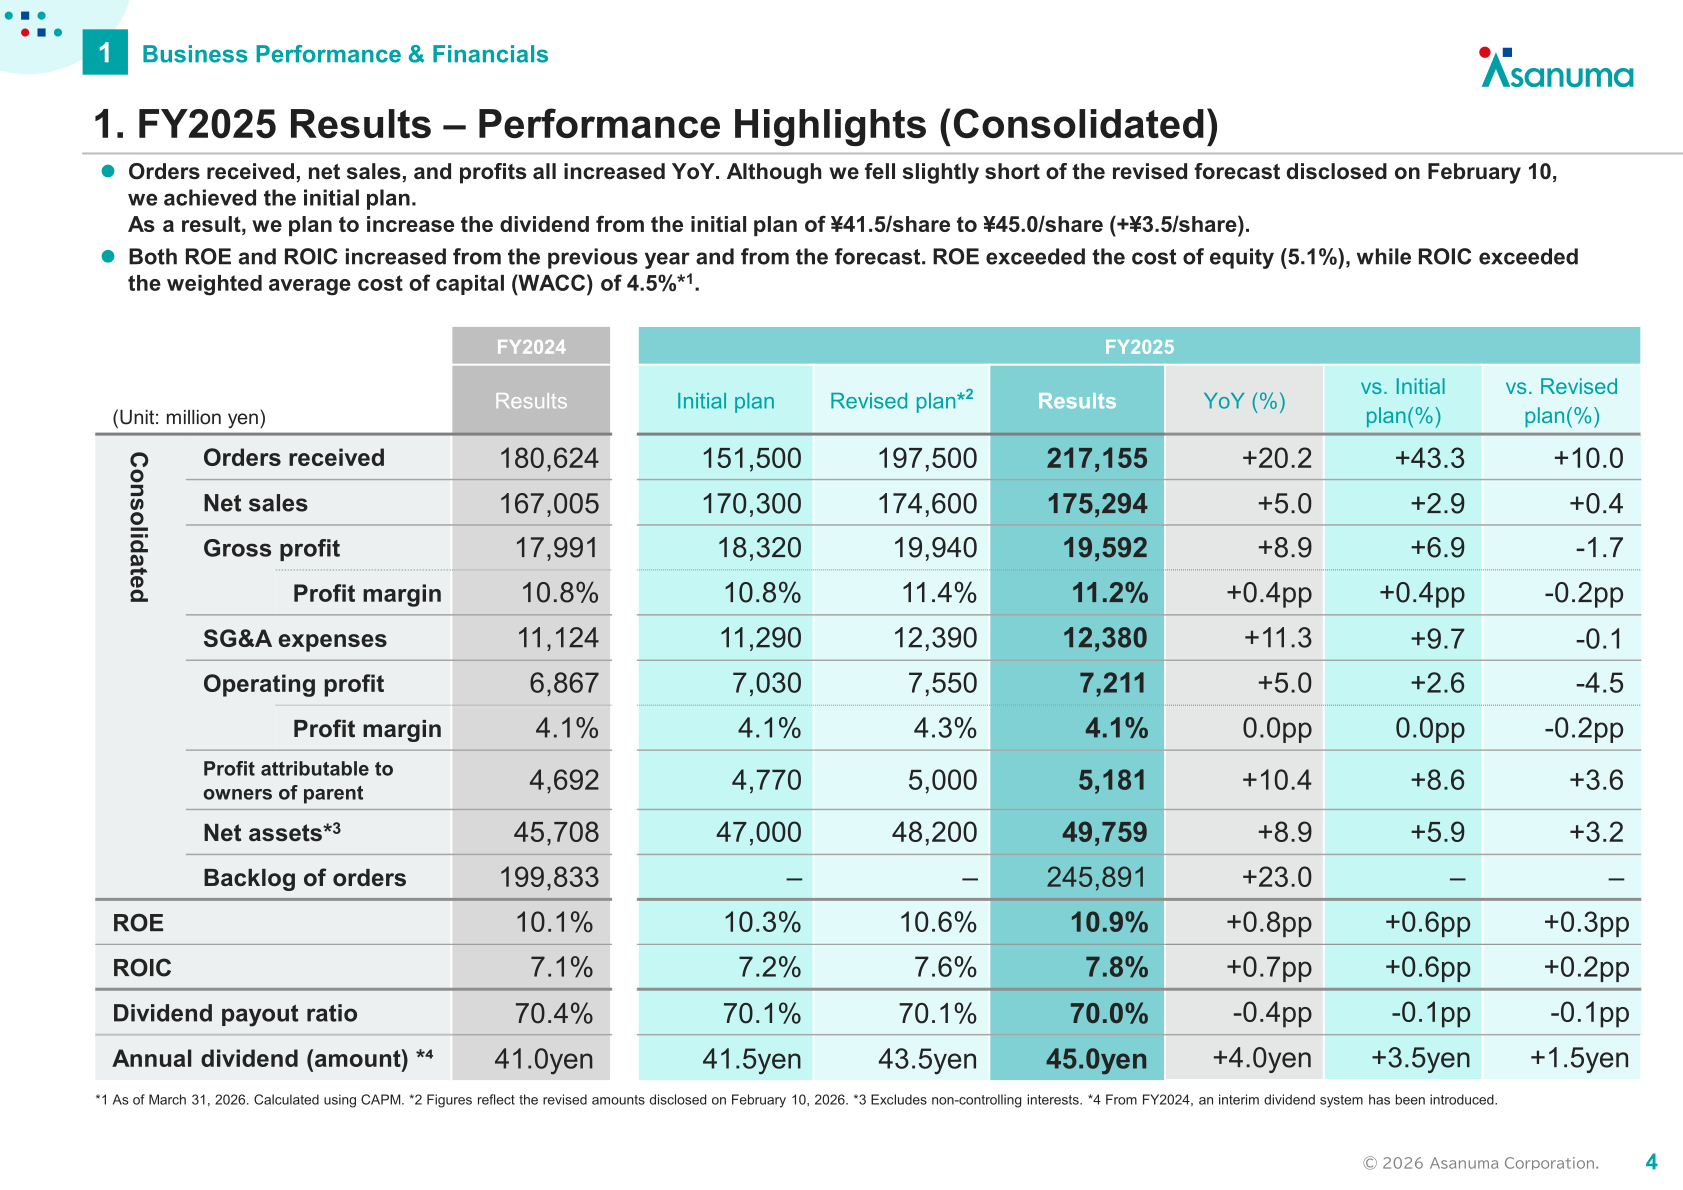
Asanuma Corporation (TSE Prime Market, 1852) reported higher orders, net sales and profits for FY2025 (the fiscal year ended March 2026). Consolidated orders received rose 20.2% year on year to ¥217,155 million, net sales increased 5.0% to ¥175,294 million, operating profit rose 5.0% to ¥7,211 million and profit attributable to owners of parent rose 10.4% to ¥5,181 million. The company states that results came in slightly below the revised forecast disclosed on February 10, 2026, but that the initial plan was achieved. The annual dividend is planned at ¥45.0 per share, up ¥4.0 year on year and up ¥3.5 versus the initial plan of ¥41.5.
Consolidated Results (Full-Year Actual)
All profit lines increased year on year. Gross profit rose 8.9% to ¥19,592 million and the gross profit margin improved 0.4 percentage points to 11.2%, which the company attributes to a strengthened selective approach to order intake that factors in materials and labor costs and construction systems at the time of order acceptance. SG&A expenses rose 11.3% to ¥12,380 million, including a ¥894 million increase in salaries and a ¥282 million increase related to DX and human capital investment. Ordinary profit rose 7.7% to ¥7,048 million. ROE reached 10.9% and ROIC 7.8%, both above the company’s stated cost of equity of 5.1% and WACC of 4.5% as of March 31, 2026.
| Item (million yen) | FY2024 Results | FY2025 Initial plan | FY2025 Revised plan | FY2025 Results | YoY (%) |
|---|---|---|---|---|---|
| Orders received | 180,624 | 151,500 | 197,500 | 217,155 | +20.2 |
| Net sales | 167,005 | 170,300 | 174,600 | 175,294 | +5.0 |
| Gross profit | 17,991 | 18,320 | 19,940 | 19,592 | +8.9 |
| Gross profit margin | 10.8% | 10.8% | 11.4% | 11.2% | +0.4pp |
| SG&A expenses | 11,124 | 11,290 | 12,390 | 12,380 | +11.3 |
| Operating profit | 6,867 | 7,030 | 7,550 | 7,211 | +5.0 |
| Operating profit margin | 4.1% | 4.1% | 4.3% | 4.1% | 0.0pp |
| Ordinary profit | 6,545 | 6,820 | 7,370 | 7,048 | +7.7 |
| Profit attributable to owners of parent | 4,692 | 4,770 | 5,000 | 5,181 | +10.4 |
| Net assets (excl. non-controlling interests) | 45,708 | 47,000 | 48,200 | 49,759 | +8.9 |
| Backlog of orders | 199,833 | – | – | 245,891 | +23.0 |
| ROE | 10.1% | 10.3% | 10.6% | 10.9% | +0.8pp |
| ROIC | 7.1% | 7.2% | 7.6% | 7.8% | +0.7pp |
| Annual dividend per share | 41.0yen | 41.5yen | 43.5yen | 45.0yen | +4.0yen |
On the balance sheet, total assets rose to ¥118,176 million from ¥115,240 million, with cash and deposits up ¥7,057 million and notes and accounts receivable from completed construction contracts down ¥5,117 million. Short-term borrowings, the current portion of long-term borrowings and bonds fell ¥8,587 million, and the equity ratio improved from 39.7% to 42.1%. Operating cash flow was +¥18,414 million, investing cash flow -¥799 million and financing cash flow -¥11,016 million, leaving cash and cash equivalents at the end of the year of ¥23,647 million, a net increase of ¥6,814 million.
Segment Results
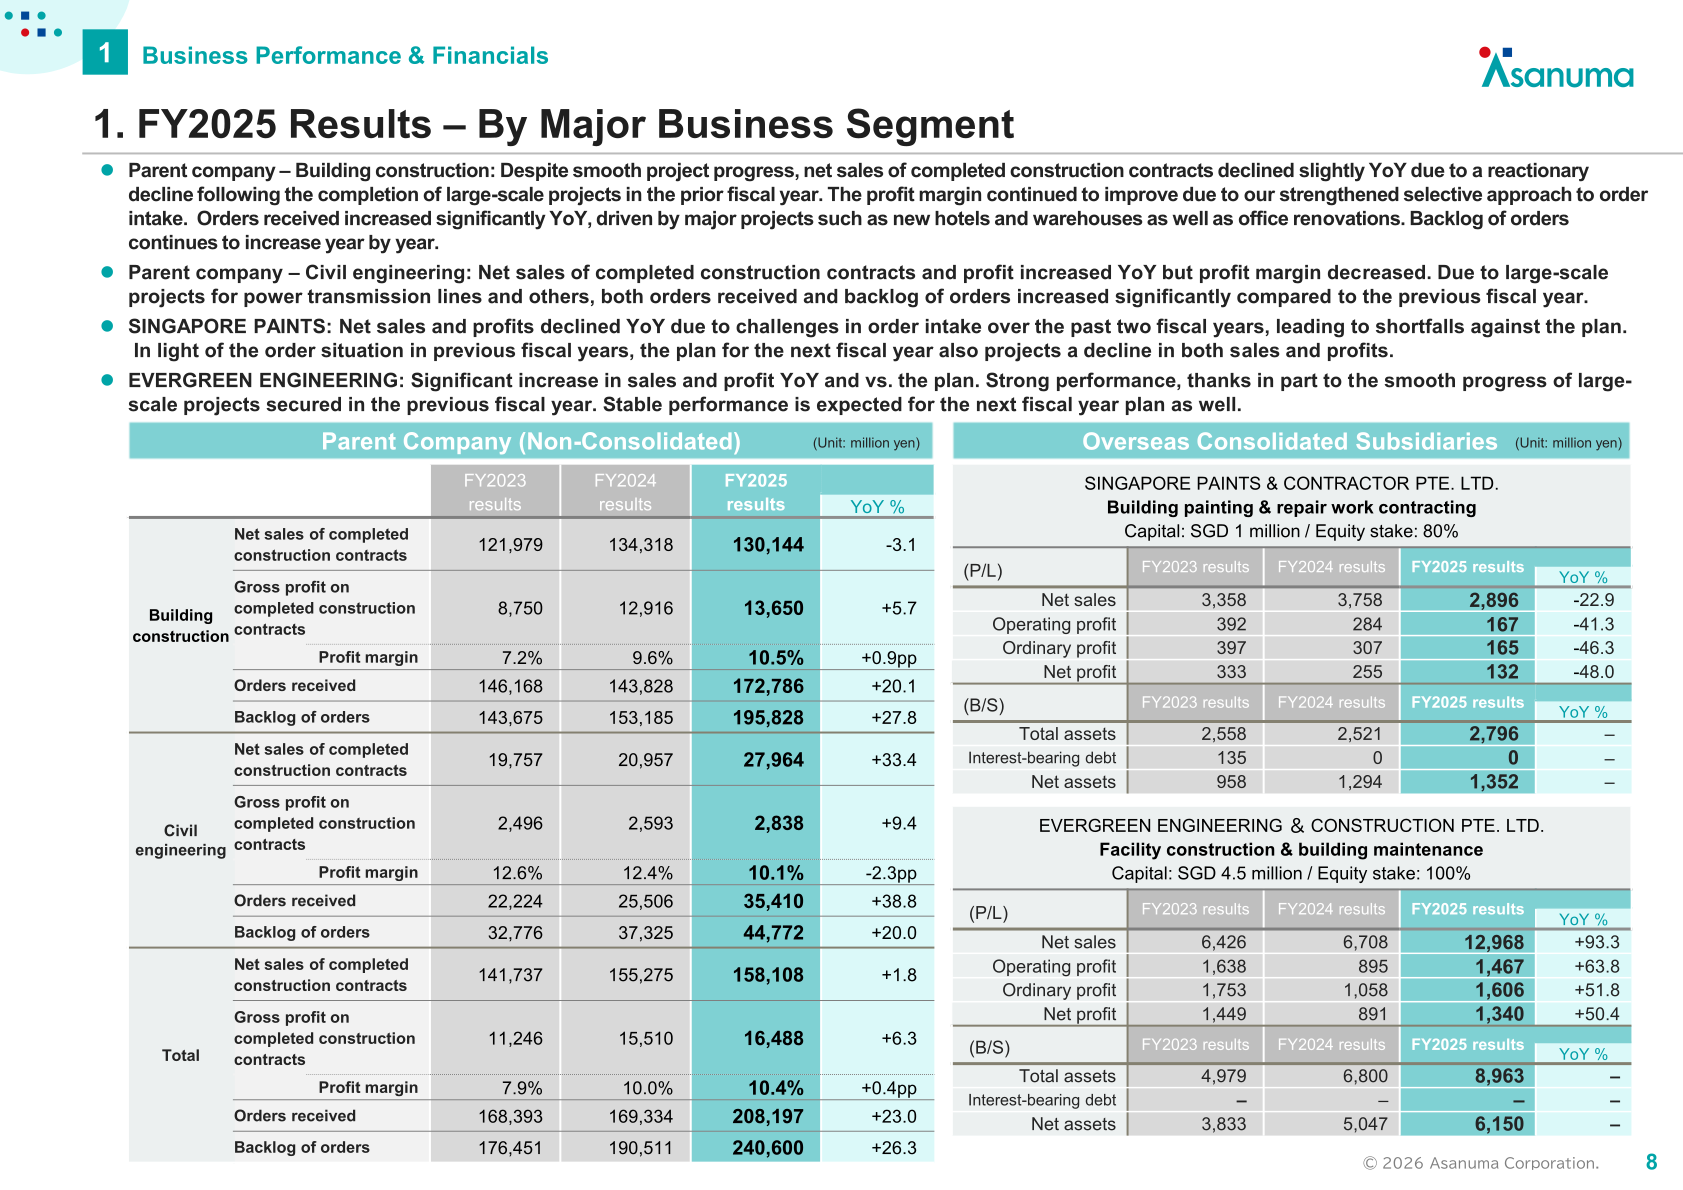
On a parent-company (non-consolidated) basis, building construction net sales of completed construction contracts declined 3.1% to ¥130,144 million on a reactionary decline following completion of large-scale projects in the prior fiscal year, while the profit margin improved 0.9 percentage points to 10.5%. Building construction orders received rose 20.1% to ¥172,786 million, driven by major projects such as new hotels and warehouses as well as office renovations. Civil engineering net sales rose 33.4% to ¥27,964 million and orders received rose 38.8% to ¥35,410 million on large-scale projects including power transmission lines, although the profit margin fell 2.3 percentage points to 10.1%. Parent-company backlog of orders reached ¥240,600 million, up 26.3%.
| Parent company (million yen) | Metric | FY2024 Results | FY2025 Results | YoY % |
|---|---|---|---|---|
| Building construction | Net sales of completed construction contracts | 134,318 | 130,144 | -3.1 |
| Building construction | Gross profit on completed construction contracts | 12,916 | 13,650 | +5.7 |
| Building construction | Profit margin | 9.6% | 10.5% | +0.9pp |
| Building construction | Orders received | 143,828 | 172,786 | +20.1 |
| Building construction | Backlog of orders | 153,185 | 195,828 | +27.8 |
| Civil engineering | Net sales of completed construction contracts | 20,957 | 27,964 | +33.4 |
| Civil engineering | Gross profit on completed construction contracts | 2,593 | 2,838 | +9.4 |
| Civil engineering | Profit margin | 12.4% | 10.1% | -2.3pp |
| Civil engineering | Orders received | 25,506 | 35,410 | +38.8 |
| Civil engineering | Backlog of orders | 37,325 | 44,772 | +20.0 |
| Total | Net sales of completed construction contracts | 155,275 | 158,108 | +1.8 |
| Total | Gross profit on completed construction contracts | 15,510 | 16,488 | +6.3 |
| Total | Profit margin | 10.0% | 10.4% | +0.4pp |
| Total | Orders received | 169,334 | 208,197 | +23.0 |
| Total | Backlog of orders | 190,511 | 240,600 | +26.3 |
Among the overseas consolidated subsidiaries, EVERGREEN ENGINEERING & CONSTRUCTION PTE. LTD. (facility construction and building maintenance, 100% owned) posted a 93.3% increase in net sales to ¥12,968 million and a 63.8% increase in operating profit to ¥1,467 million, helped by the smooth progress of large-scale projects secured in the previous fiscal year. SINGAPORE PAINTS & CONTRACTOR PTE. LTD. (building painting and repair work contracting, 80% owned) saw net sales fall 22.9% to ¥2,896 million and operating profit fall 41.3% to ¥167 million on weak order intake over the past two fiscal years; the company expects a further decline in both sales and profits for the next fiscal year.
| Overseas subsidiary (million yen) | Metric | FY2024 Results | FY2025 Results | YoY % |
|---|---|---|---|---|
| SINGAPORE PAINTS & CONTRACTOR | Net sales | 3,758 | 2,896 | -22.9 |
| SINGAPORE PAINTS & CONTRACTOR | Operating profit | 284 | 167 | -41.3 |
| SINGAPORE PAINTS & CONTRACTOR | Ordinary profit | 307 | 165 | -46.3 |
| SINGAPORE PAINTS & CONTRACTOR | Net profit | 255 | 132 | -48.0 |
| EVERGREEN ENGINEERING & CONSTRUCTION | Net sales | 6,708 | 12,968 | +93.3 |
| EVERGREEN ENGINEERING & CONSTRUCTION | Operating profit | 895 | 1,467 | +63.8 |
| EVERGREEN ENGINEERING & CONSTRUCTION | Ordinary profit | 1,058 | 1,606 | +51.8 |
| EVERGREEN ENGINEERING & CONSTRUCTION | Net profit | 891 | 1,340 | +50.4 |
Renovation Business
Strengthening the renovation business is one of the six themes of the three-year medium-term plan. In the domestic renovation business, orders received increased ¥10,118 million to ¥27,403 million, while net sales declined ¥3,239 million to ¥20,953 million; the profit margin on completed construction contracts rose 2.0 percentage points to 17.3% and operating profit was ¥2,265 million. For the two renovation-focused overseas subsidiaries, orders received fell ¥2,332 million to ¥8,958 million on the absence of Evergreen’s large-scale order from FY2024, while net sales rose ¥1,879 million to ¥11,559 million and operating profit (excluding goodwill) rose ¥486 million to ¥1,285 million. During the period the company also made T3 International Pte. Ltd., a Singapore-based painting specialist, a subsidiary as part of its initiative to strengthen the renovation business in the ASEAN region.
| Renovation business (million yen) | Metric | FY2024 Results | FY2025 Results | YoY |
|---|---|---|---|---|
| Domestic renovation | Orders received | 17,285 | 27,403 | +10,118 |
| Domestic renovation | Net sales | 24,193 | 20,953 | -3,239 |
| Domestic renovation | Gross profit on completed construction contracts | 3,763 | 3,618 | -84 |
| Domestic renovation | Profit margin | 15.3 | 17.3 | +2.0pp |
| Domestic renovation | Operating profit | 2,311 | 2,265 | -46 |
| Overseas renovation (two subsidiaries) | Orders received | 11,290 | 8,958 | -2,332 |
| Overseas renovation (two subsidiaries) | Net sales | 9,679 | 11,559 | +1,879 |
| Overseas renovation (two subsidiaries) | Gross profit on completed construction contracts | 2,020 | 2,439 | +418 |
| Overseas renovation (two subsidiaries) | Profit margin | 20.9 | 21.1 | +0.2 |
| Overseas renovation (two subsidiaries) | Operating profit (excluding goodwill) | 798 | 1,285 | +486 |
FY2026 Plan (Fiscal Year Ending March 2027)
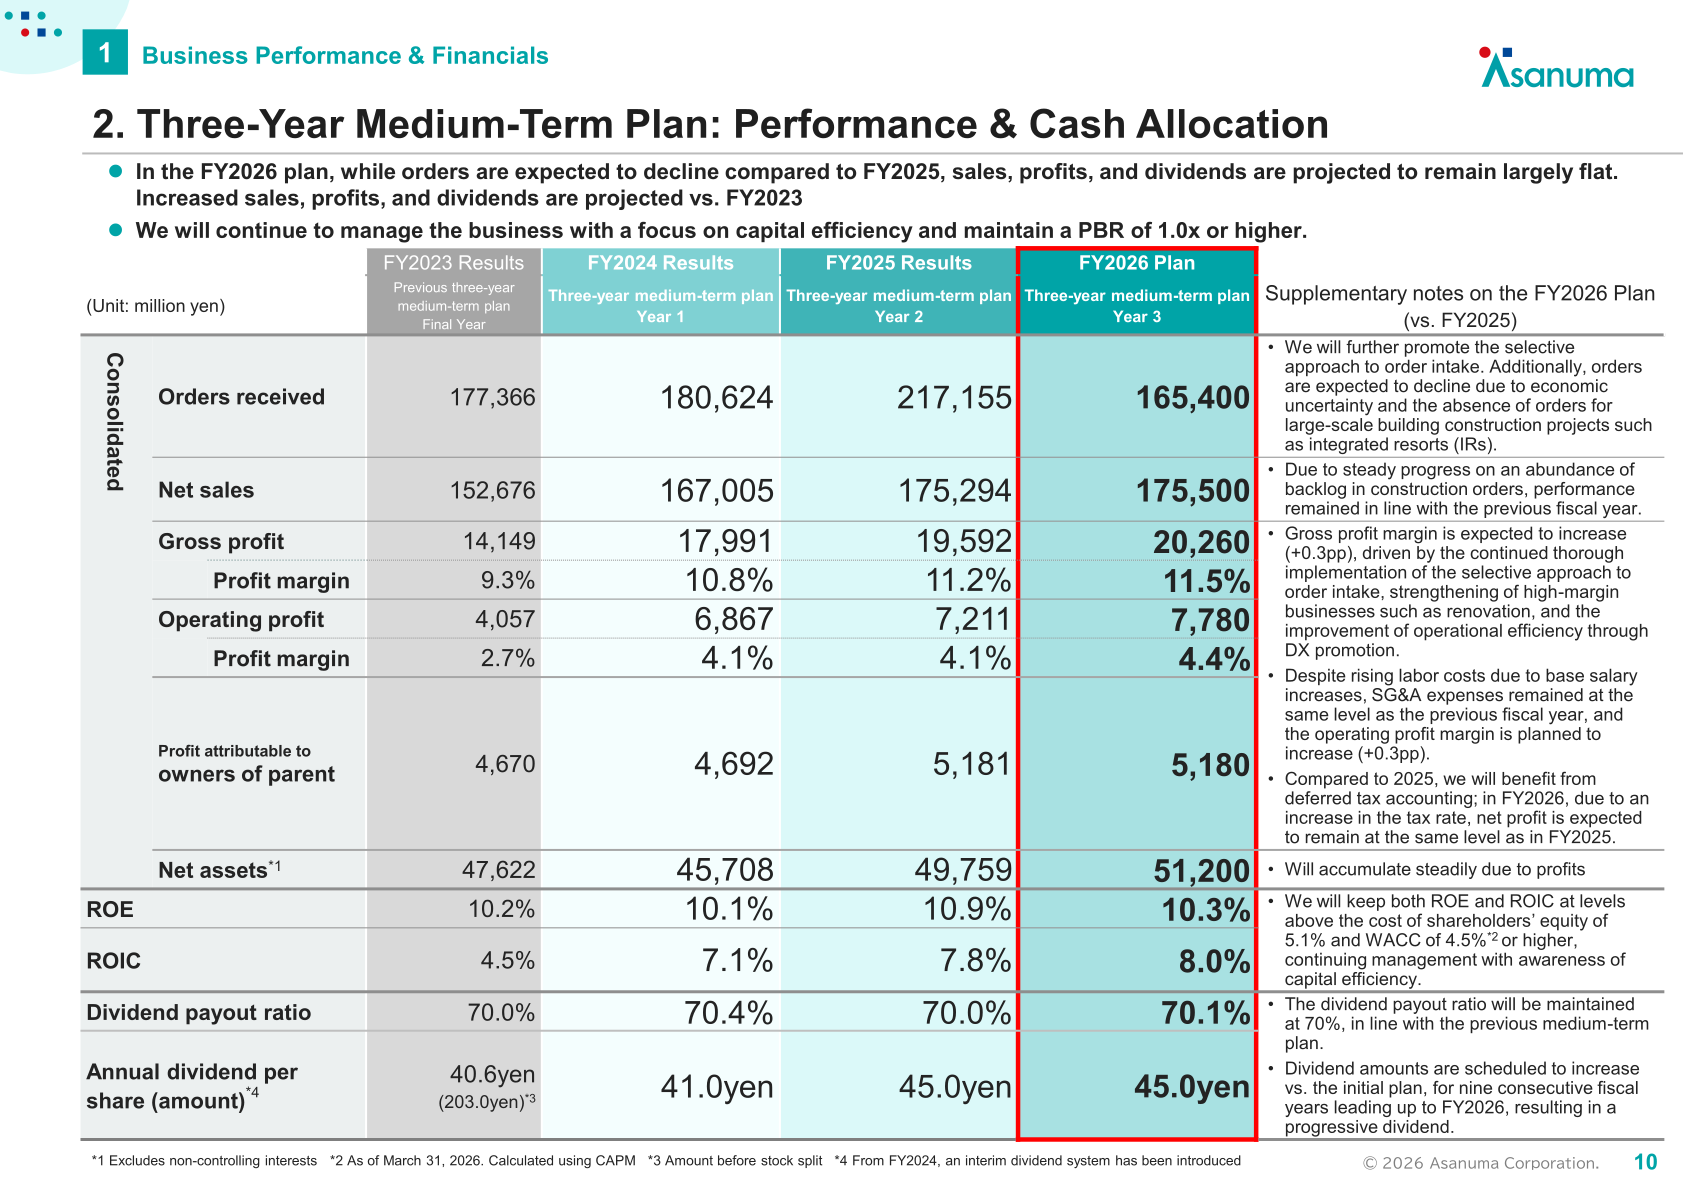
For FY2026, the final year of the three-year medium-term plan, the company plans orders received of ¥165,400 million, below FY2025, reflecting a further push on selective order intake, economic uncertainty and the absence of orders for large-scale building construction projects such as integrated resorts (IRs). Net sales are planned at ¥175,500 million, roughly flat, supported by steady progress on a substantial backlog. Gross profit is planned at ¥20,260 million with the margin rising 0.3 percentage points to 11.5%, and operating profit at ¥7,780 million with the margin rising to 4.4%. Profit attributable to owners of parent is planned at ¥5,180 million, roughly level with FY2025, as an increase in the tax rate offsets the benefit of deferred tax accounting.
| Item (million yen) | FY2024 Results | FY2025 Results | FY2026 Plan |
|---|---|---|---|
| Orders received | 180,624 | 217,155 | 165,400 |
| Net sales | 167,005 | 175,294 | 175,500 |
| Gross profit | 17,991 | 19,592 | 20,260 |
| Gross profit margin | 10.8% | 11.2% | 11.5% |
| SG&A expenses | 11,124 | 12,380 | 12,480 |
| Operating profit | 6,867 | 7,211 | 7,780 |
| Operating profit margin | 4.1% | 4.1% | 4.4% |
| Ordinary profit | 6,545 | 7,048 | 7,530 |
| Profit attributable to owners of parent | 4,692 | 5,181 | 5,180 |
| Net assets | 45,708 | 49,759 | 51,200 |
| ROE | 10.1% | 10.9% | 10.3% |
| ROIC | 7.1% | 7.8% | 8.0% |
| Dividend payout ratio | 70.4% | 70.0% | 70.1% |
| Annual dividend per share | 41.0yen | 45.0yen | 45.0yen |
On a non-consolidated basis, the FY2026 plan calls for orders received of ¥156,000 million (building construction ¥130,000 million, civil engineering ¥26,000 million) and net sales of completed construction contracts of ¥162,500 million (building construction ¥135,000 million, civil engineering ¥27,500 million).
Shareholder Returns
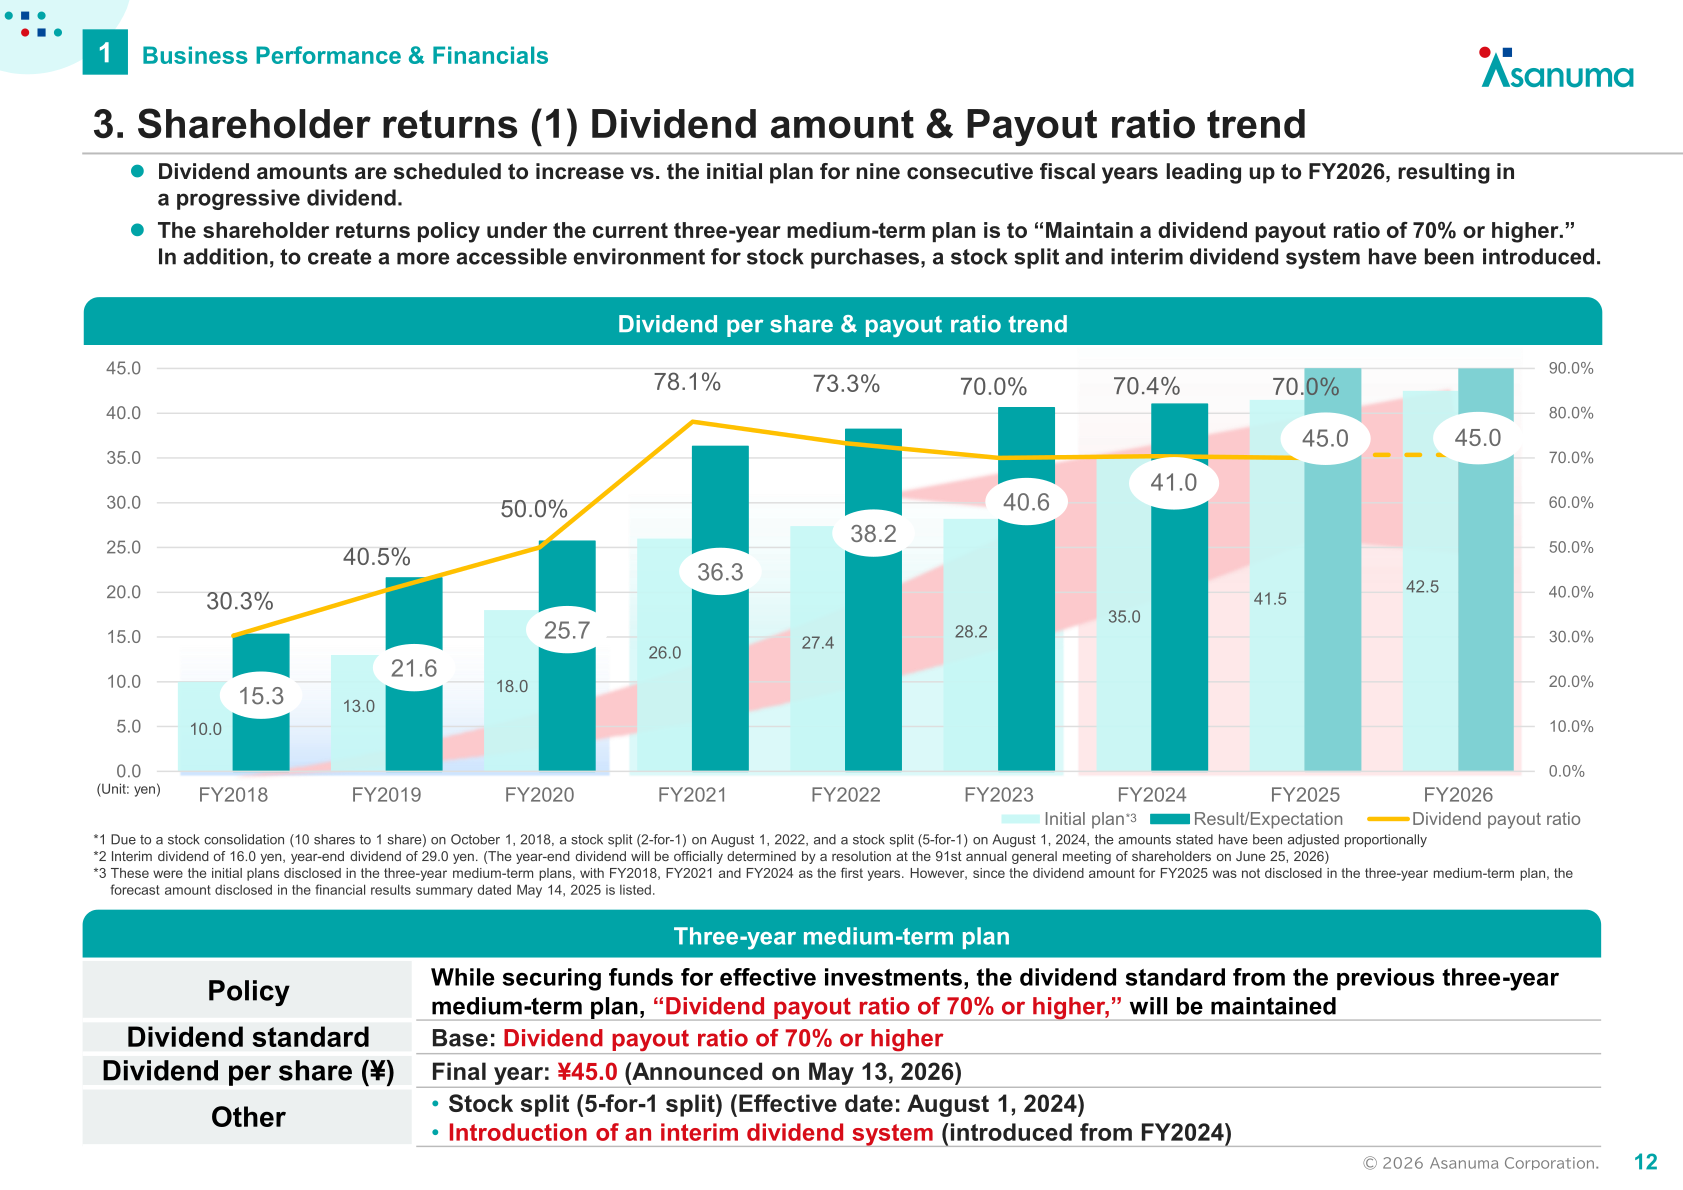
The shareholder returns policy under the current three-year medium-term plan is to maintain a dividend payout ratio of 70% or higher. For FY2025 the annual dividend is ¥45.0 per share, comprising an interim dividend of ¥16.0 and a year-end dividend of ¥29.0 (the year-end dividend to be formally determined by resolution at the 91st annual general meeting of shareholders on June 25, 2026), for a payout ratio of 70.0%. For FY2026 the company plans an annual dividend of ¥45.0 per share, comprising an interim dividend of ¥17.0 and a year-end dividend of ¥28.0, for a payout ratio of 70.1%. The company notes that dividend amounts are scheduled to increase versus the initial plan for nine consecutive fiscal years leading up to FY2026, resulting in a progressive dividend. A 5-for-1 stock split took effect on August 1, 2024, and an interim dividend system was introduced from FY2024.
| Dividend per share (yen) | FY2024 Results | FY2025 Schedule | FY2026 Plan |
|---|---|---|---|
| Annual dividend | 41.0 | 45.0 | 45.0 |
| End of the 2nd quarter | 15.0 | 16.0 | 17.0 |
| Year-end | 26.0 | 29.0 | 28.0 |
| Total dividends (100 million yen) | 45 | 34 | 37 |
Medium-Term Plan and Topics
Under the three-year medium-term plan covering FY2024 to FY2026, the company has set six themes: strengthening core businesses in Japan, strengthening the renovation business, acquiring, retaining and developing human resources, promotion of DX, strengthening governance, compliance and risk management, and environmental and social contribution. Cash of approximately ¥18–20 billion generated over the three years is to be allocated to investment and shareholder returns; the total three-year investment is now expected to be revised down to approximately ¥6.3 billion from an original ¥7.0 billion following finalization of the investment amount associated with the M&A disclosed on May 19, 2026, with shareholder returns of approximately ¥11.7 billion.
On KPI progress, the customer satisfaction score was 80.6pp (average of FY2024 and FY2025) against a target of 80pp or higher, the ratio of renovation business operating profit to consolidated operating profit was 49.2% against a target of 40% or higher, the engagement score was 72.8pp against a target of 70pp or higher, and gross profit per hour worked was 7,287 yen against a target of 6,000 yen or higher. Serious legal violations were 0 incidents, while fatal accidents were 1 incident against a target of 0; the company states it submitted a report on measures to prevent recurrence to the regulatory authority and reinforced safety training. FY2025 CO2 emissions figures are currently being calculated and are scheduled to be disclosed on the company website around June 2026. In topics, the Netherlands Pavilion that Asanuma constructed for Expo 2025 Osaka, Kansai is being relocated to Awaji Island following the event’s conclusion in October 2025, with the company participating as construction contractor.
This article is an analysis based on publicly available information and is not a recommendation to buy or sell any specific securities. Investment decisions are your own responsibility.
















