
This article is based on publicly available IR materials and is not a recommendation to buy or sell any specific securities.
Note: TEKKEN CORPORATION’s fiscal year ends in March. The latest completed fiscal year, classified as FY2025 in this site’s title and URL, is the fiscal year ended March 31, 2026, which the presentation labels “FY3/2026” (and, in the Medium-Term Management Plan pages, “FY2025”); the body text, tables and segment data below retain the source’s own period labels. Unless otherwise noted, amounts are in units of 100 million yen, as presented in the materials.
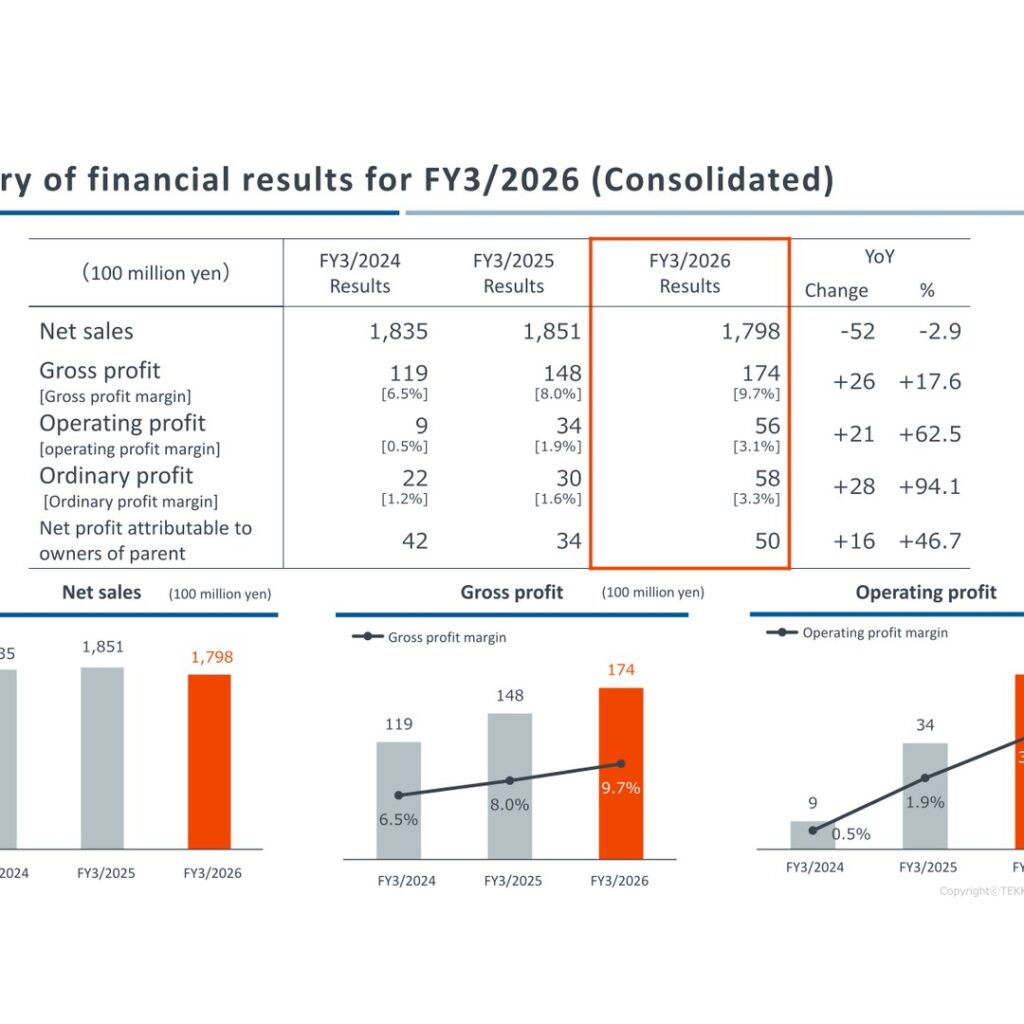
TEKKEN CORPORATION reported net sales of 179.8bn yen for FY3/2026, down 2.9% year on year, as overseas construction declined and there was a reactionary decline from the previous fiscal year. Profit rose at every level: operating profit increased 62.5% to 5.6bn yen on design change orders secured in Civil Engineering and improved profitability in Architectural Construction, ordinary profit rose 94.1% to 5,873 million yen helped by investment profit from silent partnerships, and net profit attributable to owners of parent rose 46.7% to 5,029 million yen. Orders received on a non-consolidated basis rose to 225,654 million yen and construction work carried forward reached its highest level in the past 10 years. The annual dividend was 170yen per share, and alongside the results the company updated its Medium-Term Management Plan 2028, raising its FY2028 operating profit target to 11.0 billion yen or more and its ROE target to 10.0% or more.
Consolidated Results (Full-Year Actual)
Net sales decreased due to a decrease in overseas construction and the reactionary decline from the previous fiscal year, etc. Gross profit rose to 17.4 billion yen with the gross profit margin improving to 9.7% from 8.0%. Operating profit increased due to securing design change orders in Civil Engineering and improved profitability in Architectural Construction. Ordinary profit increased due to the recording of investment profit from silent partnerships, etc., and profit attributable to owners of the parent increased due to higher operating profit and higher ordinary profit.
| Item (100 million yen) | FY3/2024 Results | FY3/2025 Results | FY3/2026 Results | YoY Change | YoY % |
|---|---|---|---|---|---|
| Net sales | 1,835 | 1,851 | 1,798 | -52 | -2.9 |
| Gross profit [Gross profit margin] | 119 [6.5%] | 148 [8.0%] | 174 [9.7%] | +26 | +17.6 |
| Operating profit [Operating profit margin] | 9 [0.5%] | 34 [1.9%] | 56 [3.1%] | +21 | +62.5 |
| Ordinary profit [Ordinary profit margin] | 22 [1.2%] | 30 [1.6%] | 58 [3.3%] | +28 | +94.1 |
| Net profit attributable to owners of parent | 42 | 34 | 50 | +16 | +46.7 |
Below the operating line, the materials break out the year-on-year movements in million yen. The non-operating balance was 2.0 billion yen (non-operating profit 1.6 billion yen, non-operating expenses 1.4 billion yen) and the extraordinary income/loss balance was 1.6 billion yen (extraordinary income 2.8 billion yen, extraordinary losses 1.2 billion yen). Non-operating profit rose on an increase in investment profit from silent partnerships of 519, an increase in dividends received, etc. of 262, and an increase in foreign exchange gains of 44; extraordinary losses rose on an increase in impairment loss of 685 and settlement payments of 116.
| Item (million yen) | FY3/2025 | FY3/2026 | Change |
|---|---|---|---|
| Operating profit | 3,459 | 5,622 | +2,162 |
| Non-operating profit | 820 | 1,672 | +852 |
| Non-operating expenses | 1,254 | 1,420 | +166 |
| Ordinary profit | 3,026 | 5,873 | +2,847 |
| Extraordinary income | 2,714 | 2,899 | +185 |
| Extraordinary losses | 778 | 1,291 | +512 |
| Profit before income taxes | 4,961 | 7,482 | +2,521 |
| Taxes and other expenses | 1,525 | 2,432 | +907 |
| Profit attributable to non-controlling interests | 7 | 20 | +13 |
| Net profit attributable to owners of parent | 3,429 | 5,029 | +1,600 |
Segment Results
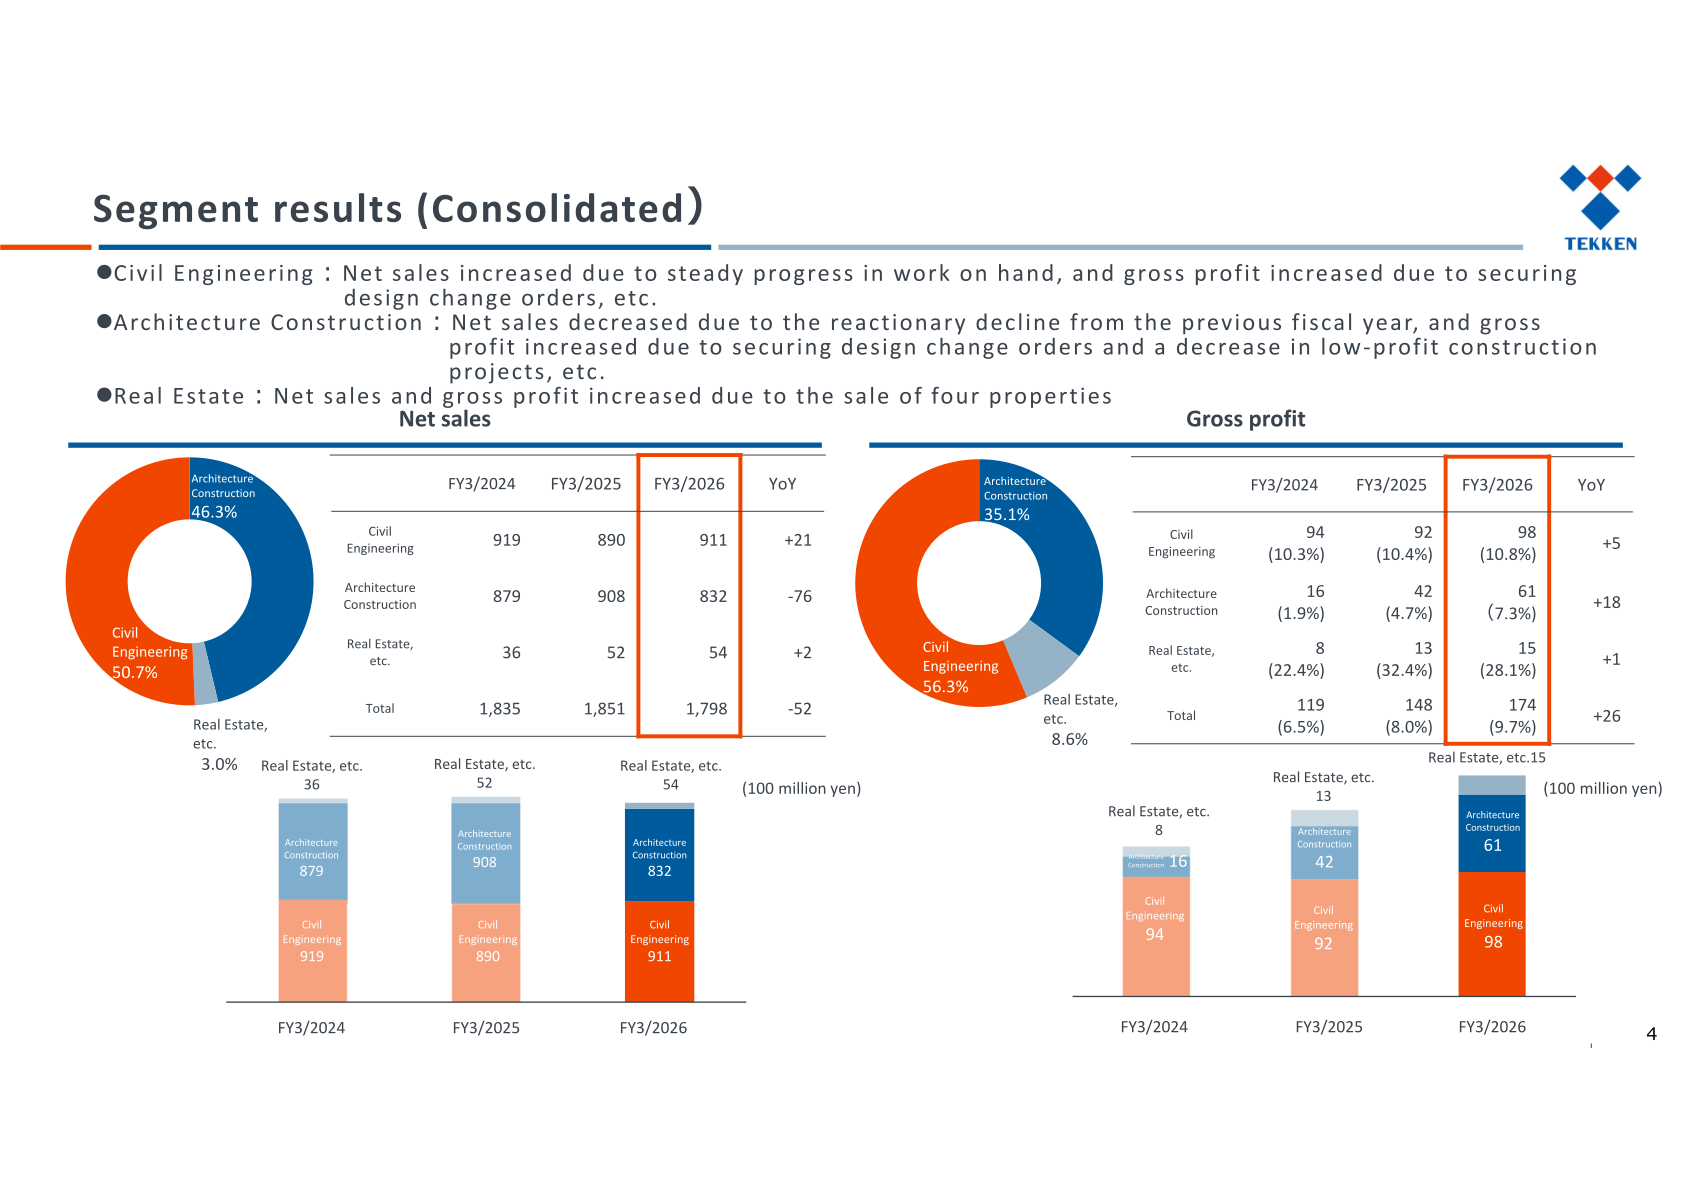
In Civil Engineering, net sales increased due to steady progress in work on hand, and gross profit increased due to securing design change orders, etc. In Architecture Construction, net sales decreased due to the reactionary decline from the previous fiscal year, while gross profit increased due to securing design change orders and a decrease in low-profit construction projects, etc. In Real Estate, net sales and gross profit increased due to the sale of four properties. By composition of net sales, Civil Engineering accounted for 50.7%, Architecture Construction 46.3% and Real Estate, etc. 3.0% in FY3/2026.
| Segment (100 million yen) | Metric | FY3/2024 | FY3/2025 | FY3/2026 | YoY |
|---|---|---|---|---|---|
| Civil Engineering | Net sales | 919 | 890 | 911 | +21 |
| Architecture Construction | Net sales | 879 | 908 | 832 | -76 |
| Real Estate, etc. | Net sales | 36 | 52 | 54 | +2 |
| Total | Net sales | 1,835 | 1,851 | 1,798 | -52 |
| Civil Engineering | Gross profit [margin] | 94 (10.3%) | 92 (10.4%) | 98 (10.8%) | +5 |
| Architecture Construction | Gross profit [margin] | 16 (1.9%) | 42 (4.7%) | 61 (7.3%) | +18 |
| Real Estate, etc. | Gross profit [margin] | 8 (22.4%) | 13 (32.4%) | 15 (28.1%) | +1 |
| Total | Gross profit [margin] | 119 (6.5%) | 148 (8.0%) | 174 (9.7%) | +26 |
Orders Received and Construction Work Carried Forward (Non-Consolidated)
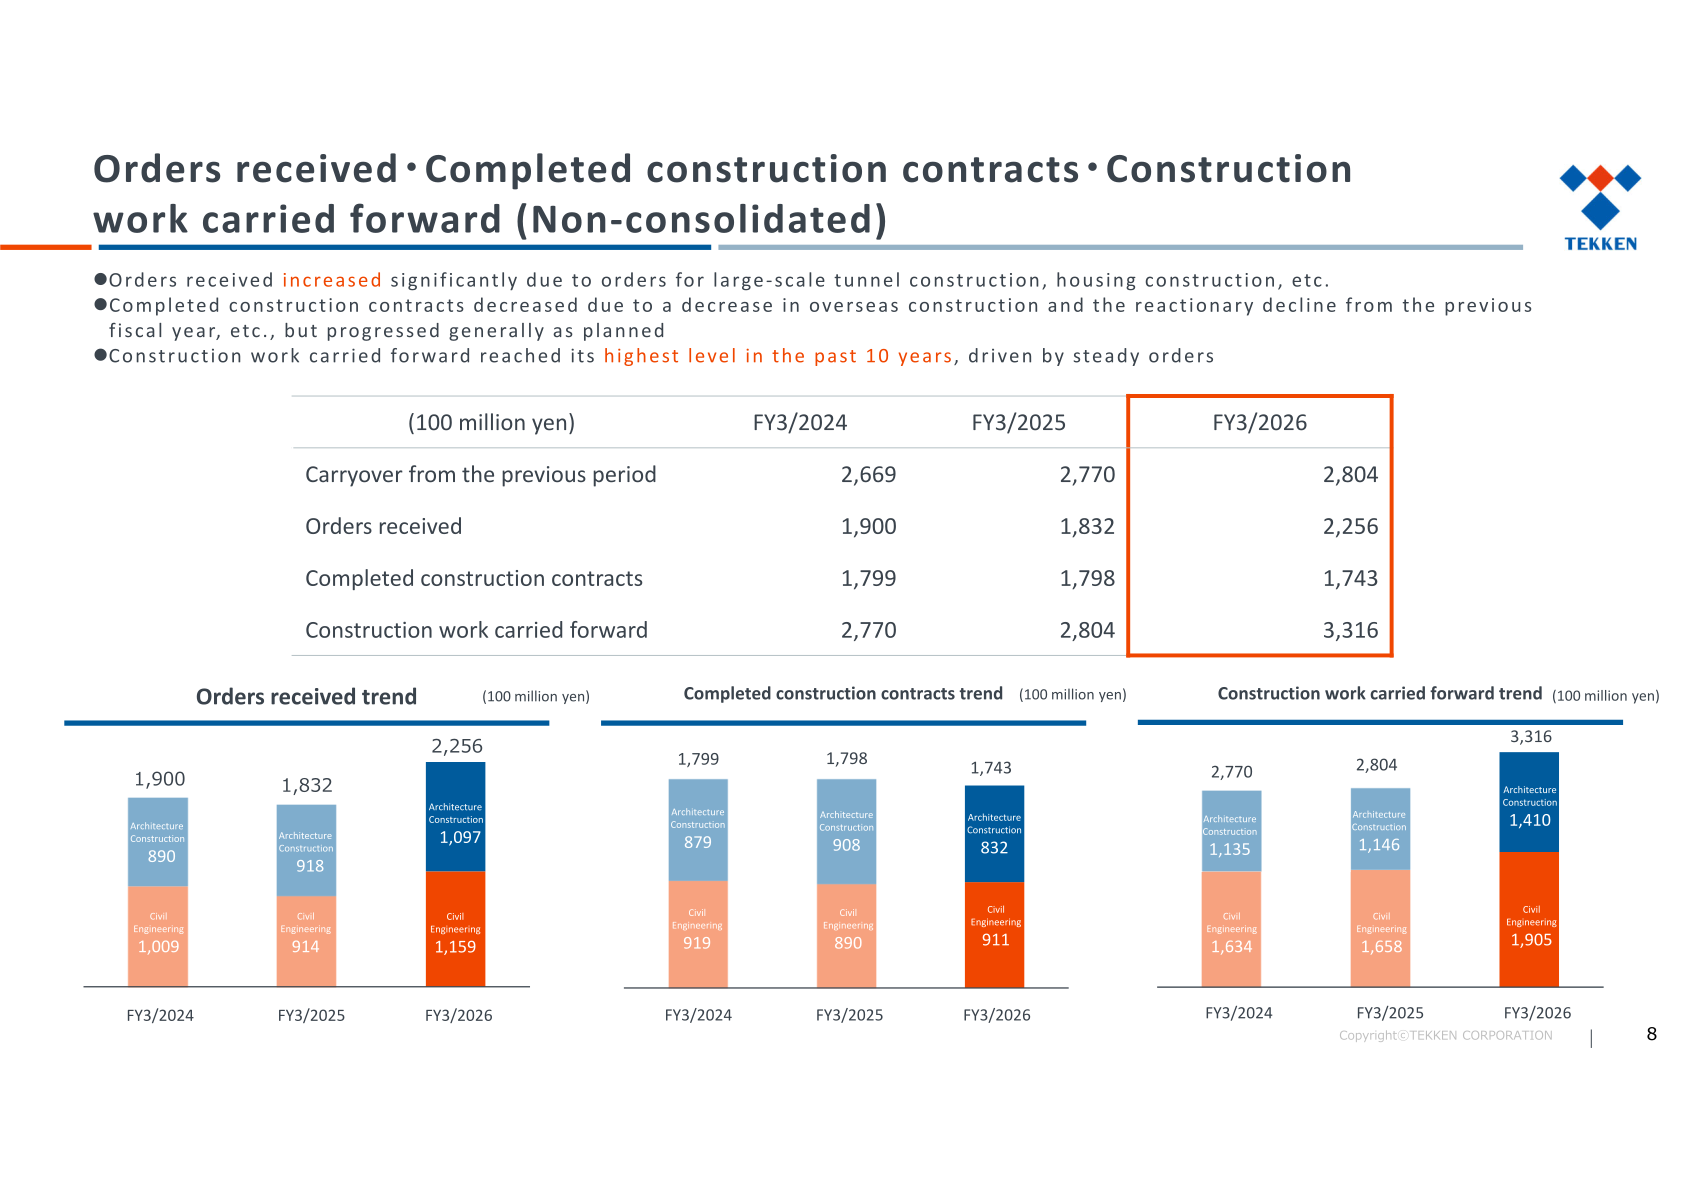
Orders received increased significantly due to orders for large-scale tunnel construction, housing construction, etc. Completed construction contracts decreased due to a decrease in overseas construction and the reactionary decline from the previous fiscal year, etc., but progressed generally as planned. Construction work carried forward reached its highest level in the past 10 years, driven by steady orders. Major Civil Engineering projects ordered through the full year totalled 115.9 billion yen and major Architecture Construction projects totalled 109.7 billion yen.
| Item (100 million yen) | FY3/2024 | FY3/2025 | FY3/2026 |
|---|---|---|---|
| Carryover from the previous period | 2,669 | 2,770 | 2,804 |
| Orders received | 1,900 | 1,832 | 2,256 |
| Completed construction contracts | 1,799 | 1,798 | 1,743 |
| Construction work carried forward | 2,770 | 2,804 | 3,316 |
FY3/2027 Forecast
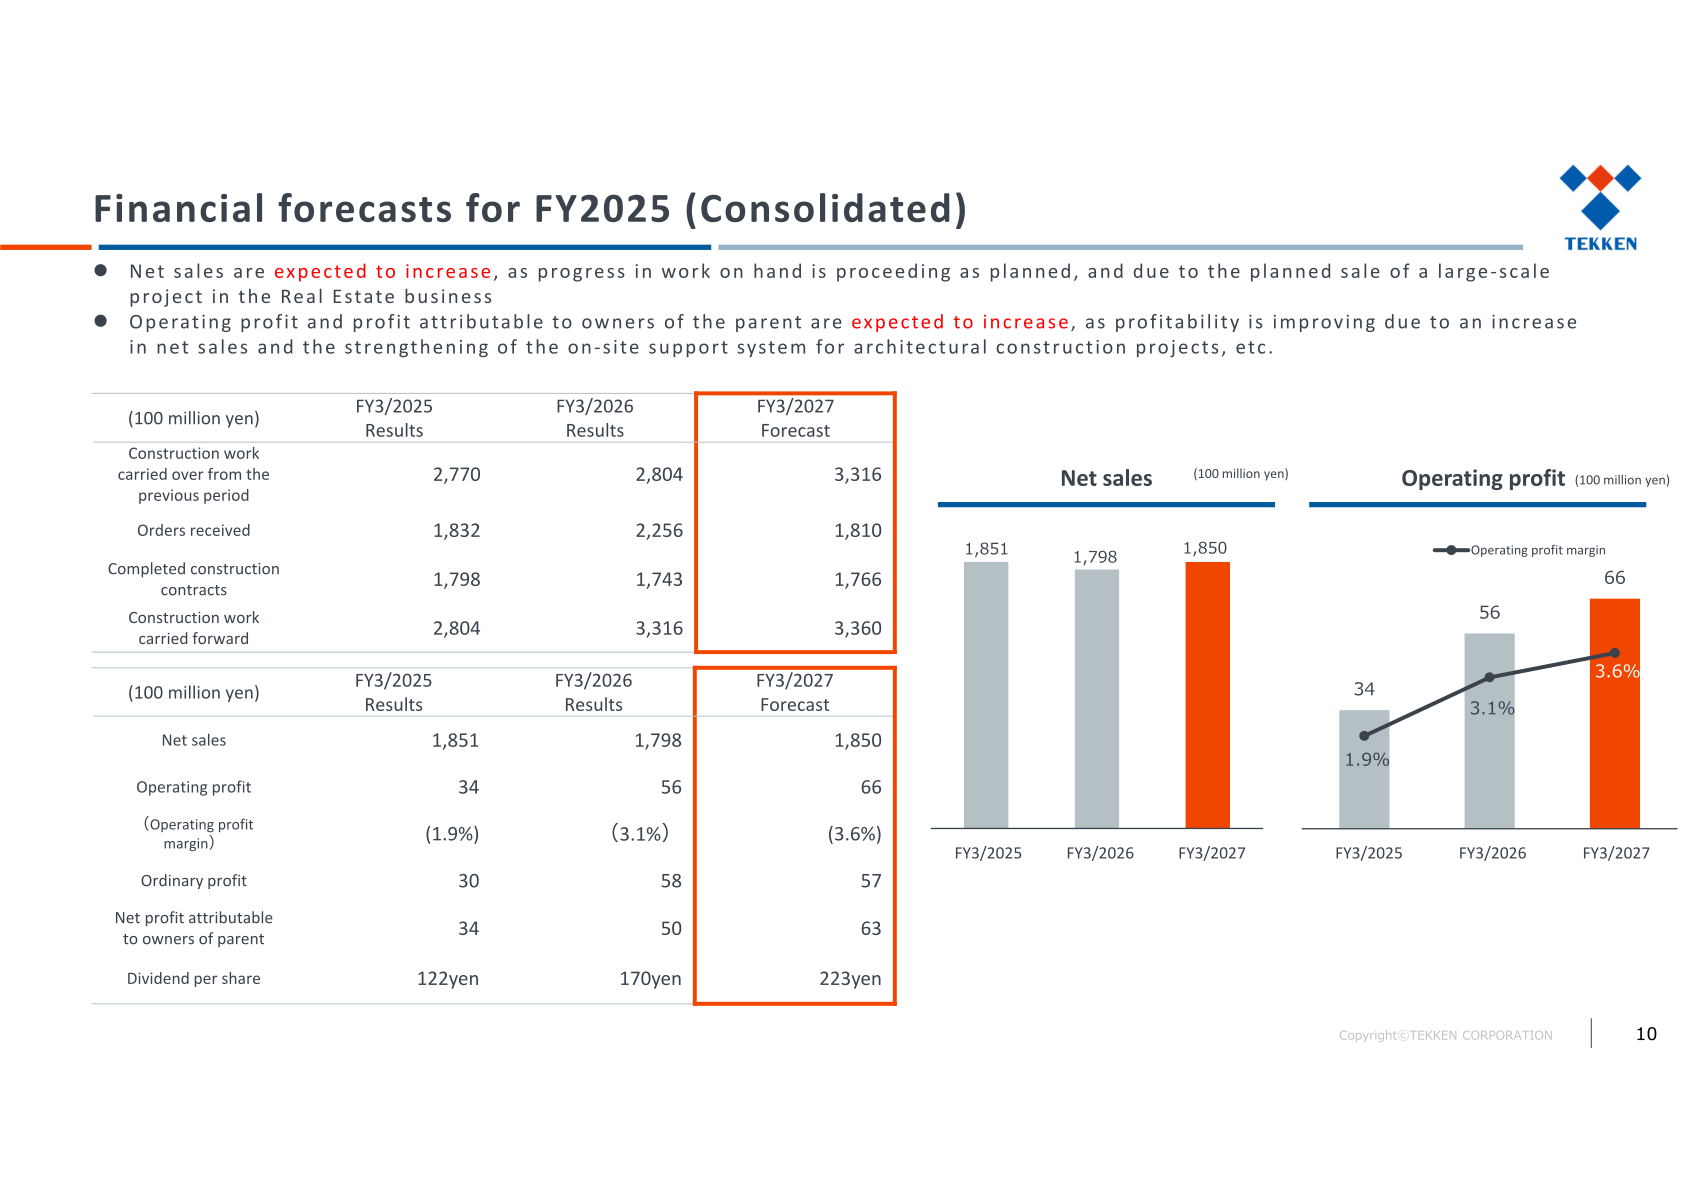
Net sales are expected to increase, as progress in work on hand is proceeding as planned, and due to the planned sale of a large-scale project in the Real Estate business. Operating profit and profit attributable to owners of the parent are expected to increase, as profitability is improving due to an increase in net sales and the strengthening of the on-site support system for architectural construction projects, etc. The scheduled dividend is 223 yen per share.
| Item (100 million yen) | FY3/2025 Results | FY3/2026 Results | FY3/2027 Forecast |
|---|---|---|---|
| Net sales | 1,851 | 1,798 | 1,850 |
| Operating profit | 34 | 56 | 66 |
| (Operating profit margin) | (1.9%) | (3.1%) | (3.6%) |
| Ordinary profit | 30 | 58 | 57 |
| Net profit attributable to owners of parent | 34 | 50 | 63 |
| Dividend per share | 122yen | 170yen | 223yen |
| Construction work carried over from the previous period | 2,770 | 2,804 | 3,316 |
| Orders received | 1,832 | 2,256 | 1,810 |
| Completed construction contracts | 1,798 | 1,743 | 1,766 |
| Construction work carried forward | 2,804 | 3,316 | 3,360 |
Shareholder Returns
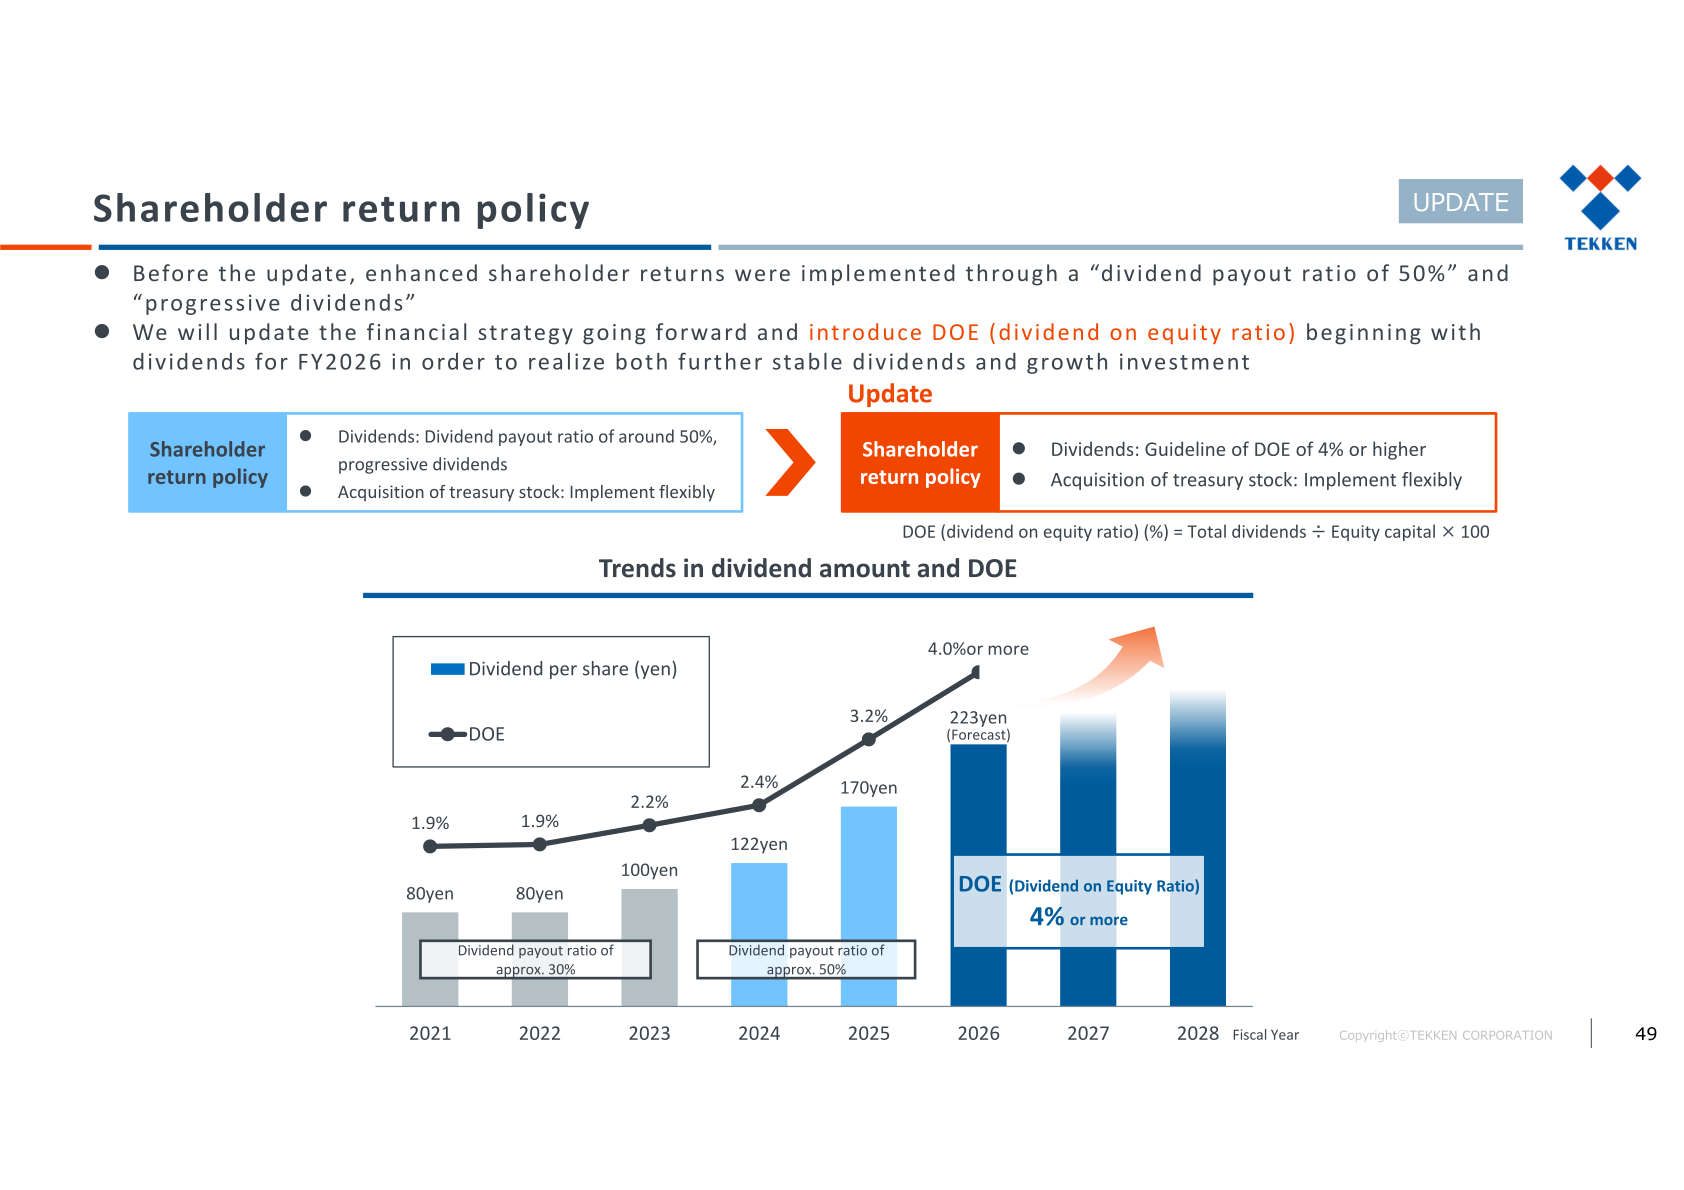
Before the update, enhanced shareholder returns were implemented through a “dividend payout ratio of 50%” and “progressive dividends.” The company will update the financial strategy going forward and introduce DOE (dividend on equity ratio) beginning with dividends for FY2026 in order to realize both further stable dividends and growth investment. The updated policy is a guideline of DOE of 4% or higher for dividends, with acquisition of treasury stock implemented flexibly; DOE (%) is defined as total dividends divided by equity capital multiplied by 100. Dividends per share have risen from 80yen for FY2021 and FY2022 to 100yen for FY2023, 122yen for FY2024 and 170yen for FY2025, with 223yen forecast for FY2026, taking DOE from 1.9% to 3.2% for FY2025 and 4.0% or more from FY2026. Cash allocation over the five years FY2024–FY2028 includes shareholder returns of 15.0 billion yen against an investment plan of 25.5 billion yen.
| Fiscal Year | Dividend per share (yen) | DOE |
|---|---|---|
| 2021 | 80yen | 1.9% |
| 2022 | 80yen | 1.9% |
| 2023 | 100yen | 2.2% |
| 2024 | 122yen | 2.4% |
| 2025 | 170yen | 3.2% |
| 2026 | 223yen (Forecast) | 4.0%or more |
Medium-Term Management Plan 2028 Update
Since FY2024 the TEKKEN Group has been promoting “Medium-Term Management Plan 2028: ‘Toward a Company We Can Be Proud Of’ – Challenge toward a Sustainable Future Society –.” Upon reviewing the Plan at the end of FY2025, the second year of the plan, the earning power of each business was progressing at a pace exceeding initial assumptions and profit targets were achieved one year ahead of schedule. Taking this and the rise in the cost of shareholders’ equity into account, the company determined that it was necessary to review the numerical targets, and it also formulated a Purpose, “Keeping Cities Moving Forward,” together with a “100th Anniversary Dream” for 2044. Financial KPIs were raised: ROE to 10.0% or more for FY2028 (previous target 8.0%) and 7.5% or more for FY2026, and consolidated operating profit to 11.0 billion yen or more for FY2028 and 6.6 billion yen or more for FY2026. The cost of shareholders’ equity is put at approximately 7.5%, updated to approximately 8.0%. Non-financial KPIs are unchanged, including CO2 emissions of -32% for Scope1+2 and -20% for Scope3 versus FY2022 by FY2028, zero fatalities and serious accidents each fiscal year, and continuous improvement in the employee engagement score.
| Item | FY2024 Results | FY2025 Results | FY2026 Plan (after update) | FY2028 Plan (after update) |
|---|---|---|---|---|
| Net sales | 185.1bn yen | 179.8bn yen | 185.0bn yen | 212.0bn yen |
| Civil Engineering | 89.0bn yen | 91.1bn yen | 93.8bn yen | 100.0bn yen |
| Architectural Construction | 90.8bn yen | 83.2bn yen | 82.8bn yen | 100.0bn yen |
| Real Estate and New Businesses, etc. | 5.2bn yen | 5.4bn yen | 8.4bn yen | 12.0bn yen |
| Gross profit | 14.8bn yen | 17.4bn yen | 19.4bn yen | 24.2bn yen |
| Operating profit | 3.4bn yen | 5.6bn yen | 6.6bn yen or more | 11.0bn yen or more |
| ROE | 4.8% | 6.8% | 7.5% or more | 10.0% or more |
| Equity ratio | 31.0% | 30.6% | 30% or more | 30% or more |
| Shareholder return | 50.3% | 47.1% | DOE : guideline of 4% or more | DOE : guideline of 4% or more |
Investment over the five years FY2024–FY2028 comprises business strategy investment of 17.0 billion yen (technology development investment 7.0 billion yen, business development investment 10.0 billion yen) and foundational strategy investment of 8.5 billion yen (DX investment 7.0 billion yen, human resource and organizational investment 1.5 billion yen). On the cash-in side the plan assumes operating profit of 34.0 billion yen or more, depreciation of 4.0 billion yen and asset sales of 15.0 billion yen or more, with policy shareholdings sold totalling 10.0 billion yen or more and reduced to less than 20% of net assets. Financial discipline targets are an equity ratio of 30% or more and a D/E ratio of a maximum of 0.8 times at the end of each fiscal year, with a long-term image of 35–40% and approximately 0.5 times.
This article is an analysis based on publicly available information and is not a recommendation to buy or sell any specific securities. Investment decisions are your own responsibility.
















