
This article is based on publicly available IR materials and is not a recommendation to buy or sell any specific securities.
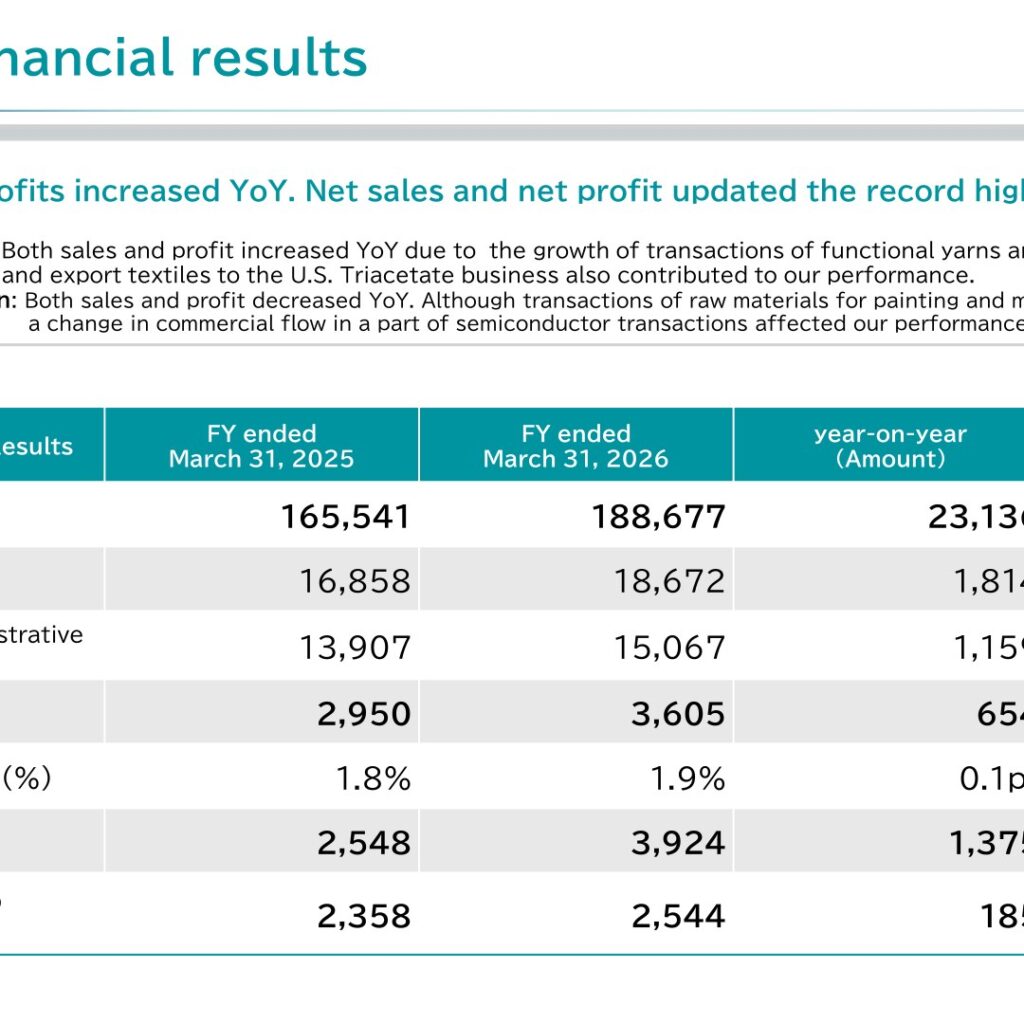
GSI Creos Corporation (TSE: 8101) reported consolidated net sales of ¥188,677 million (up 14.0% year on year), operating profit of ¥3,605 million (up 22.2%), ordinary profit of ¥3,924 million (up 54.0%), and profit attributable to owners of parent of ¥2,544 million (up 7.9%) for the fiscal year ended March 31, 2026. Net sales and net profit both updated the company’s record highs. In this article, this fiscal year is referred to as FY2025, following site convention; GSI Creos’s own materials label the period as the ‘fiscal year ended March 31, 2026.’
Consolidated Results (Full-Year Actual)
Both net sales and profit increased year on year across all major line items. The Textile Materials Division saw higher sales and profit, driven by growth in transactions of functional yarns and textiles for innerwear and export textiles to the U.S., with the triacetate business also contributing to performance. The Industrial Products Division saw lower sales and profit; although transactions of raw materials for painting and machinery contributed, a change in commercial flow in part of the semiconductor business affected performance.
| Item | FY ended March 31, 2026 | FY ended March 31, 2025 | YoY Change (Amount) | YoY Change (%) |
|---|---|---|---|---|
| Net sales | 188,677 | 165,541 | 23,136 | 14.0 |
| Gross profit | 18,672 | 16,858 | 1,814 | 10.8 |
| SG&A expenses | 15,067 | 13,907 | 1,159 | 8.3 |
| Operating profit | 3,605 | 2,950 | 654 | 22.2 |
| Operating profit ratio | 1.9% | 1.8% | +0.1pt | – |
| Ordinary profit | 3,924 | 2,548 | 1,375 | 54.0 |
| Profit attributable to owners of parent | 2,544 | 2,358 | 185 | 7.9 |
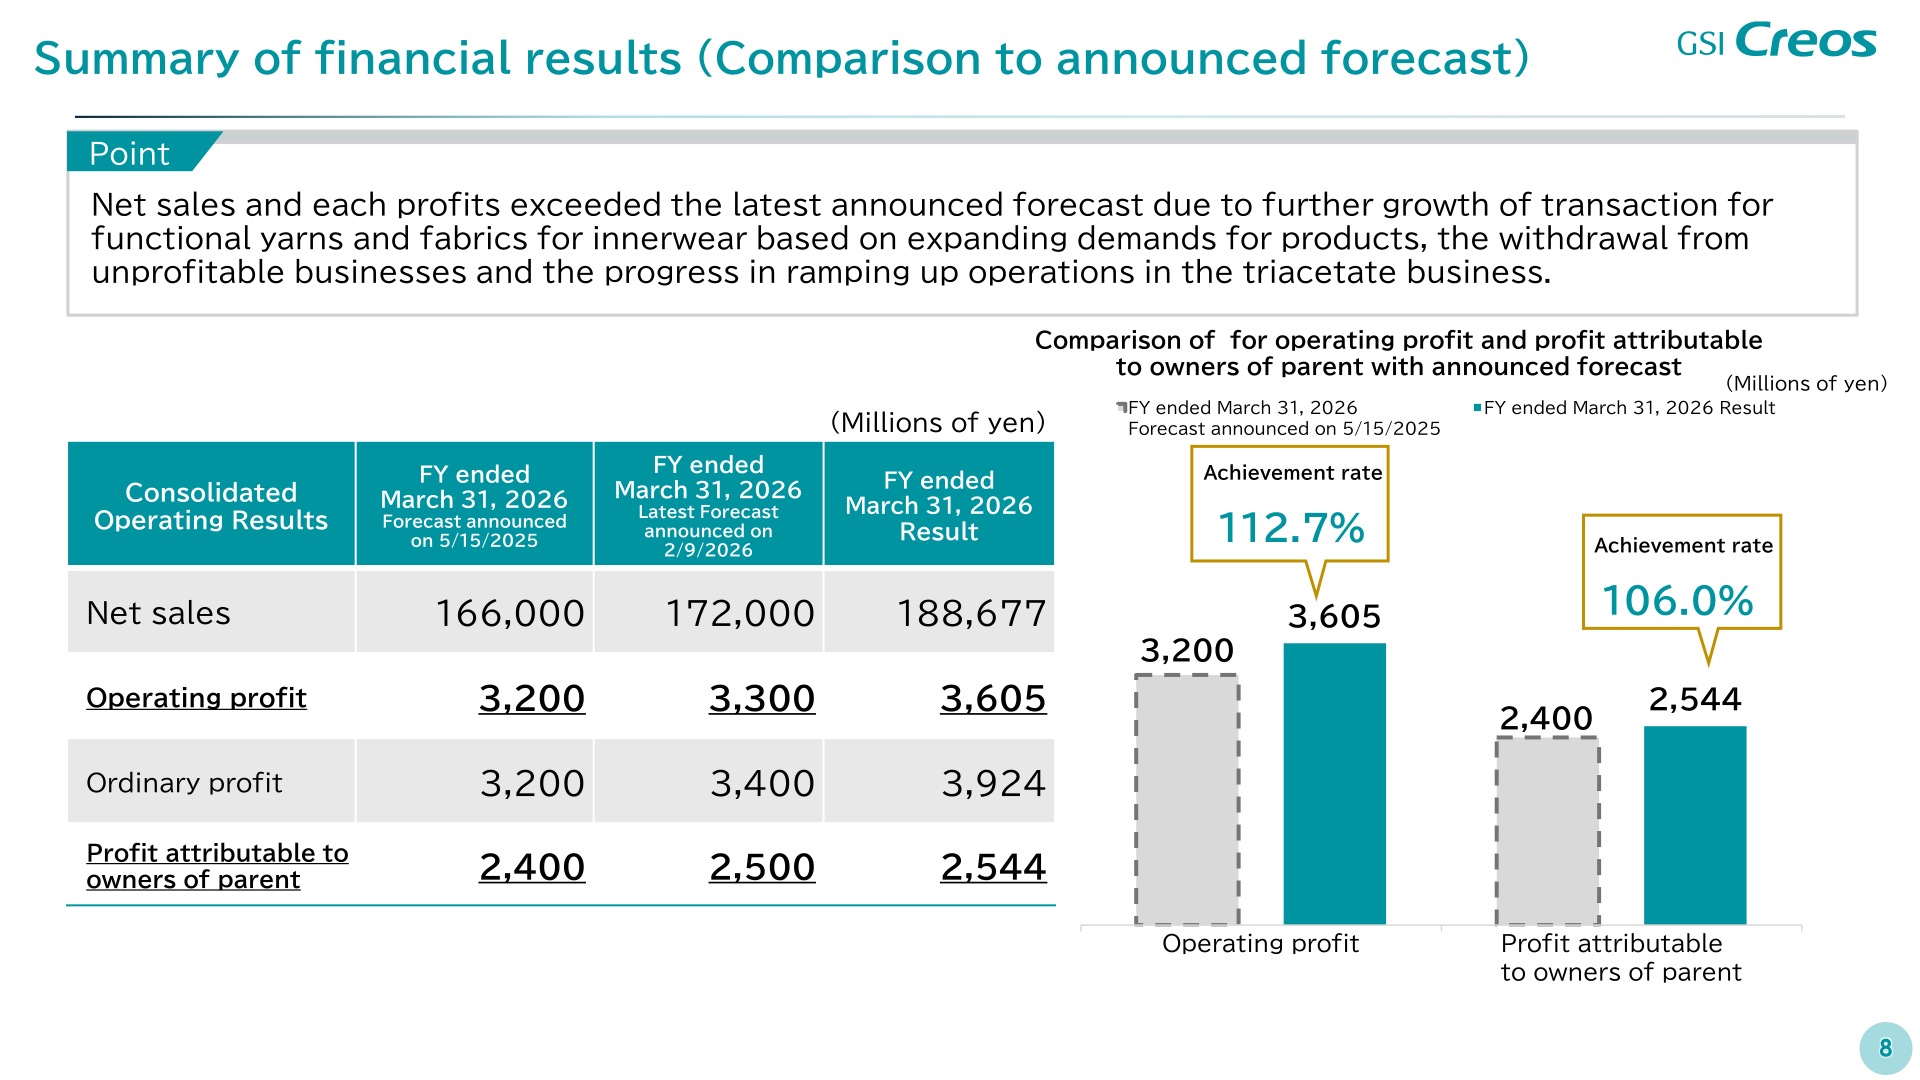
Figures are in millions of yen unless otherwise noted. Results exceeded the company’s latest forecast, announced on February 9, 2026, with an achievement rate of 112.7% for operating profit and 106.0% for profit attributable to owners of parent, versus the initial forecast announced on May 15, 2025.
On the balance sheet, total assets rose to ¥89,305 million (up ¥9,339 million), mainly due to an increase in accounts receivable, while liabilities increased to ¥57,095 million (up ¥7,215 million) mainly due to an increase in notes and accounts payable. Net assets and equity both rose to ¥32,210 million (up ¥2,124 million), reflecting an increase in capital from profit attributable to owners of parent, while the equity-to-asset ratio declined to 36.1% from 37.6%. Cash flow from operating activities was ¥4,843 million (up from ¥2,713 million), mainly due to an increase in trade payables, and free cash flow rose to ¥2,916 million from ¥1,758 million. Cash flow used in investing activities was ¥(1,927) million, mainly for the purchase of shares of subsidiaries resulting in a change in the scope of consolidation, and cash flow used in financing activities was ¥(3,221) million, mainly due to a net decrease in short-term borrowings.
Segment Results
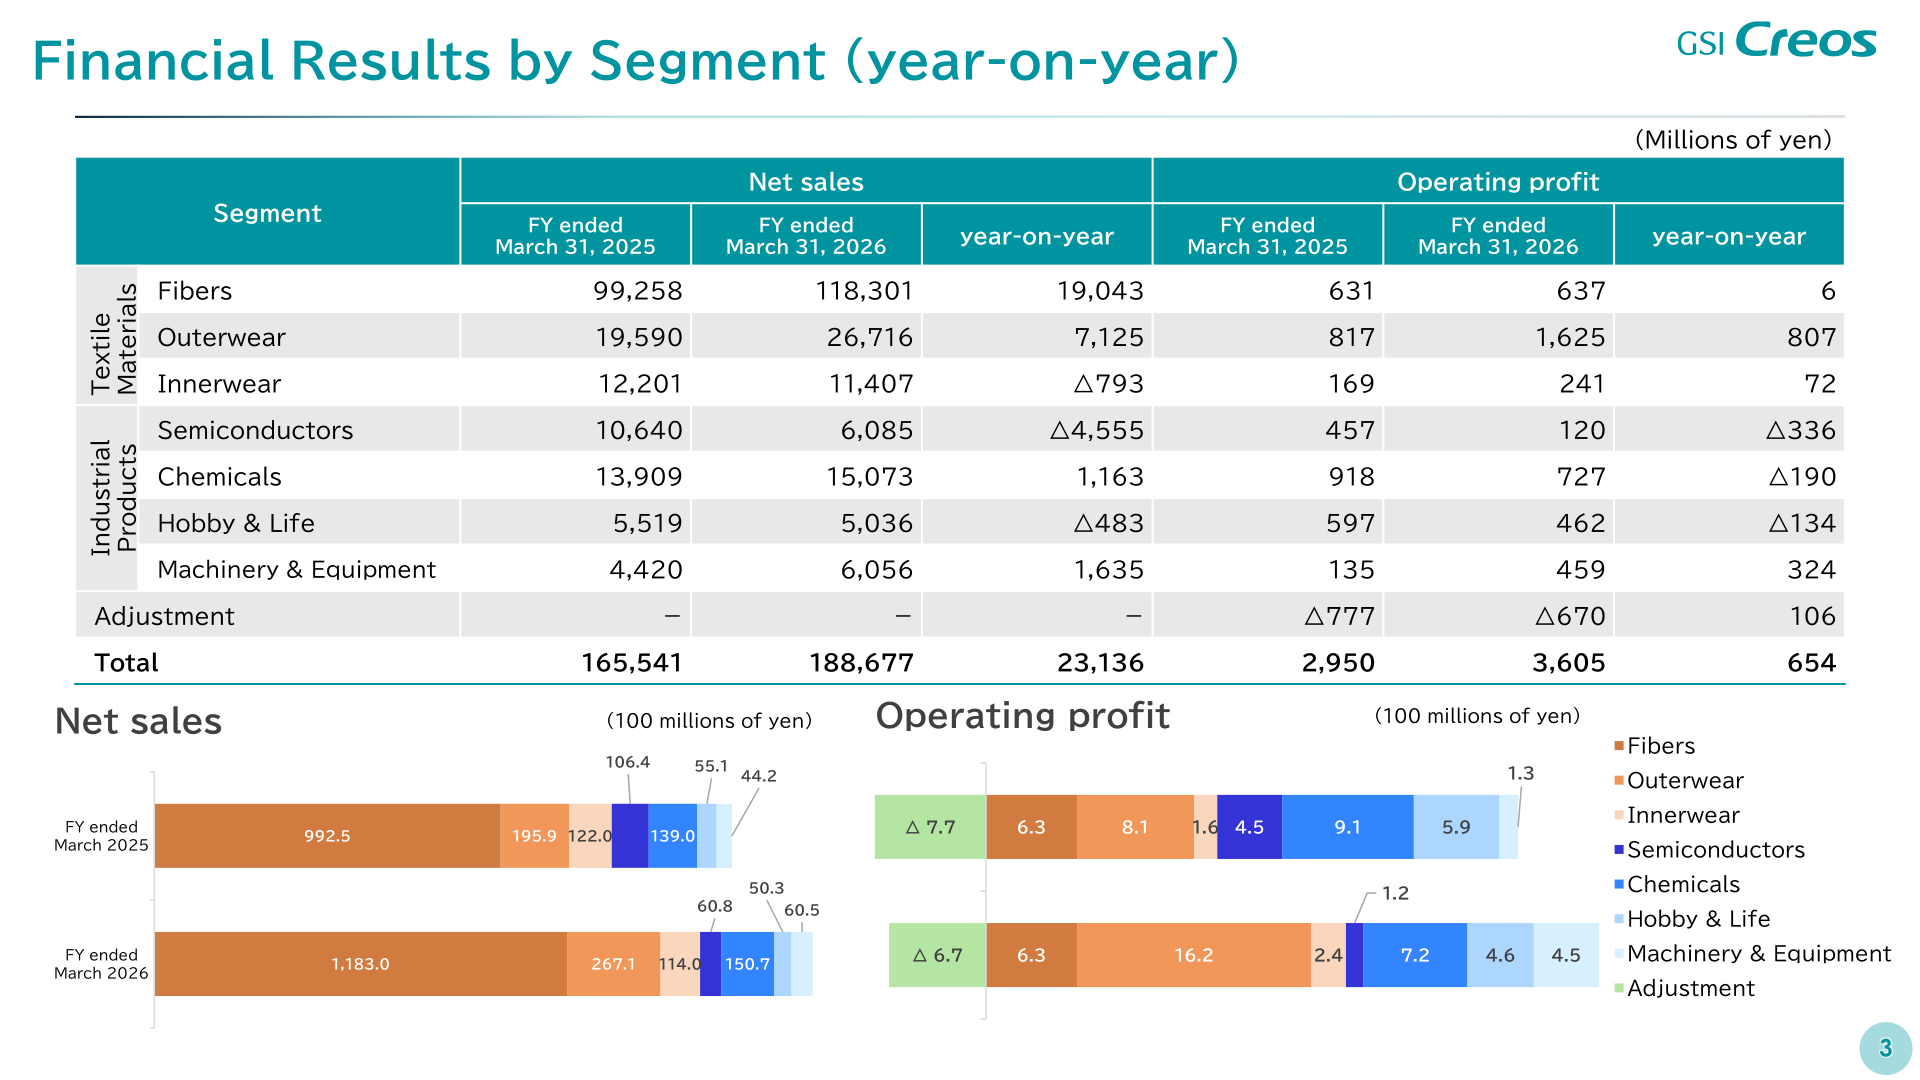
GSI Creos reports results by two business segments, Textile Materials and Industrial Products, each further broken down by product line. Textile Materials net sales rose to ¥156,425 million from ¥131,049 million, with operating profit up to ¥2,504 million from ¥1,618 million. Industrial Products net sales declined to ¥32,251 million from ¥34,491 million, with operating profit down to ¥1,770 million from ¥2,108 million.
| Segment / Product Line | Net Sales (FY2026) | Net Sales (FY2025) | Net Sales YoY | Operating Profit (FY2026) | Operating Profit (FY2025) | Operating Profit YoY |
|---|---|---|---|---|---|---|
| Fibers | 118,301 | 99,258 | 19,043 | 637 | 631 | 6 |
| Outerwear | 26,716 | 19,590 | 7,125 | 1,625 | 817 | 807 |
| Innerwear | 11,407 | 12,201 | △793 | 241 | 169 | 72 |
| Semiconductors | 6,085 | 10,640 | △4,555 | 120 | 457 | △336 |
| Chemicals | 15,073 | 13,909 | 1,163 | 727 | 918 | △190 |
| Hobby & Life | 5,036 | 5,519 | △483 | 462 | 597 | △134 |
| Machinery & Equipment | 6,056 | 4,420 | 1,635 | 459 | 135 | 324 |
| Adjustment | – | – | – | △670 | △777 | 106 |
| Total | 188,677 | 165,541 | 23,136 | 3,605 | 2,950 | 654 |
By product line, Outerwear (export textiles to the U.S. and OEM transactions, plus the triacetate business) and Machinery & Equipment (large-scale transactions of composite manufacturing equipment and industrial machinery) were the strongest contributors to profit growth, while Semiconductors declined due to U.S. restrictions on semiconductor exports to China and a change in commercial flow in semiconductor transactions, and Chemicals declined due to an inventory write-down despite robust sales of paint raw materials.
Overseas net sales increased significantly to ¥130,956 million (69.4% of consolidated net sales) from ¥116,363 million (70.3%) a year earlier. By region, net sales in Asia (mainly China and Hong Kong) rose to ¥119,614 million (63.4% of consolidated net sales) from ¥99,453 million (60.1%), while net sales in the Americas (mainly the U.S. and Brazil) fell to ¥6,348 million (3.4%) from ¥12,033 million (7.3%) due to a change in commercial flow in part of the semiconductor business. Net sales in Europe and others rose to ¥4,993 million (2.6%) from ¥4,876 million (2.9%).
FY2026 Forecast and Medium-Term Plan Progress
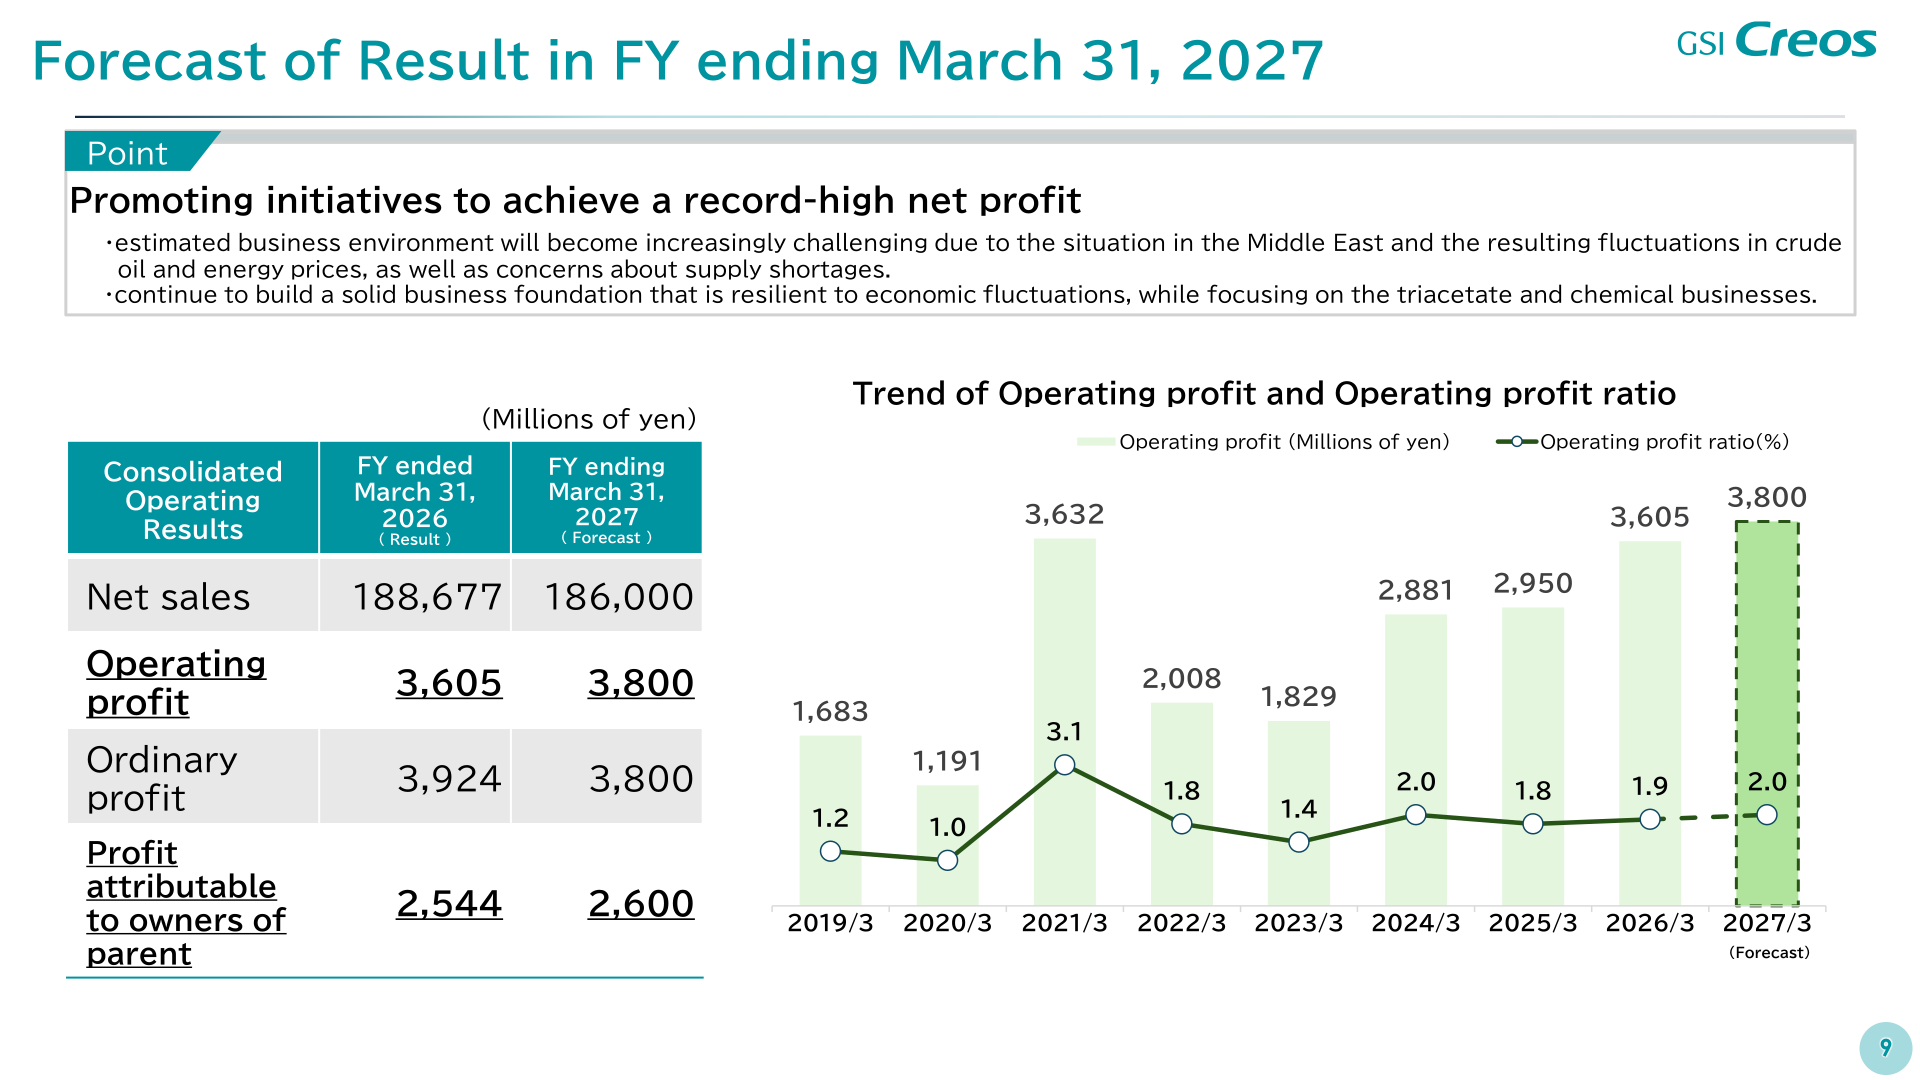
For the fiscal year ending March 31, 2027, GSI Creos forecasts net sales of ¥186,000 million, operating profit of ¥3,800 million, ordinary profit of ¥3,800 million, and profit attributable to owners of parent of ¥2,600 million. The company expects the business environment to become increasingly challenging due to the situation in the Middle East and resulting fluctuations in crude oil and energy prices, as well as concerns about supply shortages. GSI Creos plans to continue building a solid business foundation that is resilient to economic fluctuations while focusing on the triacetate and chemical businesses, as part of its efforts toward achieving a record-high net profit.
| Item | FY2026 (Actual, Year 1) | FY2027 (Forecast, Year 2) | FY2028 (Original Plan, Final Year) |
|---|---|---|---|
| Net sales | 188,677 | 186,000 | 177,000 |
| Operating profit | 3,605 | 3,800 | 4,000 |
| Ordinary profit | 3,924 | 3,800 | 4,000 |
| Profit attributable to owners of parent | 2,544 | 2,600 | 3,000 |
| Payout ratio | 50.2% | 50.0% | 50.0% or more |
These figures track progress under the medium-term management plan “GSI CONNECT Phase2,” which targets a dividend payout ratio of 50.0% or more, with progressive dividends of at least ¥100 per share, through its final year (fiscal year ending March 31, 2028).
Shareholder Returns
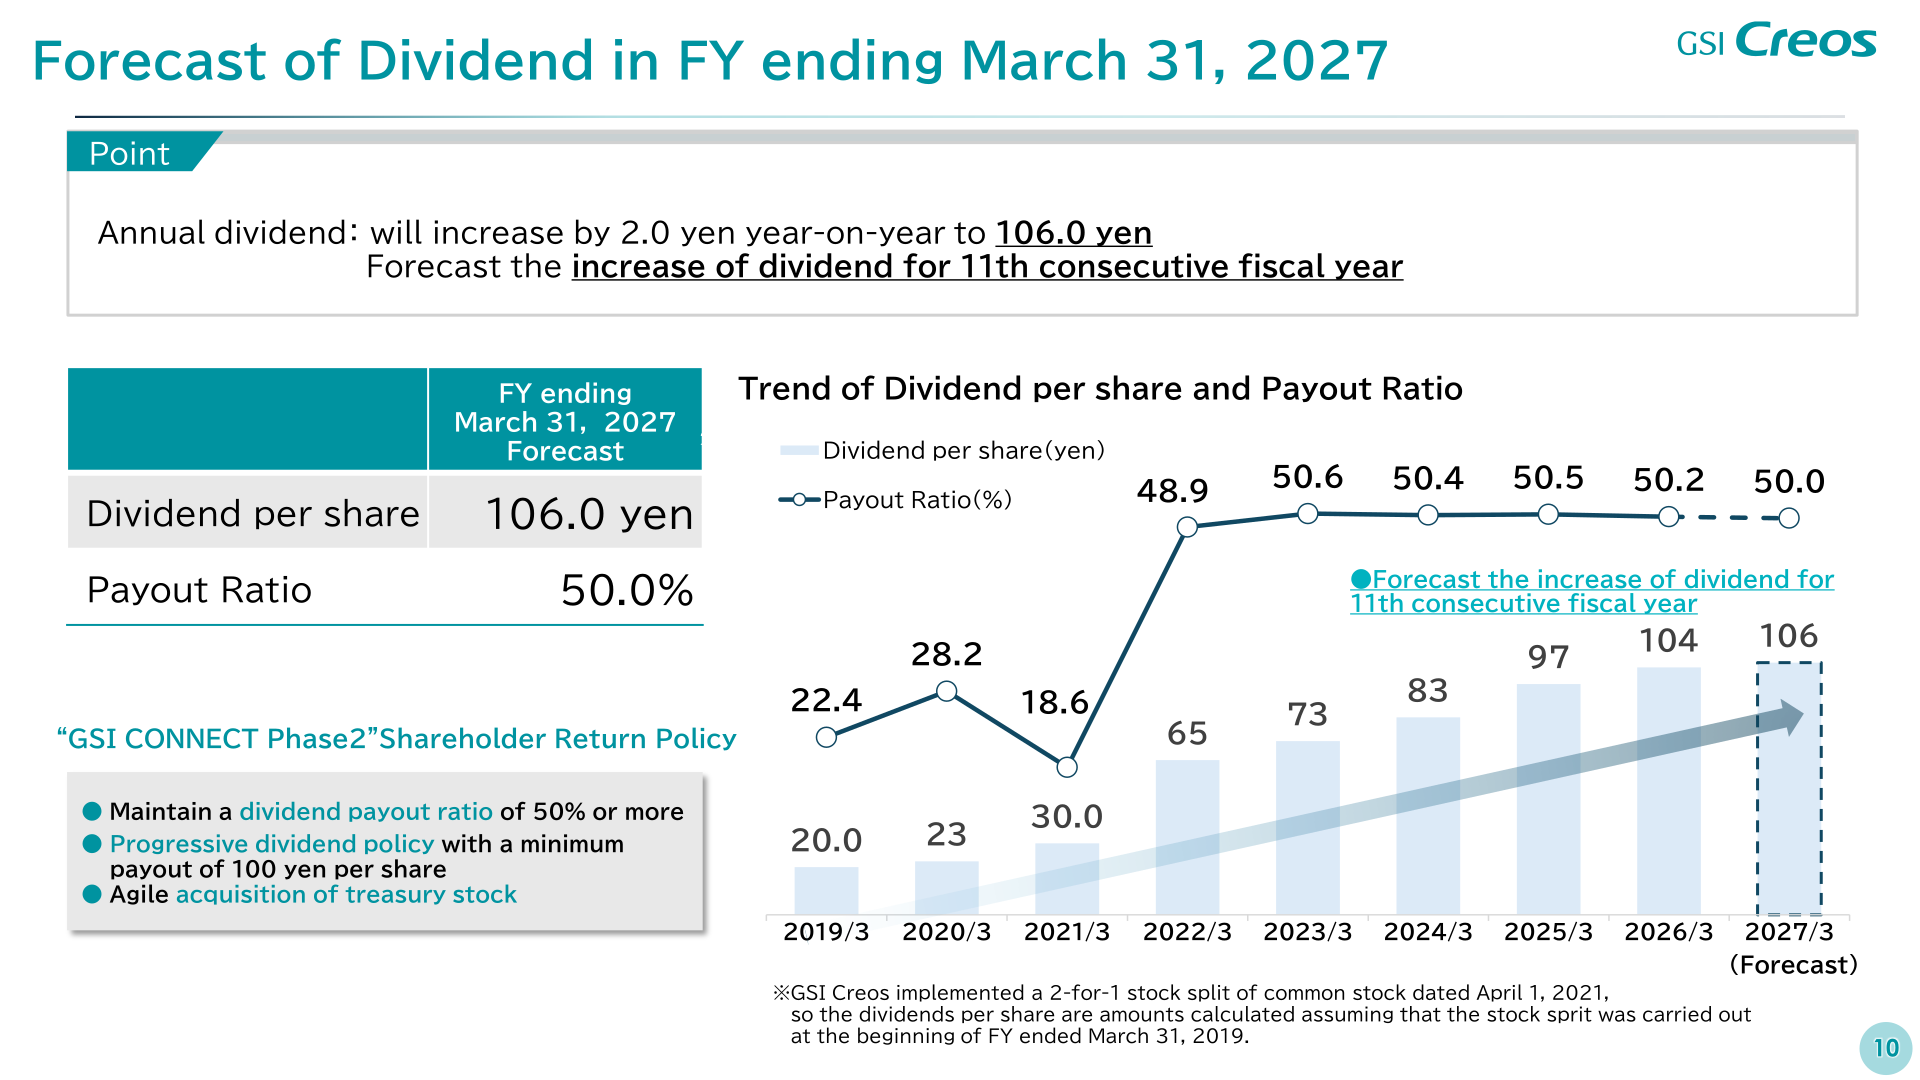
GSI Creos paid a full-year dividend per share of ¥104 for the fiscal year ended March 31, 2026, up from ¥97 in the prior fiscal year, for a payout ratio of 50.2% (down from 50.5%). For the fiscal year ending March 31, 2027, the company forecasts a dividend per share of ¥106.0 yen — an increase of ¥2.0 yen year on year — which would mark its 11th consecutive fiscal year of dividend increases, with a payout ratio of 50.0%. Under the shareholder return policy of its “GSI CONNECT Phase2” medium-term management plan, GSI Creos aims to maintain a dividend payout ratio of 50% or more, pursue a progressive dividend policy with a minimum payout of ¥100 per share, and make agile acquisitions of treasury stock.
| Item | FY ended March 31, 2025 (Actual) | FY ended March 31, 2026 (Actual) | FY ending March 31, 2027 (Forecast) |
|---|---|---|---|
| Dividend per share (yen) | 97 | 104 | 106.0 |
| Payout ratio (%) | 50.5 | 50.2 | 50.0 |
This article is an analysis based on publicly available information and is not a recommendation to buy or sell any specific securities. Investment decisions are your own responsibility.
















