
This article is based on publicly available IR materials and is not a recommendation to buy or sell any specific securities.
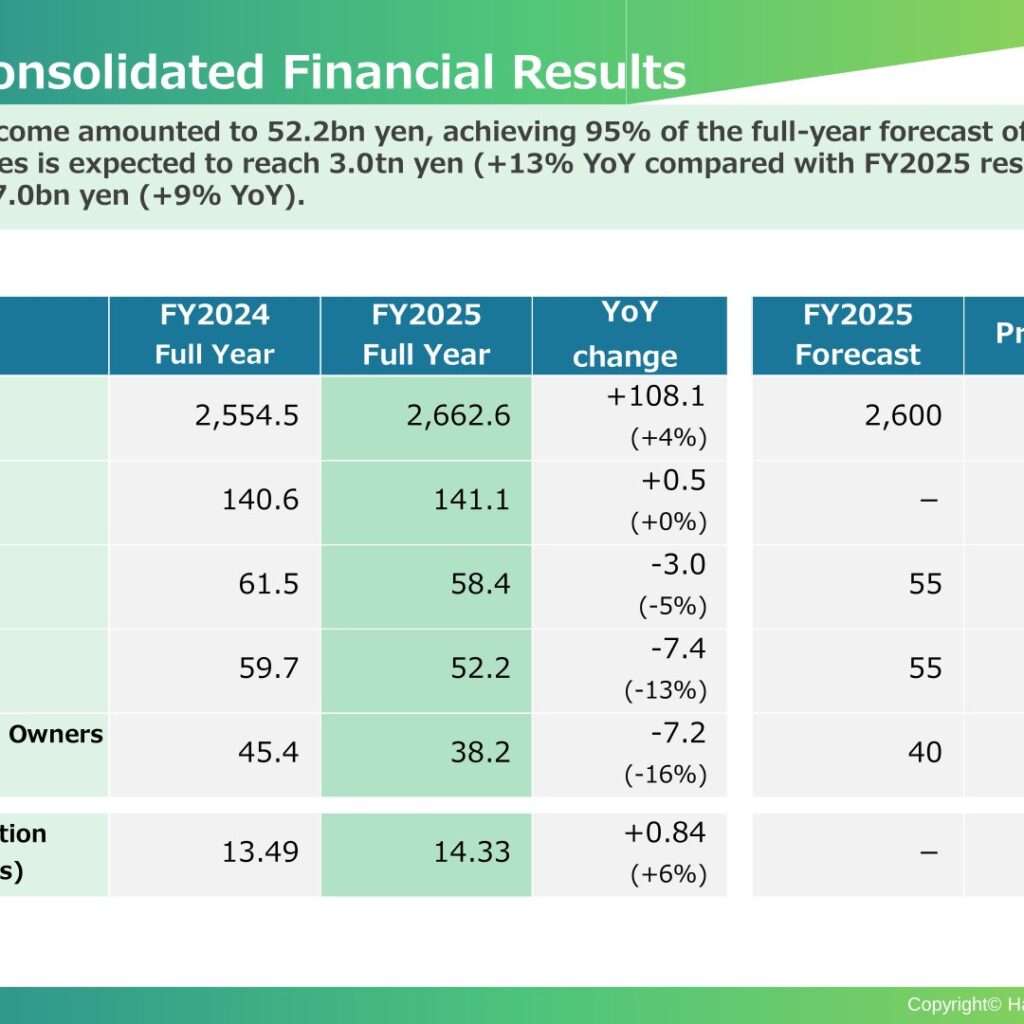
Hanwa Co., Ltd., a diversified trading company handling steel, primary metal, metal recycling, food, energy and living materials, housing materials and machinery, reported consolidated net sales of 2,662.6 billion yen for FY2025 (the fiscal year ended March 31, 2026), up 108.1 billion yen (+4%) year on year and 102% of the full-year forecast. Operating income fell 3.0 billion yen (-5%) to 58.4 billion yen and ordinary income fell 7.4 billion yen (-13%) to 52.2 billion yen, achieving 95% of the full-year forecast of 55.0 billion yen. Net income attributable to owners of the company declined 7.2 billion yen (-16%) to 38.2 billion yen, or 96% of the forecast. For FY2026, the company expects net sales of 3,000.0 billion yen (+13% YoY) and ordinary income of 57.0 billion yen (+9% YoY).
Consolidated Results (FY2025 Full-Year Actual)
Gross profit was essentially flat at 141.1 billion yen (+0.5 billion yen, +0%), while consolidated steel transaction volume rose to 14.33 million metric tons from 13.49 million metric tons (+0.84 million tons, +6%). On the balance sheet, total assets increased 46.8 billion yen (+4%) to 1,212.6 billion yen as of March 2026, mainly reflecting higher investment securities and cash and deposits. Owner’s equity rose 44.4 billion yen (+12%) to 427.4 billion yen and the owner’s equity ratio improved 2.4 points to 35.3% (37.3% taking account of the hybrid loan). Interest-bearing debt fell 25.2 billion yen (-7%) to 357.0 billion yen and net interest-bearing debt fell 45.6 billion yen (-14%) to 271.4 billion yen, lowering the net D/E ratio 19 points to 63% (54% taking account of the hybrid loan).
| Item (Billions of Yen) | FY2024 Full Year | FY2025 Full Year | YoY Change | FY2025 Forecast | Progress |
|---|---|---|---|---|---|
| Net Sales | 2,554.5 | 2,662.6 | +108.1 (+4%) | 2,600 | 102% |
| Gross Profit | 140.6 | 141.1 | +0.5 (+0%) | – | – |
| Operating Income | 61.5 | 58.4 | -3.0 (-5%) | 55 | 106% |
| Ordinary Income | 59.7 | 52.2 | -7.4 (-13%) | 55 | 95% |
| Net Income Attributable to Owners of the Company | 45.4 | 38.2 | -7.2 (-16%) | 40 | 96% |
| Consolidated Steel Transaction Volume (million metric tons) | 13.49 | 14.33 | +0.84 (+6%) | – | – |
Segment Results (Ordinary Income)
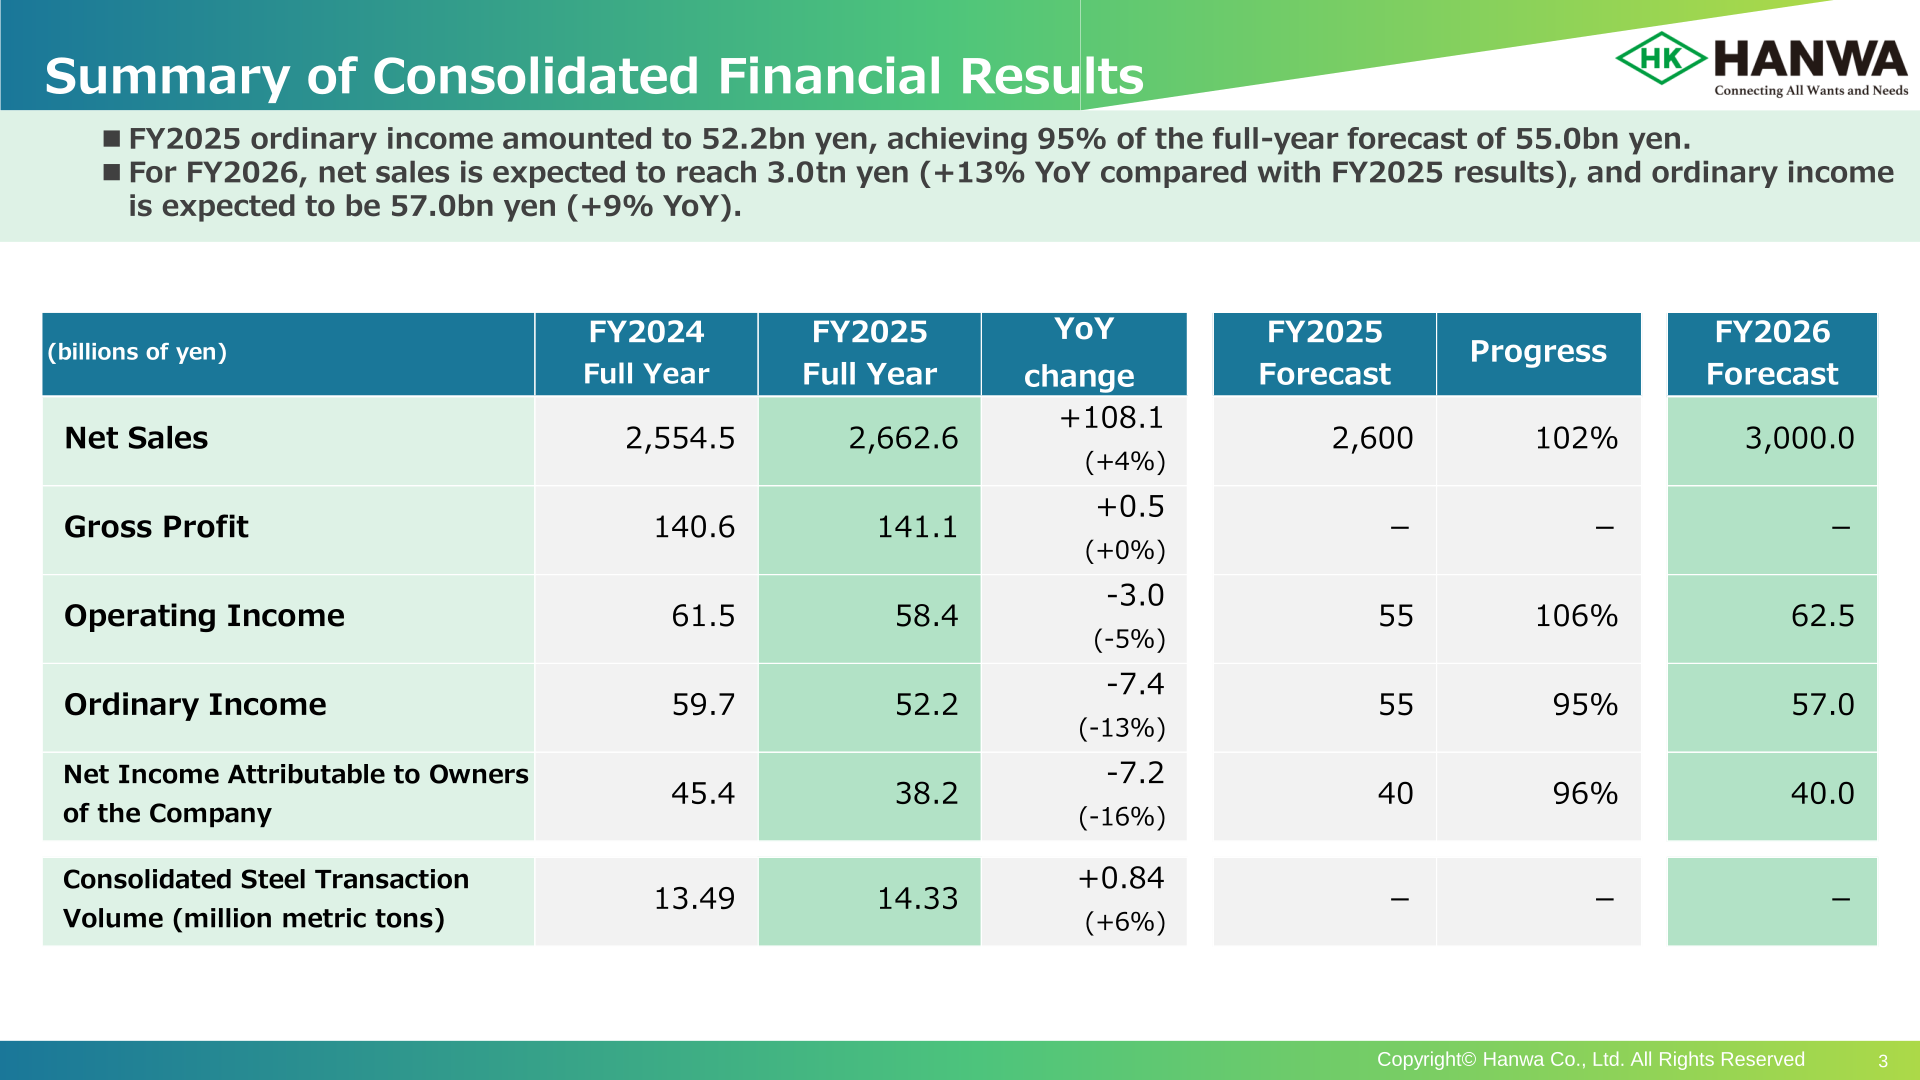
By business segment, Steel ordinary income increased 5.5 billion yen (+17%) to 38.7 billion yen, driven by improved profitability at certain overseas subsidiaries and an expansion in equity-method investment income. Primary Metal swung to a 0.1 billion yen loss from a 6.0 billion yen profit (-6.2 billion yen) due to equity in losses from SAMANCOR CHROME HOLDINGS PROPRIETARY LTD. Metal Recycling fell 1.7 billion yen (-58%) to 1.3 billion yen on deteriorating profitability in aluminum and other segments. Foods rose 0.7 billion yen (+32%) to 3.0 billion yen on sales growth to the food service industry at a US subsidiary and a newly consolidated subsidiary. Energy & Living Materials fell 1.8 billion yen (-18%) to 8.5 billion yen on sluggish crude oil prices and deteriorating chemicals profitability. Overseas Sales Subsidiaries fell 2.7 billion yen (-33%) to 5.5 billion yen mainly on deteriorating steel products profitability, and Other fell 0.2 billion yen (-11%) to 2.1 billion yen, reflecting a sluggish European lumber market in housing materials and a deterioration in profitability at a domestic subsidiary in machinery.
| Segment | FY2024 Full Year | FY2025 Full Year | YoY Change (Rate) |
|---|---|---|---|
| Steel | 33.1 | 38.7 | +5.5 (+17%) |
| Primary Metal | 6.0 | -0.1 | -6.2 (–) |
| Metal Recycling | 3.0 | 1.3 | -1.7 (-58%) |
| Foods | 2.3 | 3.0 | +0.7 (+32%) |
| Energy & Living Materials | 10.4 | 8.5 | -1.8 (-18%) |
| Overseas Sales Subsidiaries | 8.2 | 5.5 | -2.7 (-33%) |
| Other | 2.4 | 2.1 | -0.2 (-11%) |
| Adjustment | -5.9 | -6.8 | -0.8 (–) |
| Total | 59.7 | 52.2 | -7.4 (-13%) |
FY2026 Forecast
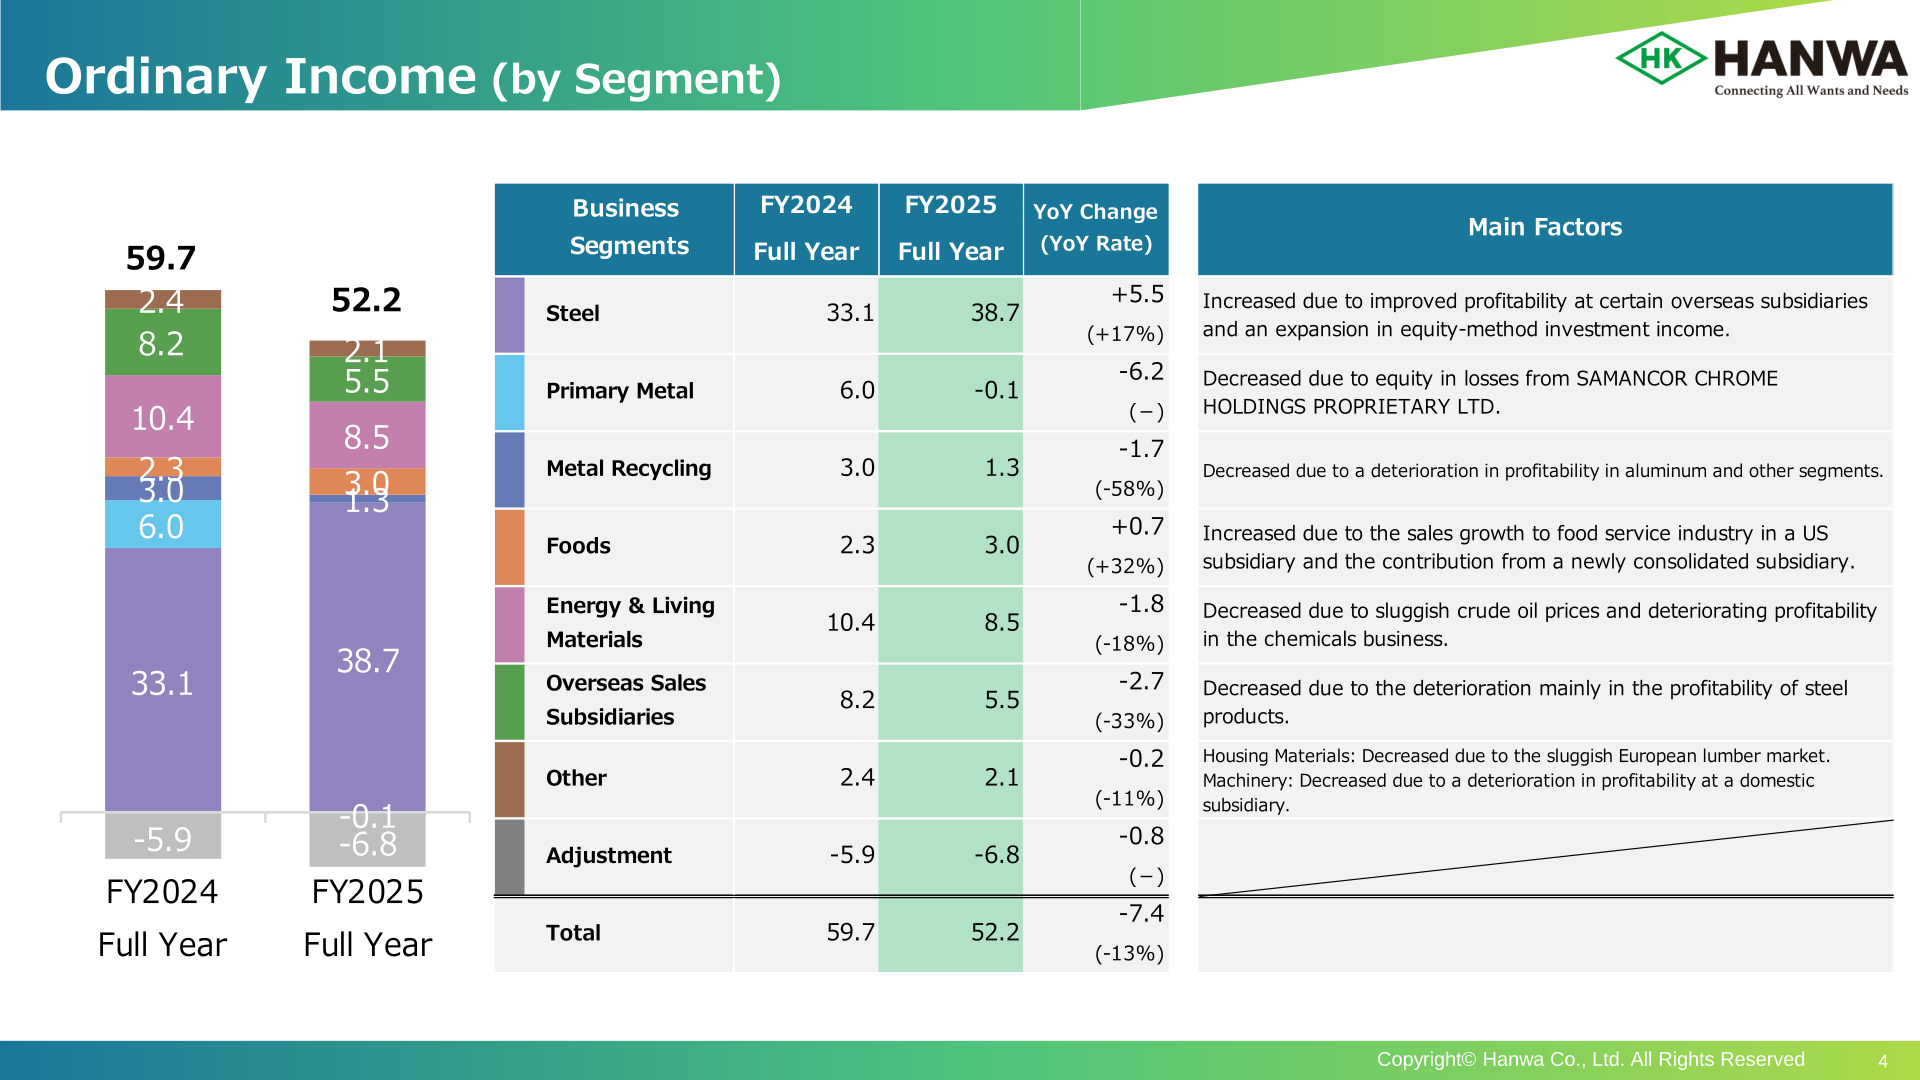
For FY2026, Hanwa forecasts consolidated net sales of 3,000.0 billion yen (+13% YoY) and ordinary income of 57.0 billion yen (+4.7 billion yen, +9% YoY). By segment, Steel is forecast to decline 4.7 billion yen (-12%) to 34.0 billion yen on deteriorating profitability in construction contracts, sluggish growth in transaction volumes amid trade issues, and a decrease in equity in earnings of affiliates. Primary Metal is forecast to recover to 4.5 billion yen (+4.6 billion yen) on improved equity method earnings from Samancor. Metal Recycling is forecast to rise 2.1 billion yen (+169%) to 3.5 billion yen on improved profitability of aluminum, copper and other non-ferrous metals. Foods is forecast to rise 0.4 billion yen (+15%) to 3.5 billion yen, and Energy & Living Materials is forecast to rise 1.4 billion yen (+17%) to 10.0 billion yen on stronger domestic demand for petroleum-related products and expansion of businesses such as biomass fuels. Overseas Sales Subsidiaries is forecast to rise 0.9 billion yen (+18%) to 6.5 billion yen on a recovery in the ASEAN steel market and higher transaction volumes, and Other is forecast to rise 1.3 billion yen (+64%) to 3.5 billion yen on stable performance in businesses such as housing materials.
| Segment | FY2025 Results | FY2026 Forecast | YoY Change (Rate) |
|---|---|---|---|
| Steel | 38.7 | 34.0 | ▲4.7 (-12%) |
| Primary Metal | ▲0.1 | 4.5 | +4.6 (–) |
| Metal Recycling | 1.3 | 3.5 | +2.1 (+169%) |
| Foods | 3.0 | 3.5 | +0.4 (+15%) |
| Energy & Living Materials | 8.5 | 10.0 | +1.4 (+17%) |
| Overseas Sales Subsidiaries | 5.5 | 6.5 | +0.9 (+18%) |
| Other | 2.1 | 3.5 | +1.3 (+64%) |
| Adjustment | ▲6.8 | ▲8.5 | ▲1.6 (–) |
| Total | 52.2 | 57.0 | +4.7 (+9%) |
Shareholder Returns
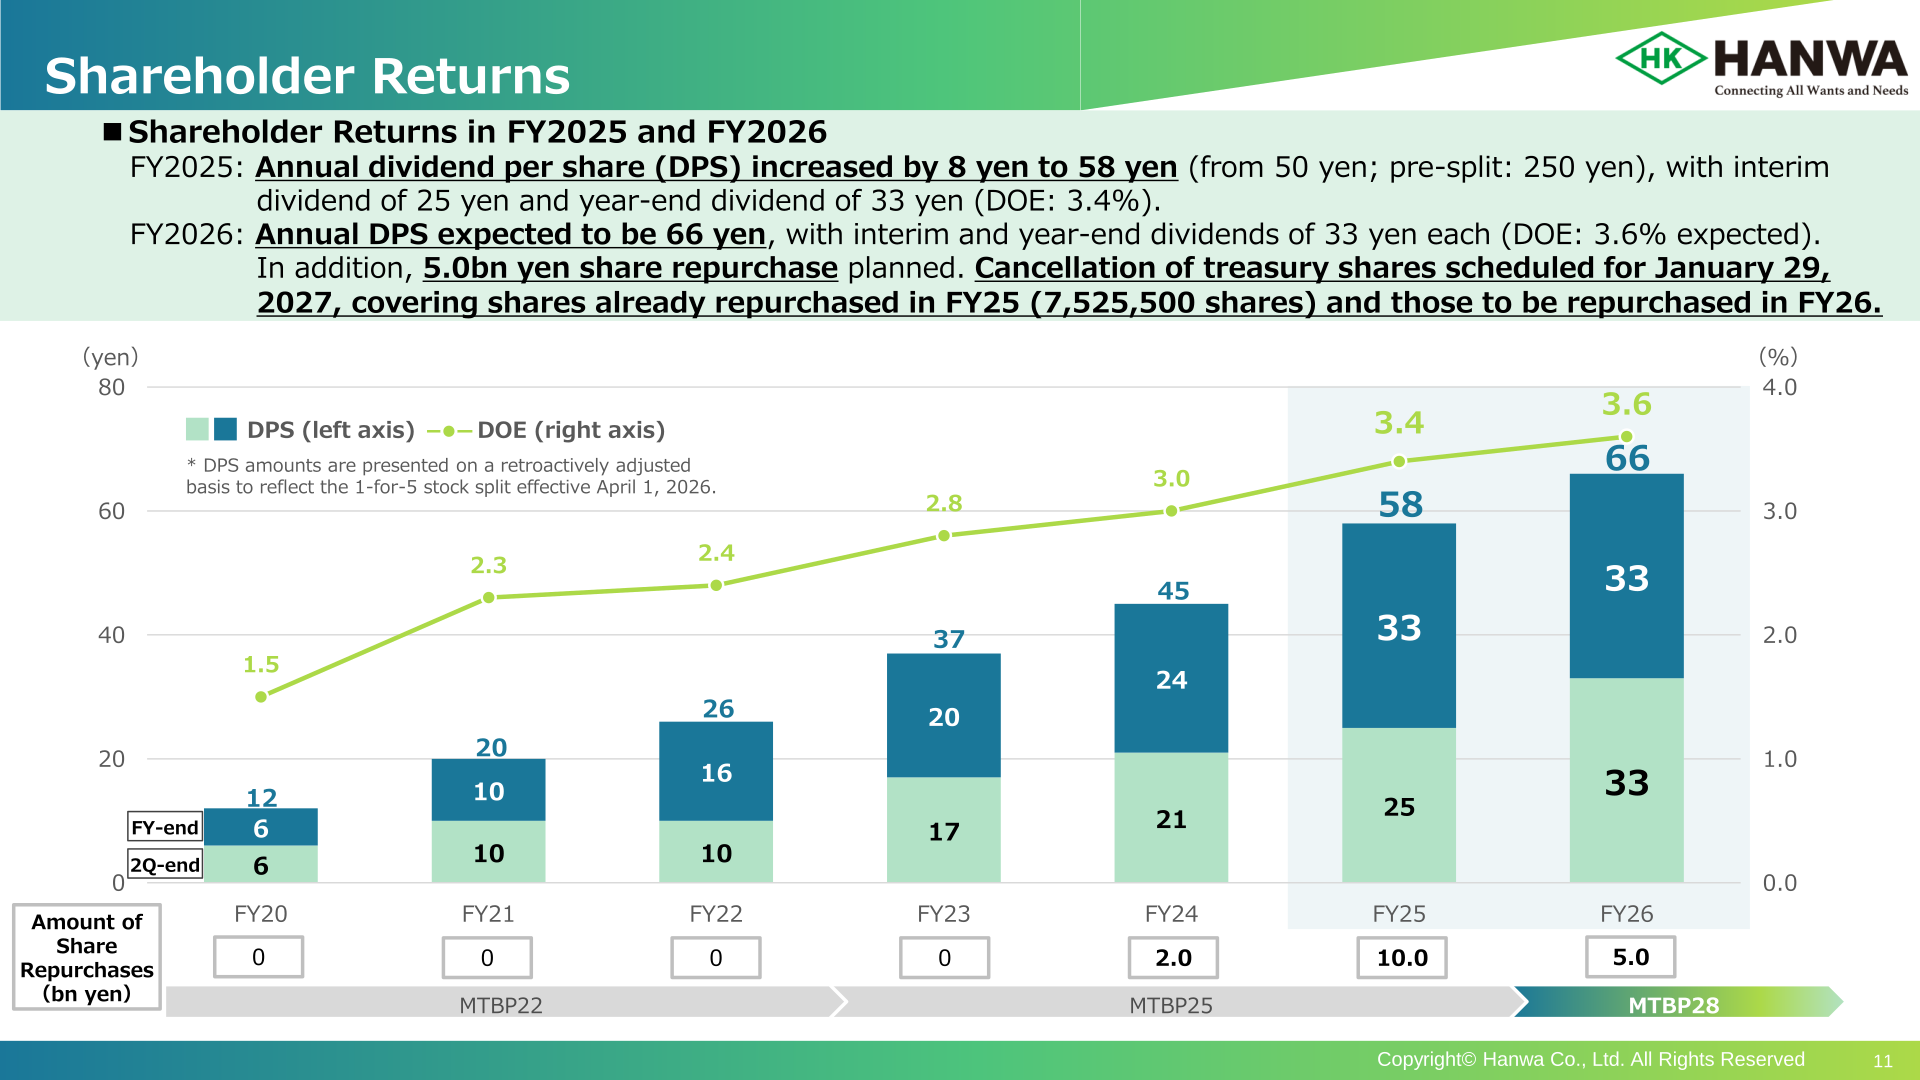
For FY2025, annual dividend per share (DPS) increased by 8 yen to 58 yen (from 50 yen; equivalent to 250 yen on a pre-split basis), comprising an interim dividend of 25 yen and a year-end dividend of 33 yen, for a dividend on equity (DOE) of 3.4%. Note: DPS figures are presented on a retroactively adjusted basis to reflect the 1-for-5 stock split effective April 1, 2026. For FY2026, annual DPS is expected to be 66 yen, with interim and year-end dividends of 33 yen each (DOE: 3.6% expected). The company also plans a 5.0 billion yen share repurchase in FY2026, following a 10.0 billion yen repurchase in FY2025. Cancellation of treasury shares is scheduled for January 29, 2027, covering the 7,525,500 shares already repurchased in FY2025 together with those to be repurchased in FY2026.
| Item | FY2025 | FY2026 (Forecast) |
|---|---|---|
| Annual DPS (yen) | 58 | 66 |
| Interim Dividend (yen) | 25 | 33 |
| Year-End Dividend (yen) | 33 | 33 |
| DOE | 3.4% | 3.6% (expected) |
| Share Repurchases (billions of yen) | 10.0 | 5.0 |
Medium-Term Business Plan 2025 (MTBP25) Progress
During the MTBP25 period (FY2023-FY2025), Hanwa sold 62 strategic shareholdings for a cumulative 12.2 billion yen, reducing the ratio of strategic shareholdings to consolidated net assets from 21.7% at the end of FY2022 to 15.7% at the end of FY2025 (108 stocks held, of which 50 listed and 58 unlisted). Under the follow-on MTBP28 plan, the company aims to reduce this ratio to 10% of consolidated net assets, excluding stocks with offtake rights. Over the MTBP25 period, cash inflows totaled approximately 149.0 billion yen, comprising 125.5 billion yen of core operating cash flow and 23.5 billion yen from asset recycling (12.2 billion yen from reduction of strategic shareholdings, 3.7 billion yen from sale of tangible fixed assets, and 7.4 billion yen from business divestments). Cash outflows of 149.0 billion yen comprised 68.8 billion yen of investments (38.5 billion yen in equity investments including M&A and 30.3 billion yen in capital expenditures), 37.1 billion yen of shareholder returns (25.1 billion yen dividends and 12.0 billion yen share repurchases), and 43.1 billion yen used to strengthen the financial base and internal reserves. The MTBP25 investment budget of 80.0 billion yen was executed at an 86% utilization rate. Profit contributions from the “SOKOKA” strategy and overseas expansion investments made in the 8th to 10th medium-term business plans (FY2016-FY2025) totaled approximately 9.8 billion yen on a cumulative investment of approximately 37.2 billion yen, an ROI of about 5.6%, and the ratio of profitable consolidated subsidiaries improved 1.1 points year on year to 83.3% (66 consolidated subsidiaries, of which 55 profitable and 11 loss-making).
This article is an analysis based on publicly available information and is not a recommendation to buy or sell any specific securities. Investment decisions are your own responsibility.
















