
This article is based on publicly available IR materials and is not a recommendation to buy or sell any specific securities.
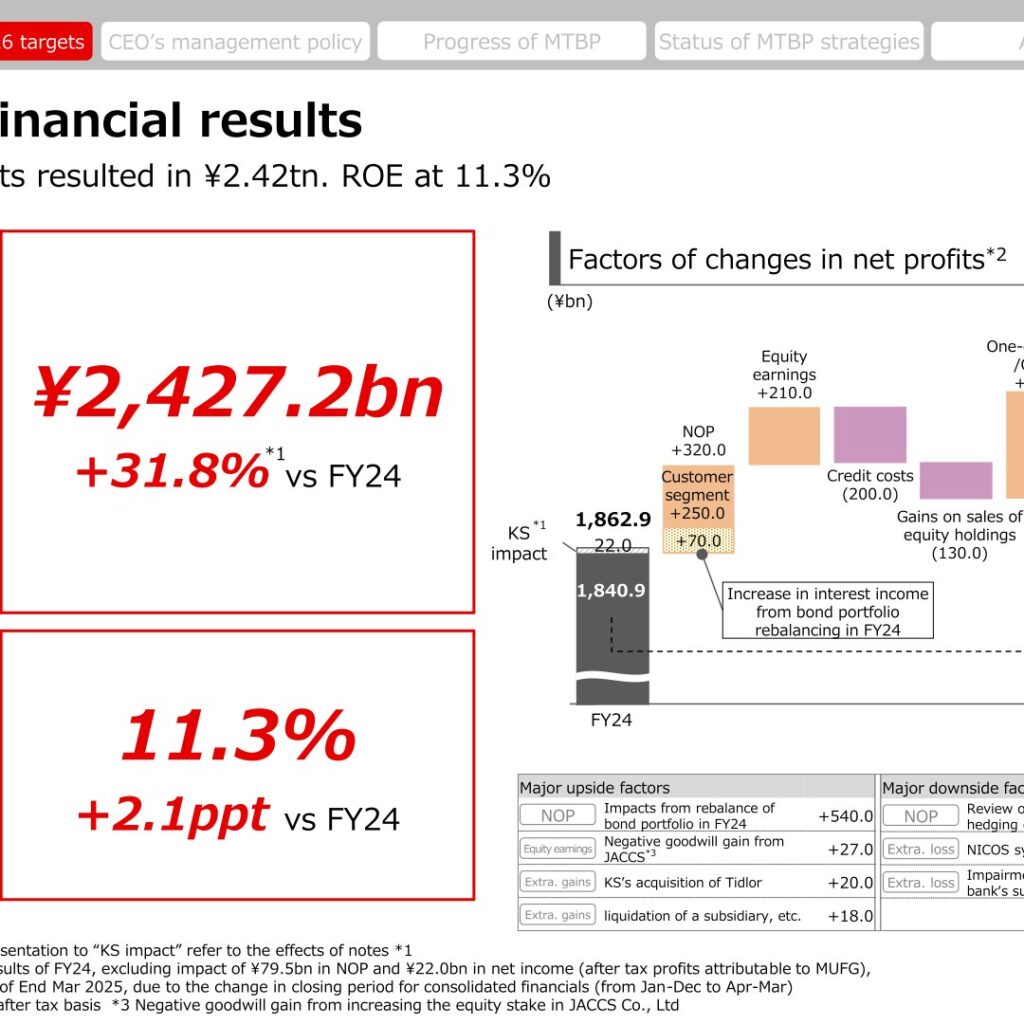
Mitsubishi UFJ Financial Group, Inc. (MUFG) reported consolidated profits attributable to owners of parent of ¥2,427.2bn for FY2025 (fiscal year ended March 2026), up 31.8% year on year and a record high for the third consecutive year. ROE (JPX basis) rose 2.1 percentage points to 11.3%. Net operating profits increased ¥786.0bn to ¥2,377.2bn, driven by growth in net interest income from higher JPY interest rates and continued strength in fee revenues, while total credit costs increased to ¥(355.8)bn. For FY2026, the final year of its medium-term business plan (MTBP), MUFG targets net profits of ¥2.70tn and an ROE of approximately 12%.
Consolidated Results (Full-Year Actual)
Gross profits rose ¥1,125.1bn to ¥5,944.4bn, reflecting growth in net interest income from higher JPY interest rates, the rebound from last year’s bond portfolio rebalancing losses, and growth in fee revenues from domestic and overseas lending and solution businesses, together with contributions from acquisitions. G&A expenses increased ¥339.1bn to ¥3,567.2bn on strategic expense allocation for growth as well as the impact of acquisitions and inflation, while the expense ratio improved 6.9ppt to 60.0%. Total credit costs increased to ¥(355.8)bn, reflecting the rebound from a reversal of large overseas loan loss provisions recorded in the previous year, and the accounting also factored in the potential increase in future credit risk associated with the situation in the Middle East. Equity in earnings of equity method investees rose ¥248.5bn to ¥845.5bn on strong performance at Morgan Stanley.
| Item | FY2025 | FY2024 | YoY Change |
|---|---|---|---|
| Gross profits (¥bn) | 5,944.4 | 4,819.3 | +1,125.1 |
| Net interest income (¥bn) | 3,006.2 | 2,876.5 | +129.6 |
| Trust fees + Net fees and commissions (¥bn) | 2,389.9 | 2,090.2 | +299.7 |
| Net trading profits (losses) + Net other operating profits (¥bn) | 548.2 | (147.4) | +695.7 |
| Net gains (losses) on debt securities (¥bn) | (177.2) | (991.4) | +814.1 |
| G&A expenses (¥bn) | 3,567.2 | 3,228.1 | +339.1 |
| Expense ratio | 60.0% | 66.9% | (6.9ppt) |
| Net operating profits (¥bn) | 2,377.2 | 1,591.1 | +786.0 |
| Total credit costs (¥bn) | (355.8) | (108.7) | (247.1) |
| Net gains (losses) on equity securities (¥bn) | 486.0 | 592.5 | (106.5) |
| Equity in earnings of equity method investees (¥bn) | 845.5 | 596.9 | +248.5 |
| Ordinary profits (¥bn) | 3,410.1 | 2,669.4 | +740.7 |
| Net extraordinary gains (losses) (¥bn) | (88.0) | (118.8) | +30.8 |
| Profits attributable to owners of parent (¥bn) | 2,427.2 | 1,862.9 | +564.2 (+31.8%) |
| ROE (JPX basis) | 11.3% | 9.3% | +2.1ppt |
Business Group Results
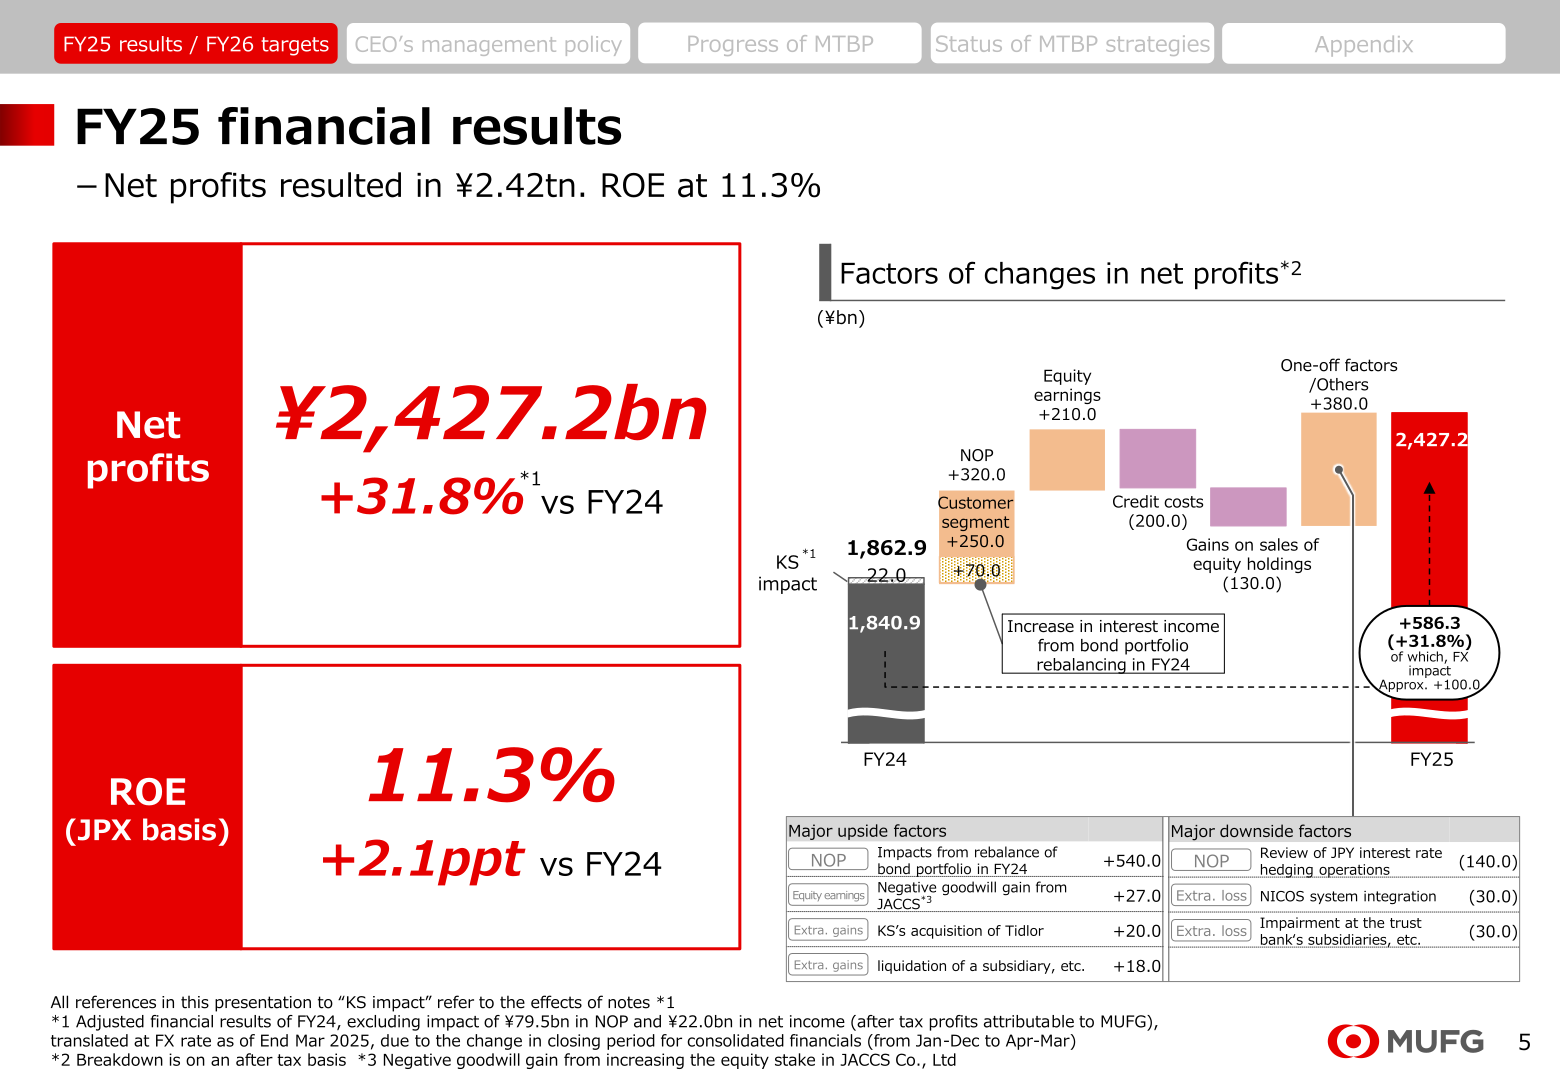
On a managerial accounting basis, net operating profits increased in nearly all business groups. Commercial Banking & Wealth Management (CWM) posted the largest increase, up ¥111.6bn to ¥399.2bn, followed by Japanese Corporate & Investment Banking (JCIB), up ¥59.0bn to ¥616.4bn. Global Markets (GM) swung from a net operating loss of ¥(649.4)bn in FY24 to a profit of ¥57.7bn in FY25, a rebound of ¥707.1bn driven mainly by the treasury business. Global Corporate & Investment Banking (GCIB) net operating profits rose ¥48.7bn to ¥388.3bn, while net profits declined ¥65.1bn to ¥270.7bn on higher credit costs. By group entity, net profits (contribution to MUFG’s consolidated net profits) were led by MUFG Bank at ¥1,135.2bn and Mitsubishi UFJ Trust and Banking Corporation at ¥188.5bn; equity in earnings from Morgan Stanley (MS) contributed ¥676.4bn, Krungsri (KS) contributed ¥125.5bn and Bank Danamon Indonesia (BDI) contributed ¥33.3bn, while Mitsubishi UFJ NICOS recorded a net loss of ¥(40.5)bn.
| Segment | Metric | FY2025 | FY2024 |
|---|---|---|---|
| Retail & Digital (R&D) | Net operating profits (¥bn) | 275.2 | 269.7 |
| Retail & Digital (R&D) | Net profits (¥bn) | 76.6 | 45.2 |
| Commercial Banking & Wealth Management (CWM) | Net operating profits (¥bn) | 399.2 | 287.6 |
| Commercial Banking & Wealth Management (CWM) | Net profits (¥bn) | 286.9 | 217.1 |
| Japanese Corporate & Investment Banking (JCIB) | Net operating profits (¥bn) | 616.4 | 557.3 |
| Japanese Corporate & Investment Banking (JCIB) | Net profits (¥bn) | 497.0 | 481.6 |
| Global Corporate & Investment Banking (GCIB) | Net operating profits (¥bn) | 388.3 | 339.7 |
| Global Corporate & Investment Banking (GCIB) | Net profits (¥bn) | 270.7 | 335.8 |
| Global Commercial Banking (GCB, incl. KS/BDI) | Net operating profits (¥bn) | 287.6 | 285.3 |
| Global Commercial Banking (GCB, incl. KS/BDI) | Net profits (¥bn) | 112.2 | 47.8 |
| Asset Management & Investor Services (AM/IS) | Net operating profits (¥bn) | 140.6 | 124.3 |
| Asset Management & Investor Services (AM/IS) | Net profits (¥bn) | 66.8 | 67.2 |
| Global Markets (GM) | Net operating profits (¥bn) | 57.7 | (649.4) |
| Global Markets (GM) | Net profits (¥bn) | 38.2 | (462.7) |
FY2026 Forecast
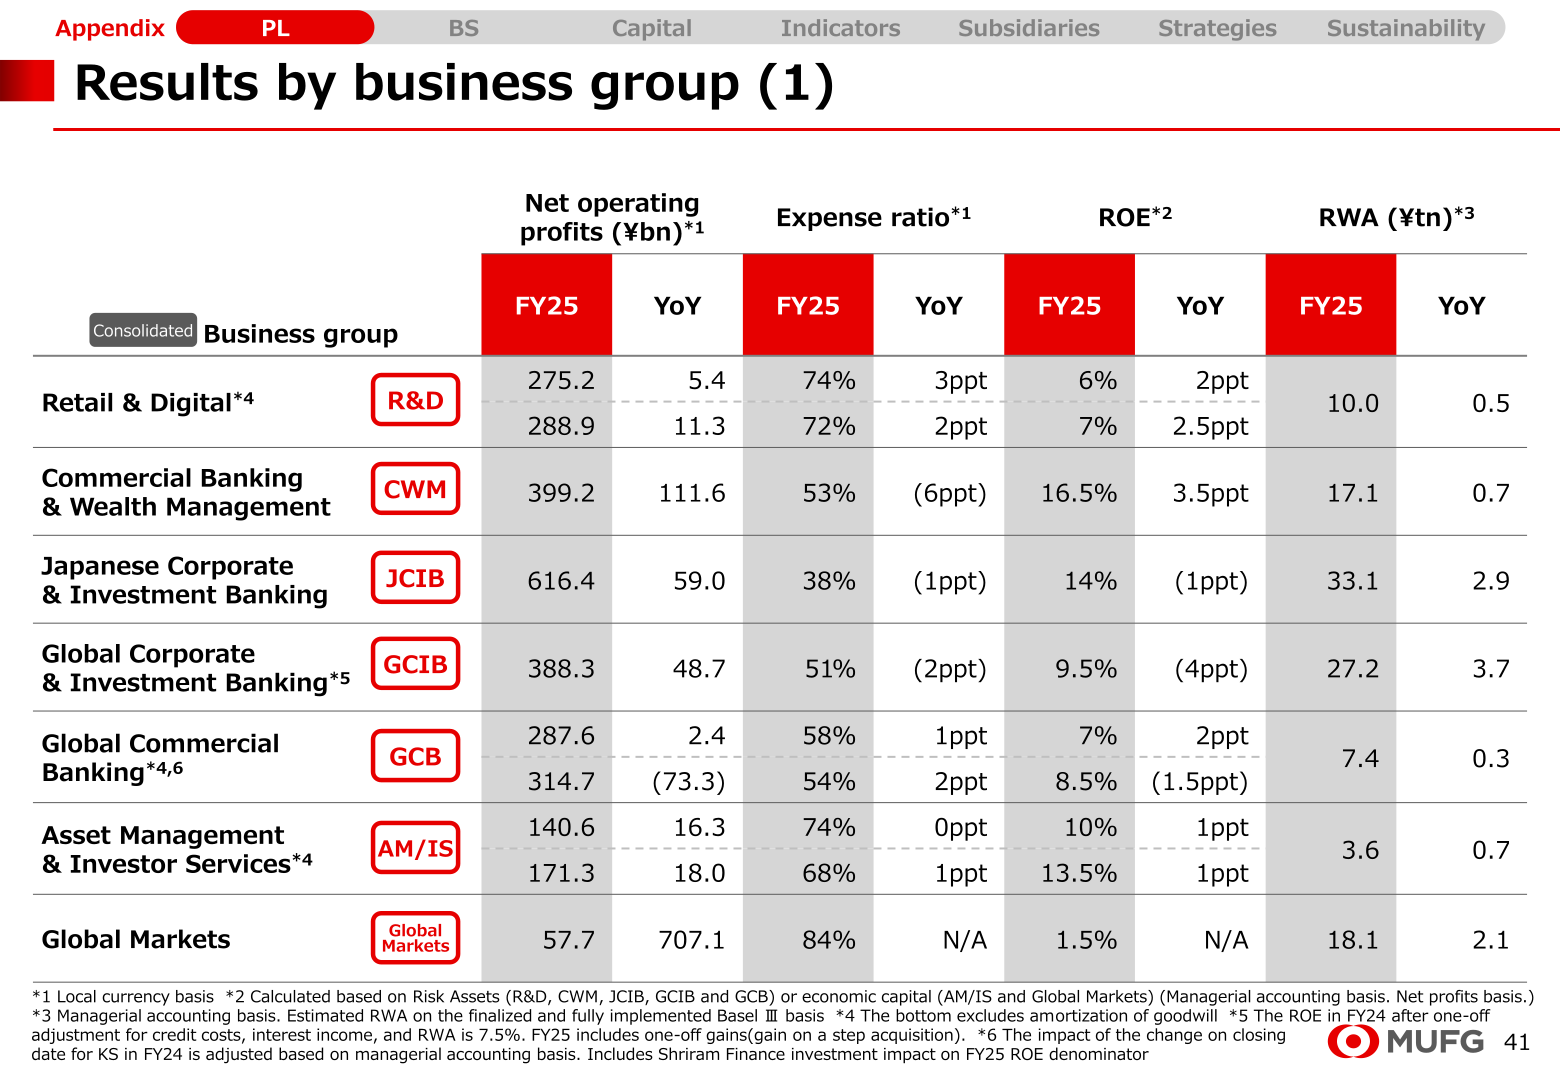
MUFG targets net operating profits of ¥2,900.0bn (+¥522.8bn), ordinary profits of ¥3,950.0bn (+¥539.9bn) and net profits of ¥2,700.0bn (+¥272.8bn, +11% vs FY25) for FY2026, with an ROE target of approximately 12% (approximately 10.4% in FY25 excluding the impact of equity holdings). Total credit costs are targeted at ¥(350.0)bn, roughly flat versus FY25. Key financial assumptions underlying the target include a BOJ policy rate of approximately 1%, an FF rate in the mid-3% range, a Nikkei Stock Average in the mid-¥50,000 range, and USD/JPY in the low-150 range. Factors expected to support net profit growth include interest income on loans and fee income (+¥140.0bn), the impact of JPY interest rate hikes (+¥170.0bn), and the rebound from the review of JPY interest rate hedging operations (+¥140.0bn), partly offset by an inflation impact of ¥(80.0)bn.
| Item | FY2025 (Actual) | FY2026 Target | YoY |
|---|---|---|---|
| Net operating profits (¥bn) | 2,377.2 | 2,900.0 | +522.8 |
| Total credit costs (¥bn) | (355.8) | (350.0) | +5.8 |
| Ordinary profits (¥bn) | 3,410.1 | 3,950.0 | +539.9 |
| Net profits (¥bn) | 2,427.2 | 2,700.0 | +272.8 |
| ROE (JPX basis) | 11.3% | Approx. 12% | – |
Shareholder Returns and Capital Position
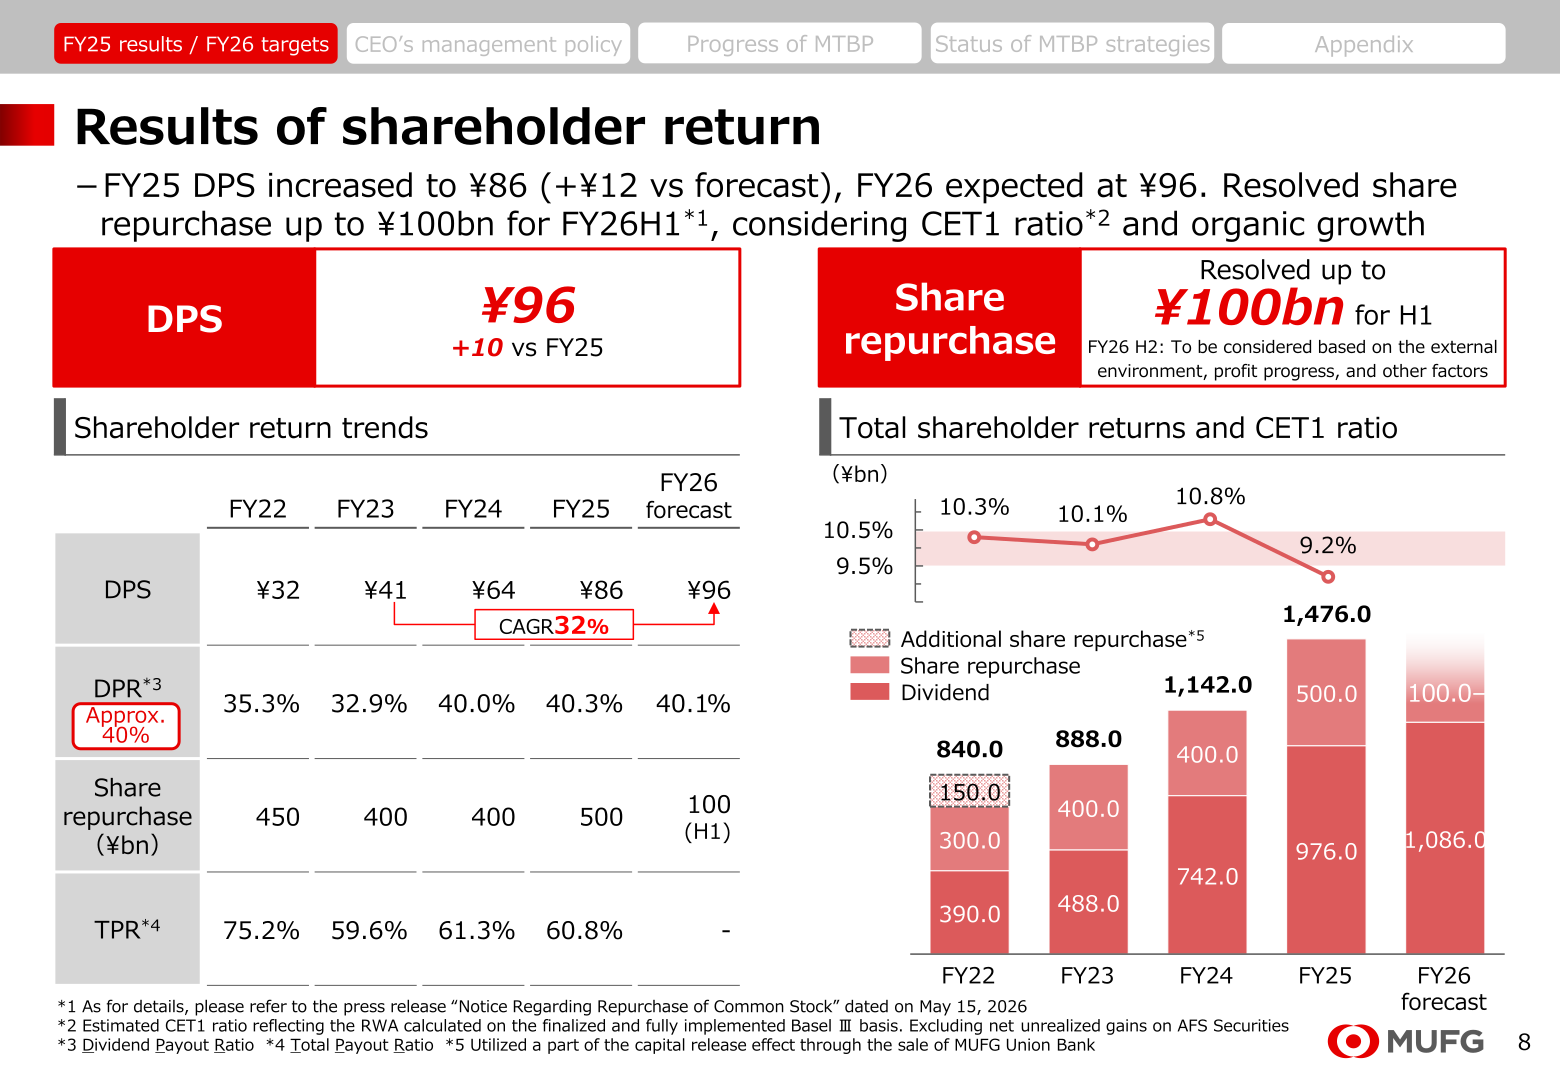
FY2025 DPS was increased to ¥86 (+¥12 versus the original forecast), with a dividend payout ratio of 40.3%. Share repurchases of ¥500.0bn were conducted in FY2025, for a total payout ratio of 60.8%. For FY2026, DPS is expected to reach ¥96 (+¥10 versus FY25), and MUFG has resolved a share repurchase of up to ¥100.0bn for FY2026 H1, with H2 repurchases to be considered based on the external environment, profit progress and other factors; the basic policy is to maintain a dividend payout ratio of around 40%. MUFG’s estimated CET1 ratio (finalized and fully implemented Basel III basis, excluding net unrealized gains on AFS securities) was 9.2% at End Mar 2026, down from 10.8% at End Mar 2025 and below the company’s target range of 9.5%-10.5%; this includes a (0.65%) impact from the investment in Shriram Finance. Including net unrealized gains on AFS securities, the CET1 ratio was 10.9% at End Mar 2026 versus 12.3% at End Mar 2025. The leverage ratio was 4.94% at End Mar 2026 (5.29% at End Mar 2025), and MUFG’s Total Capital Ratio and External TLAC Ratio stood at 16.85% and 23.25% respectively as of End Mar 2026, both above minimum regulatory requirements.
| Item | FY2025 | FY2024 | FY2026 Forecast/Target |
|---|---|---|---|
| DPS (¥) | 86 | 64 | 96 |
| Dividend payout ratio | 40.3% | 40.0% | 40.1% |
| Share repurchase (¥bn) | 500 | 400 | 100 (H1, resolved) |
| Total payout ratio | 60.8% | 61.3% | – |
| CET1 ratio, excl. net unrealized AFS gains (End Mar) | 9.2% | 10.8% | Target range 9.5%-10.5% |
| CET1 ratio, incl. net unrealized AFS gains (End Mar) | 10.9% | 12.3% | – |
Medium-Term Business Plan (MTBP) Progress
MUFG raised its mid-to-long-term ROE target to approximately 12%, up from the initial MTBP target, and continues to manage against three drivers: profits, expenses and CET1 ratio. Net operating profits (managerial accounting basis) grew to ¥2,365.4bn in FY25 versus an MTBP target of ¥2,700.0bn, and the expense ratio was 58.0% in FY25 (excluding the loss associated with the review of JPY interest rate hedging operations) against an MTBP target of approximately 60%. During FY24-25, MUFG reduced low-profitable RWA by ¥(9)tn and increased high-profitable RWA by ¥16tn. Growth strategies across the group contributed a combined ¥440.7bn increase in net operating profits versus FY23, led by domestic retail, corporate x wealth management business, and the GCIB-GM integrated business model. Reduction of domestic equity holdings continued, with a cumulative ¥441bn sold in the MTBP against a ¥700bn target, bringing the domestic equity holdings ratio to consolidated net assets down to 18.0% at End Mar 2026.
This article is an analysis based on publicly available information and is not a recommendation to buy or sell any specific securities. Investment decisions are your own responsibility.
![[Obayashi] Investors’ Guide 2026 — The Complete 24-Article Breakdown](https://japan-equity.com/wp-content/uploads/2026/07/hub_cover-1024x1024.png)
![[Obayashi] IR & SR Policy — Feeding Dialogue Back into Management](https://japan-equity.com/wp-content/uploads/2026/07/p32_sq-1024x1024.jpg)
![[Obayashi] Real Estate Development — 18.7% Margin, ¥287.7bn Unrealized Gains](https://japan-equity.com/wp-content/uploads/2026/07/p20_sq-1024x1024.jpg)
![[Obayashi] Domestic Civil Engineering — Resilience Spending Supports 9.6% Margin](https://japan-equity.com/wp-content/uploads/2026/07/p11_sq-1024x1024.jpg)
![[Obayashi] Share Price & External Ratings — vs TOPIX, ESG Index Inclusion](https://japan-equity.com/wp-content/uploads/2026/07/p40_sq-1024x1024.jpg)
![[Construction] ¥75.5tn Investment, Shrinking Workforce — Big-5 Market Share](https://japan-equity.com/wp-content/uploads/2026/07/p12_sq-1024x1024.jpg)



![[Obayashi] Capital Policy & Shareholder Returns — ROE 10%+, DOE ~5%, ¥100bn Buyback](https://japan-equity.com/wp-content/uploads/2026/07/p27_sq-1024x1024.jpg)
![[Obayashi] Reducing Cross-Shareholdings — ¥285.2bn Sold in Five Years](https://japan-equity.com/wp-content/uploads/2026/07/p29_sq-1024x1024.jpg)
![[Obayashi] ¥750bn Investment Plan — ¥300bn to Development, ¥190bn to Tech/DX](https://japan-equity.com/wp-content/uploads/2026/07/p30_sq-1024x1024.jpg)
![[Obayashi] MTP2022 KPIs — Operating Profit ~2x Target, ROE 14.4%](https://japan-equity.com/wp-content/uploads/2026/07/p25_sq-1024x1024.jpg)
![[Obayashi] Cash Allocation — ¥420bn Investment CF Over Five Years](https://japan-equity.com/wp-content/uploads/2026/07/p26_sq-1024x1024.jpg)
![[Obayashi] Green Energy — 44 Plants, 344MW, and the Green Hydrogen Challenge](https://japan-equity.com/wp-content/uploads/2026/07/p21_sq-1024x1024.jpg)
![[Obayashi] Tackling the Labor Shortage — Robotics Construction®](https://japan-equity.com/wp-content/uploads/2026/07/p14_sq-1024x1024.jpg)
