
This article is based on publicly available IR materials and is not a recommendation to buy or sell any specific securities.
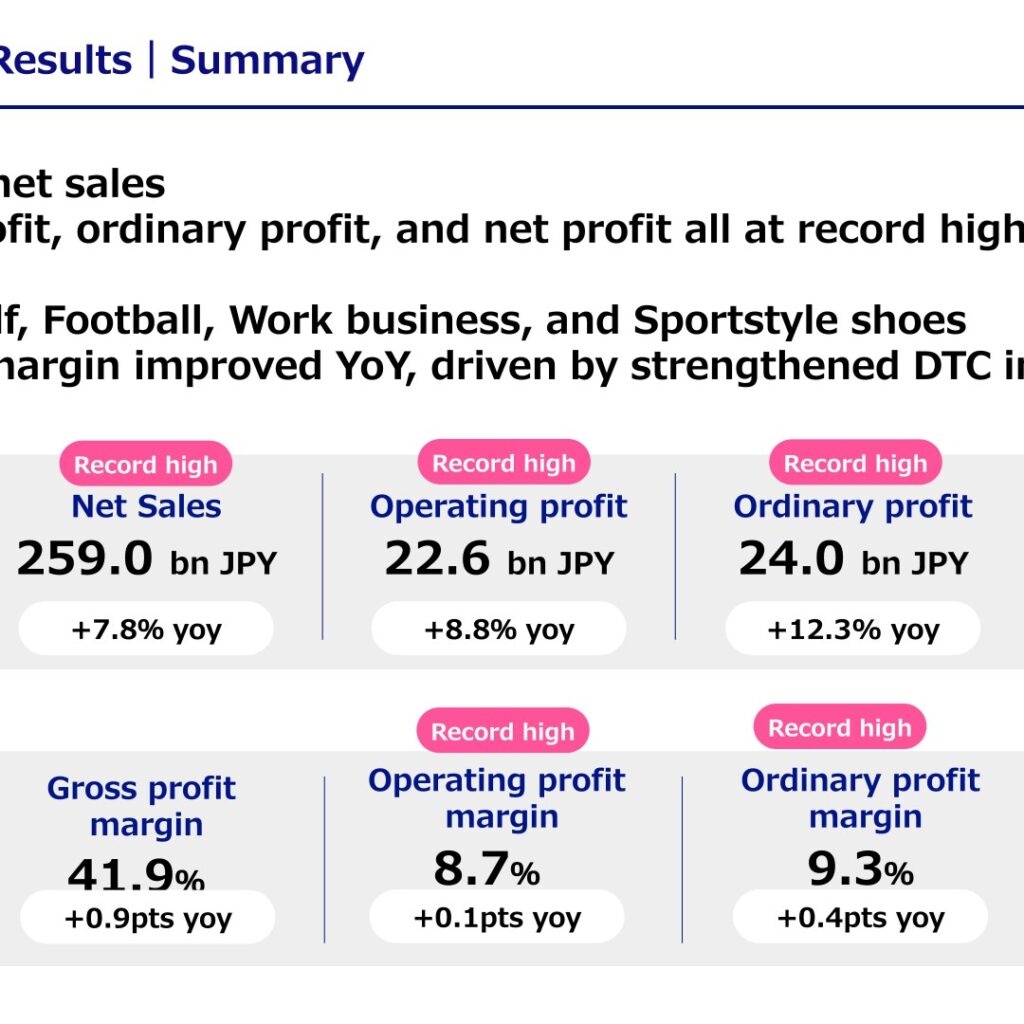
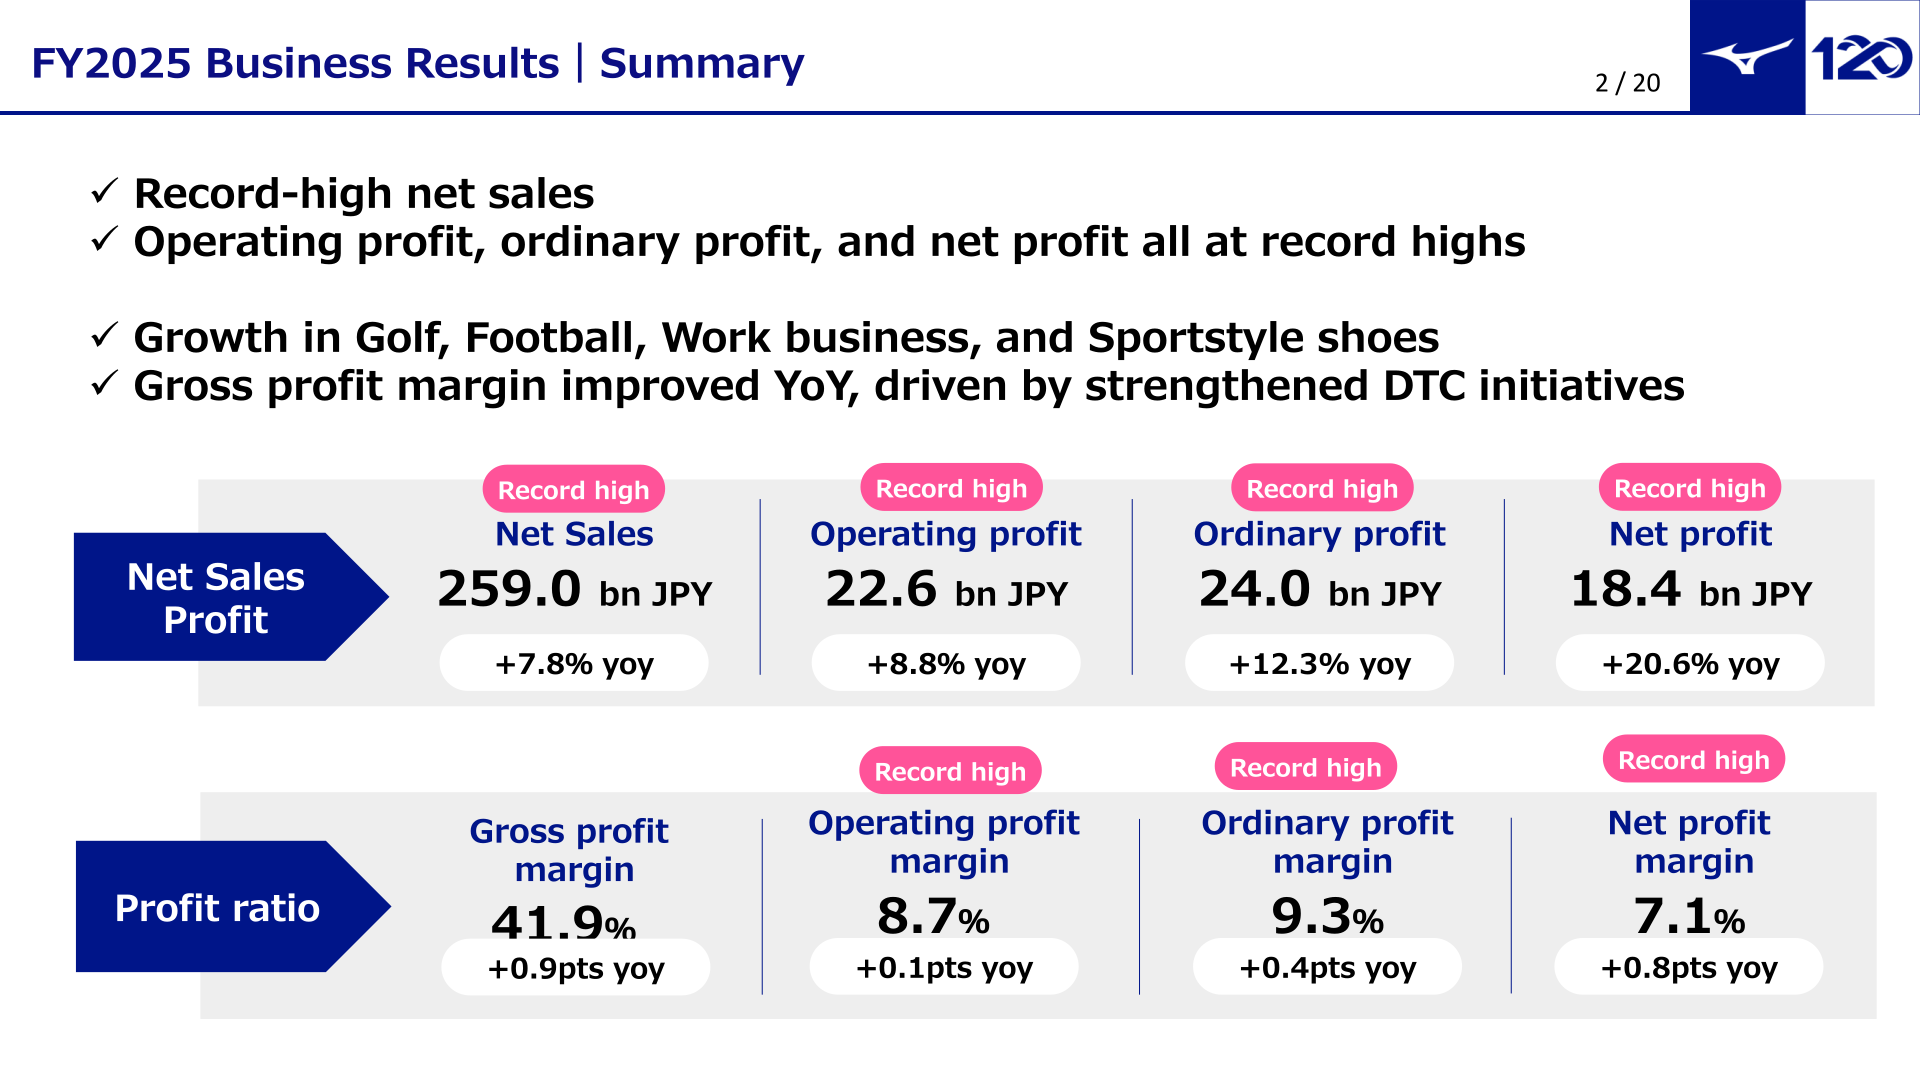
Mizuno Corporation reported record-high results for the fiscal year ended March 31, 2026 (FY25, the company’s 113th period), with net sales of 259.0 billion yen (+7.8% yoy), operating profit of 22.6 billion yen (+8.8% yoy), ordinary profit of 24.0 billion yen (+12.3% yoy), and net profit of 18.4 billion yen (+20.6% yoy). Net sales, operating profit, ordinary profit, and net profit all reached record highs, driven by growth in Golf, Football, Work business, and Sportstyle shoes, while the gross profit margin improved year on year on strengthened DTC (direct-to-consumer) initiatives.
Consolidated Results (Full-Year Actual)
Gross margin rose to 108.5 billion yen (+10.1%), lifting the gross margin ratio to 41.9% (+0.9pt). SG&A expenses increased to 85.9 billion yen (+10.4%, SG&A expenses ratio 33.1%, +0.7pt), reflecting higher salaries & bonus (33.5 billion yen, +7.6%) and A&P expenses (16.0 billion yen, +12.0%). Actual sales of 259.0 billion yen came in at 99.6% of the company’s forecast of 260.0 billion yen, while operating profit of 22.6 billion yen was 100.5% of the 22.5 billion yen forecast, ordinary profit of 24.0 billion yen was 104.3% of the 23.0 billion yen forecast, and net income of 18.4 billion yen was 111.4% of the 16.5 billion yen forecast.
| Item | FY2024 | FY2025 | Change | Change (%) |
|---|---|---|---|---|
| Sales | 240.3 | 259.0 | 18.7 | 7.8% |
| Gross margin | 98.6 | 108.5 | 9.9 | 10.1% |
| Gross margin ratio | 41.0% | 41.9% | +0.9pt | – |
| SG&A expenses | 77.8 | 85.9 | 8.1 | 10.4% |
| SG&A expenses ratio | 32.4% | 33.1% | +0.7pt | – |
| Operating profit | 20.8 | 22.6 | 1.8 | 8.8% |
| Operating profit ratio | 8.6% | 8.7% | +0.1pt | – |
| Ordinary profit | 21.4 | 24.0 | 2.6 | 12.3% |
| Ordinary profit ratio | 8.9% | 9.3% | +0.4pt | – |
| Net income | 15.2 | 18.4 | 3.2 | 20.6% |
| Net income ratio | 6.3% | 7.1% | +0.8pt | – |
Segment Results
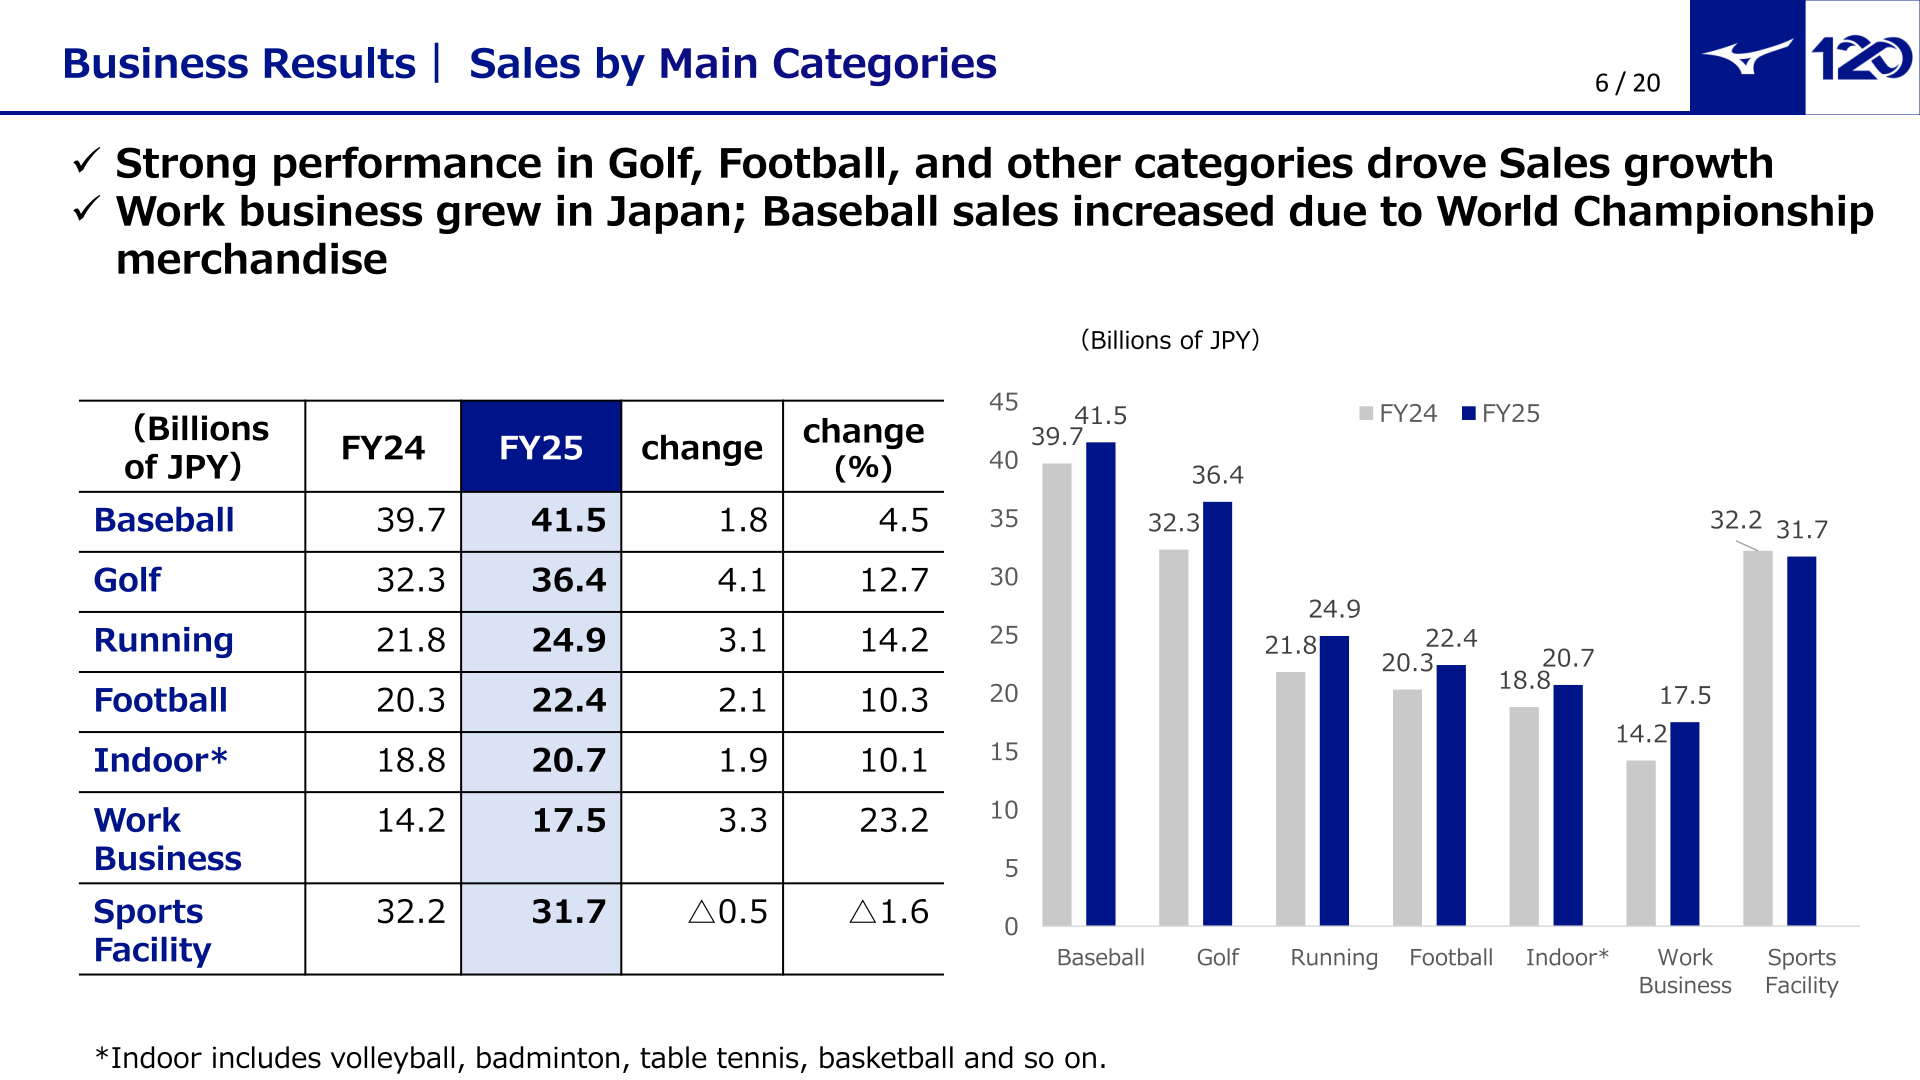
By main product category, Golf (36.4 billion yen, +12.7%), Running (24.9 billion yen, +14.2%), Football (22.4 billion yen, +10.3%), and Work Business (17.5 billion yen, +23.2%) all grew strongly. Baseball sales rose to 41.5 billion yen (+4.5%) on World Championship merchandise demand, while Sports Facility sales declined to 31.7 billion yen (-1.6%).
| Category | FY2024 (Bn JPY) | FY2025 (Bn JPY) | Change | Change (%) |
|---|---|---|---|---|
| Baseball | 39.7 | 41.5 | 1.8 | 4.5 |
| Golf | 32.3 | 36.4 | 4.1 | 12.7 |
| Running | 21.8 | 24.9 | 3.1 | 14.2 |
| Football | 20.3 | 22.4 | 2.1 | 10.3 |
| Indoor | 18.8 | 20.7 | 1.9 | 10.1 |
| Work Business | 14.2 | 17.5 | 3.3 | 23.2 |
| Sports Facility | 32.2 | 31.7 | -0.5 | -1.6 |
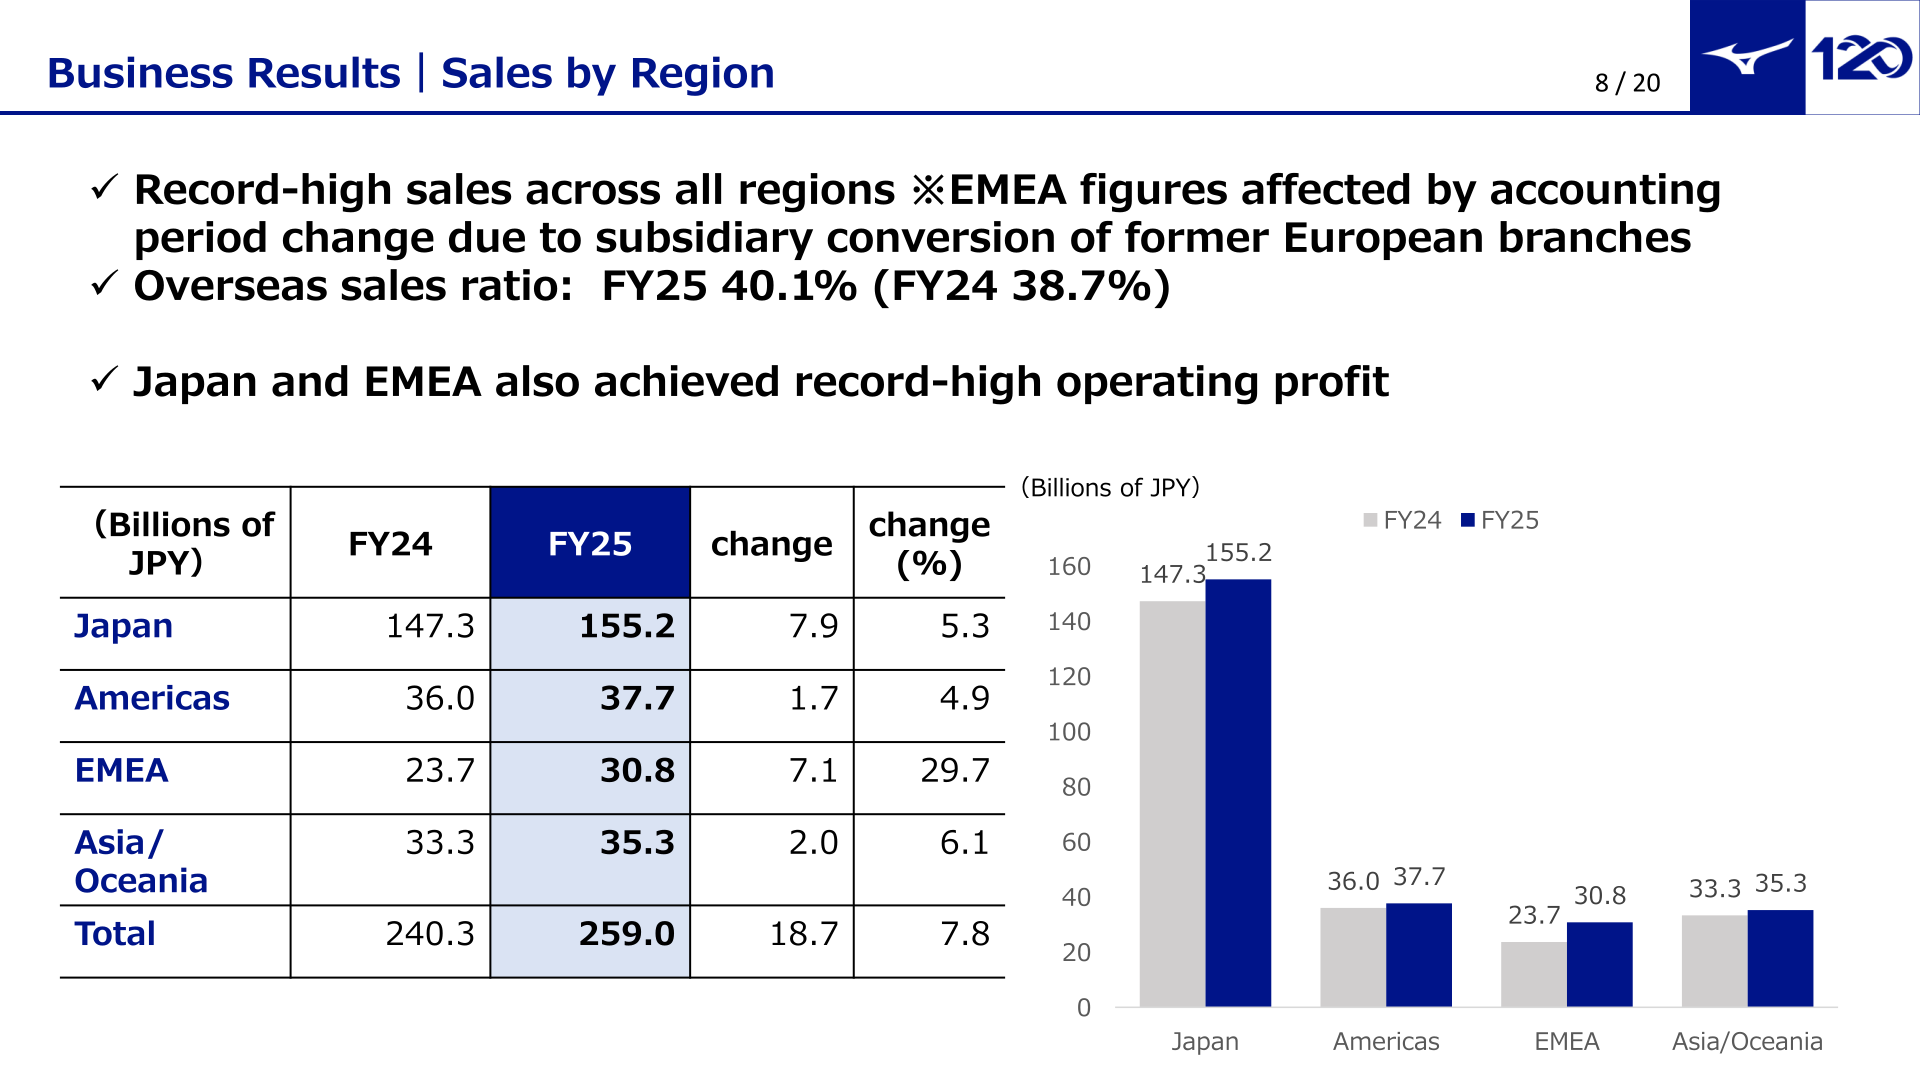
By region, sales reached record highs across all regions: Japan 155.2 billion yen (+5.3%), Americas 37.7 billion yen (+4.9%), EMEA 30.8 billion yen (+29.7%), and Asia/Oceania 35.3 billion yen (+6.1%). The overseas sales ratio rose to 40.1% in FY25 from 38.7% in FY24. Japan and EMEA also achieved record-high operating profit. EMEA figures were affected by an accounting period change due to the subsidiary conversion of former European branches.
| Region | FY2024 (Bn JPY) | FY2025 (Bn JPY) | Change | Change (%) |
|---|---|---|---|---|
| Japan | 147.3 | 155.2 | 7.9 | 5.3 |
| Americas | 36.0 | 37.7 | 1.7 | 4.9 |
| EMEA | 23.7 | 30.8 | 7.1 | 29.7 |
| Asia/Oceania | 33.3 | 35.3 | 2.0 | 6.1 |
| Total | 240.3 | 259.0 | 18.7 | 7.8 |
FY2026 Forecast
For FY26, Mizuno forecasts sales of 280.0 billion yen, operating profit of 25.5 billion yen, and ordinary profit of 26.5 billion yen. By half, the company expects sales of 137.0 billion yen in 1-2Q and 143.0 billion yen in 3-4Q. Versus FY25 actual results, the forecast represents a +21 billion yen increase in sales, +2.9 billion yen in operating profit, +2.5 billion yen in ordinary profit, and +0.6 billion yen in net profit, with the net profit ratio forecast to decline 0.3pt to 6.8%.
| Item | FY2025 (Actual) | FY2026 Forecast (Full Year) | Change vs FY2025 |
|---|---|---|---|
| Sales | 259.0 | 280.0 | +21 |
| Operating profit | 22.6 | 25.5 | +2.9 |
| Operating profit ratio | 8.7% | 9.1% | +0.4pt |
| Ordinary profit | 24.0 | 26.5 | +2.5 |
| Ordinary profit ratio | 9.3% | 9.5% | +0.2pt |
| Net profit | 18.4 | 19.0 | +0.6 |
| Net profit ratio | 7.1% | 6.8% | -0.3pt |
Medium-Term Plan
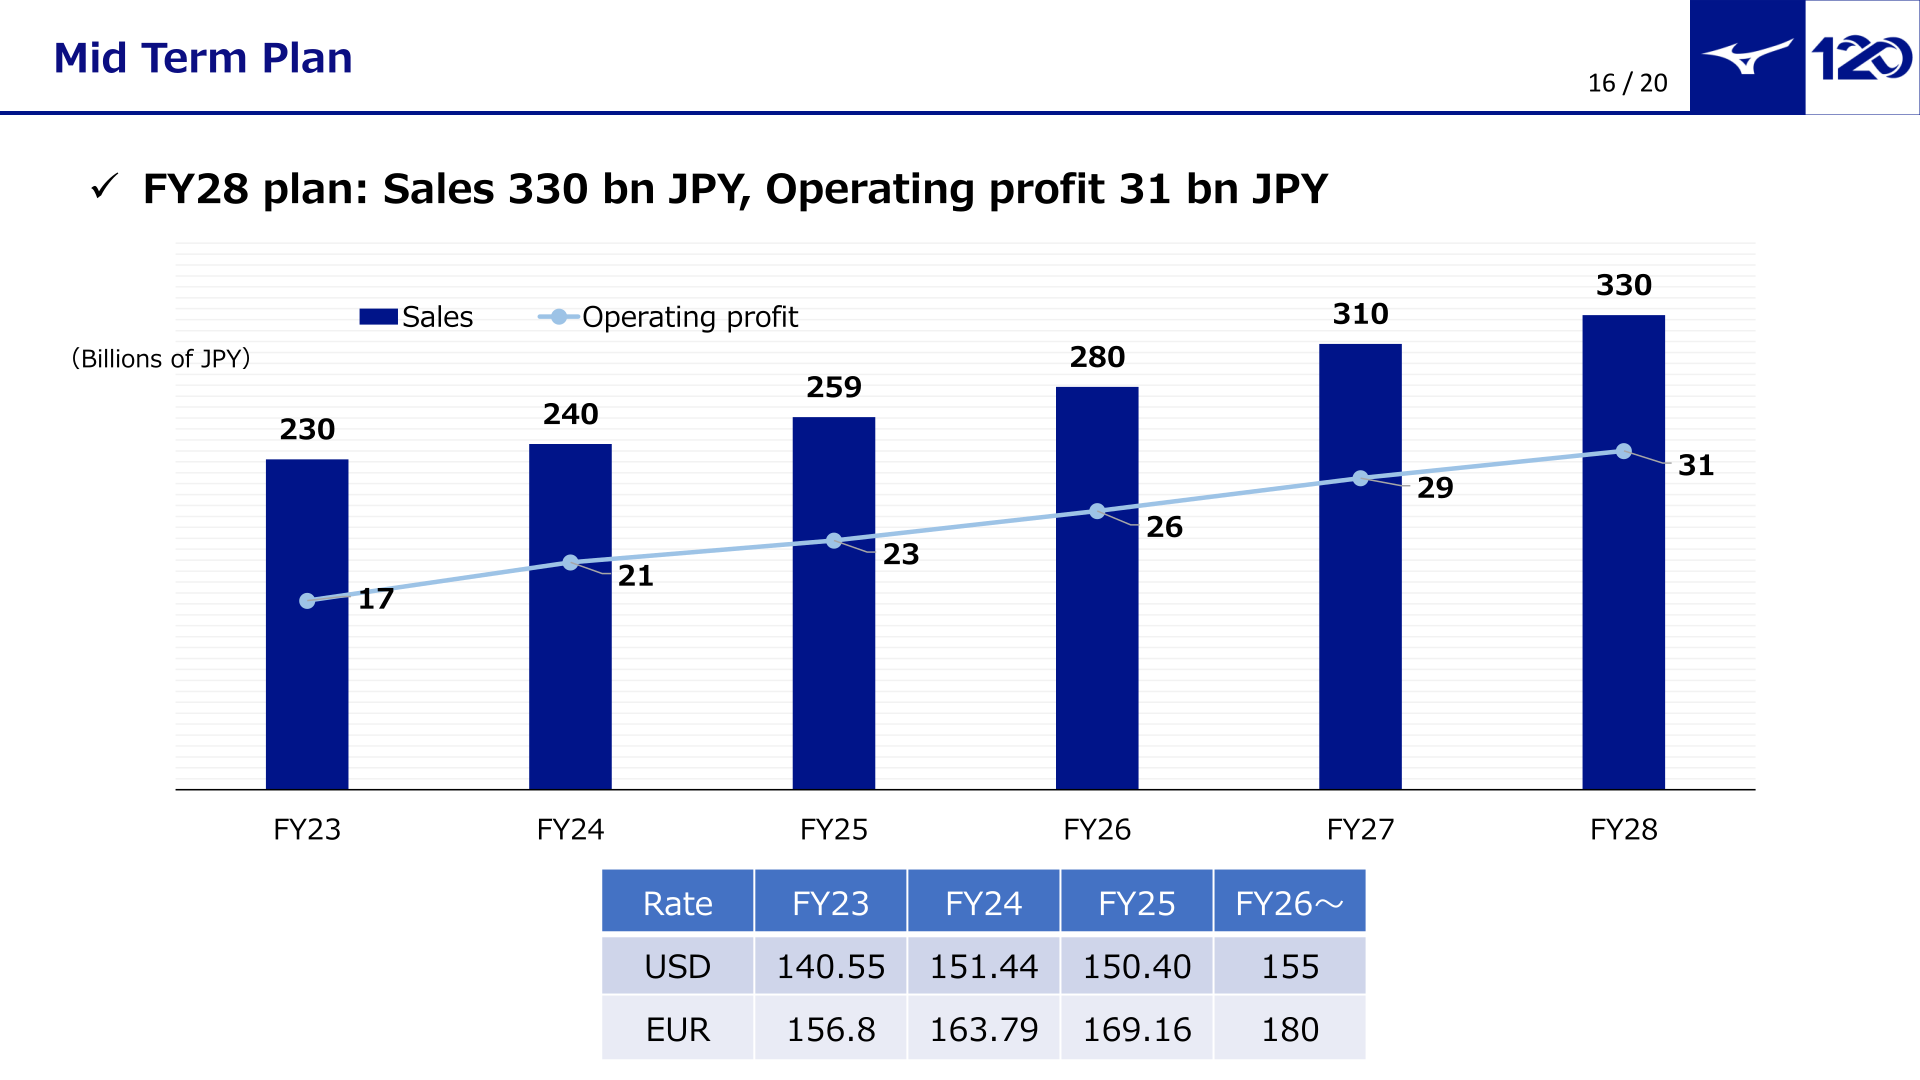
Under its mid-term plan, Mizuno targets sales of 330 billion yen and operating profit of 31 billion yen by FY28, building on a trajectory of 230 billion yen / 17 billion yen in FY23, 240 billion yen / 21 billion yen in FY24, 259 billion yen / 23 billion yen in FY25 (actual), and plans of 280 billion yen / 26 billion yen in FY26 and 310 billion yen / 29 billion yen in FY27. Assumed FX rates from FY26 onward are 155 yen/USD and 180 yen/EUR. The company also targets both ROA and ROE at 11.5% by FY28, versus FY25 actuals of ROA 9.9% and ROE 11.1%, through (1) growth in focus categories and DTC expansion, (2) pricing optimization and cost reduction, and (3) asset efficiency improvement through inventory optimization, among other measures.
Shareholder Returns
This cannot be confirmed from the materials.
This article is an analysis based on publicly available information and is not a recommendation to buy or sell any specific securities. Investment decisions are your own responsibility.
















