
This article is based on publicly available IR materials and is not a recommendation to buy or sell any specific securities.
ZACROS Corporation reported consolidated results for fiscal year 2025 (the year ended March 31, 2026) in which both revenue and profit increased year over year. Net sales rose 5.2% to ¥158,535 million, operating income increased 9.3% to ¥11,054 million, ordinary income grew 18.7% to ¥12,303 million, and net income attributable to owners of parent increased 18.0% to ¥7,707 million. For fiscal year 2026, the company forecasts net sales to increase 11.0% to ¥176,000 million and operating income to rise 1.3% to ¥11,200 million, while ordinary income and net income attributable to owners of parent are expected to decline 6.5% and 15.7%, respectively.
Consolidated Results (Full-Year Actual)
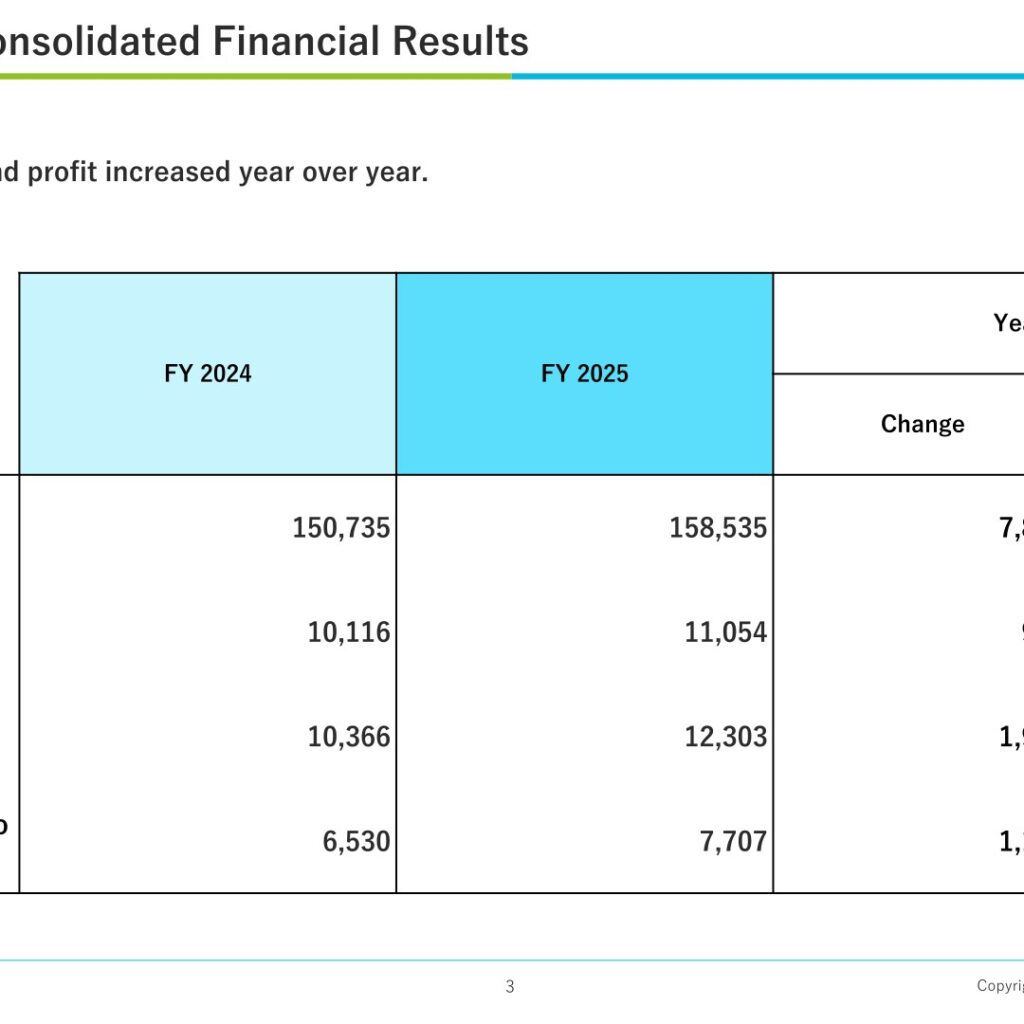
Fiscal year 2025 revenue and profit increased year over year.
| Item | FY2024 | FY2025 | Change | Growth Rate |
|---|---|---|---|---|
| Net sales (millions of yen) | 150,735 | 158,535 | 7,800 | 5.2% |
| Operating income (millions of yen) | 10,116 | 11,054 | 937 | 9.3% |
| Ordinary income (millions of yen) | 10,366 | 12,303 | 1,937 | 18.7% |
| Net income attributable to owners of parent (millions of yen) | 6,530 | 7,707 | 1,176 | 18.0% |
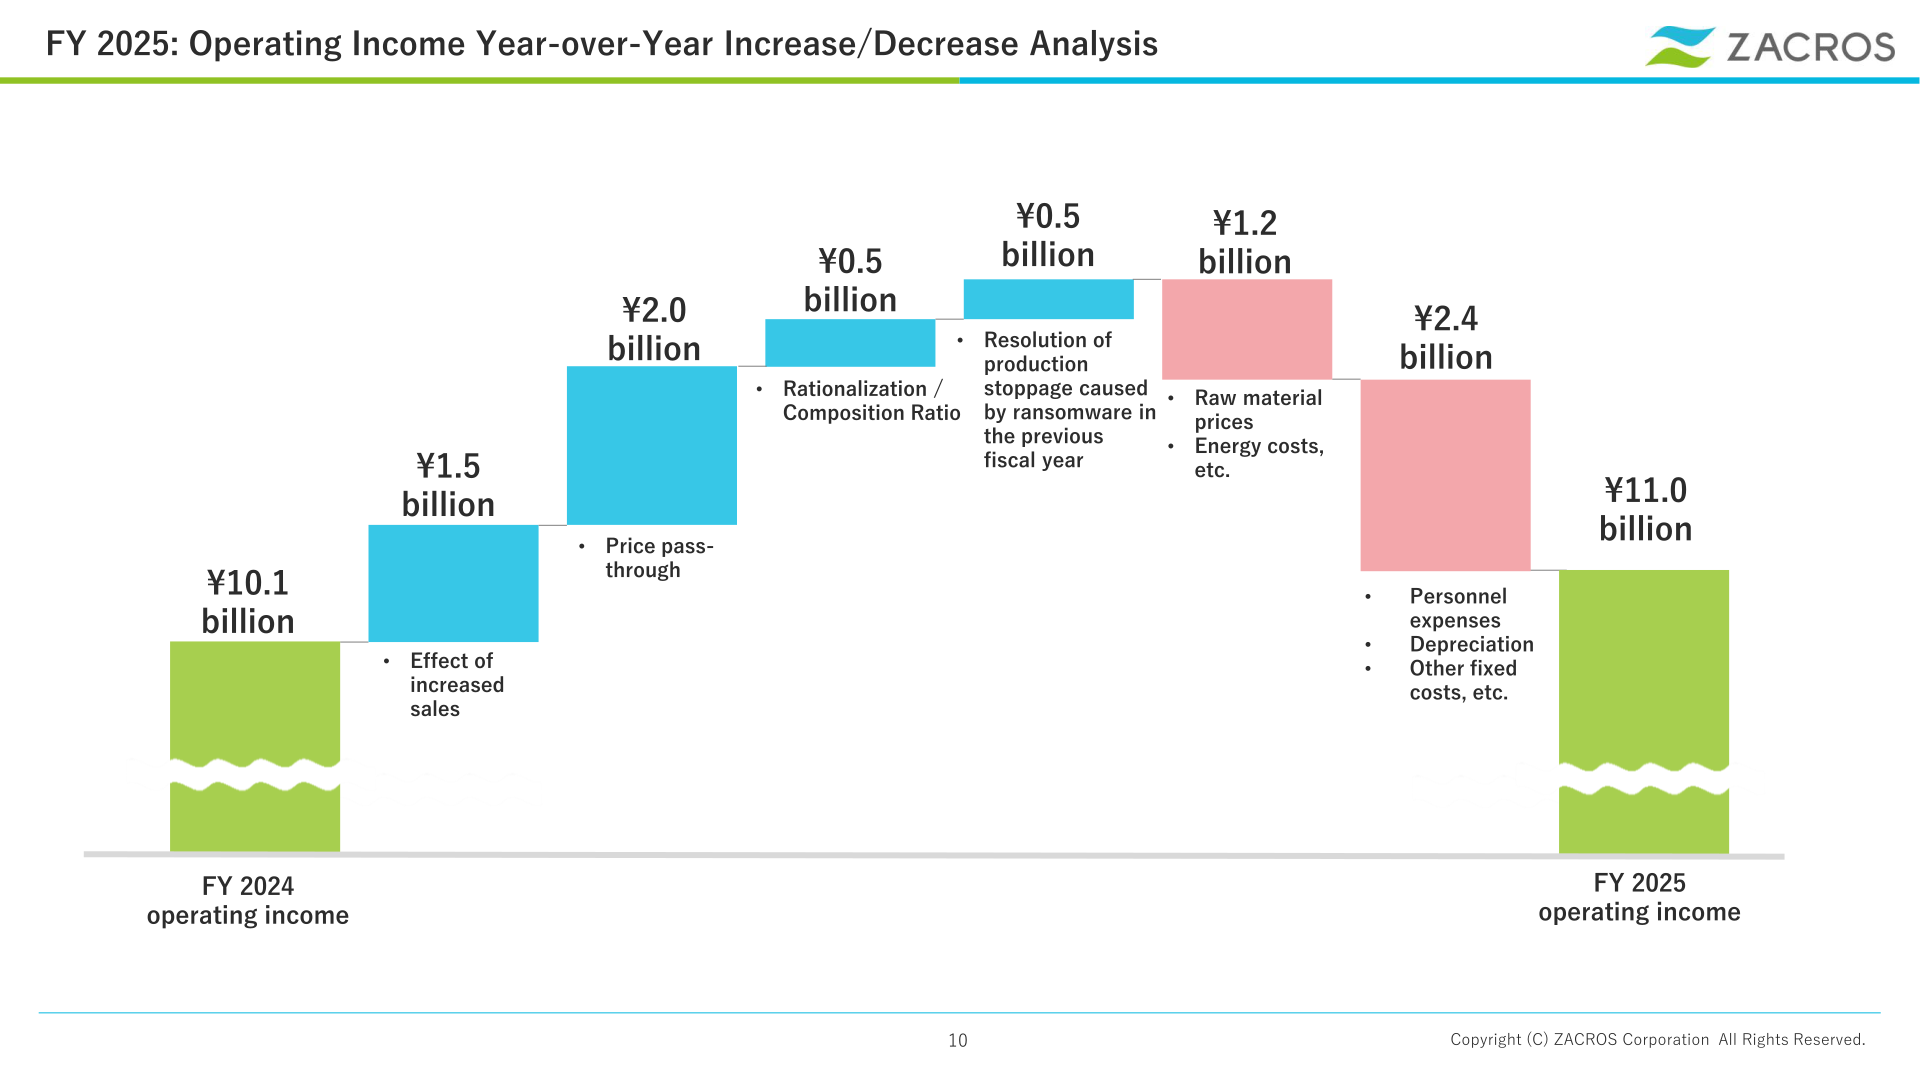
According to the company’s year-over-year operating income analysis, operating income increased from ¥10.1 billion in FY2024 to ¥11.0 billion in FY2025. Positive factors included the effect of increased sales (+¥1.5 billion), price pass-through (+¥2.0 billion), rationalization/composition ratio (+¥0.5 billion), and the resolution of a production stoppage caused by ransomware in the previous fiscal year (+¥0.5 billion). These gains were partly offset by higher raw material prices and energy costs (-¥1.2 billion) and increased personnel expenses, depreciation, and other fixed costs (-¥2.4 billion).
Segment Results
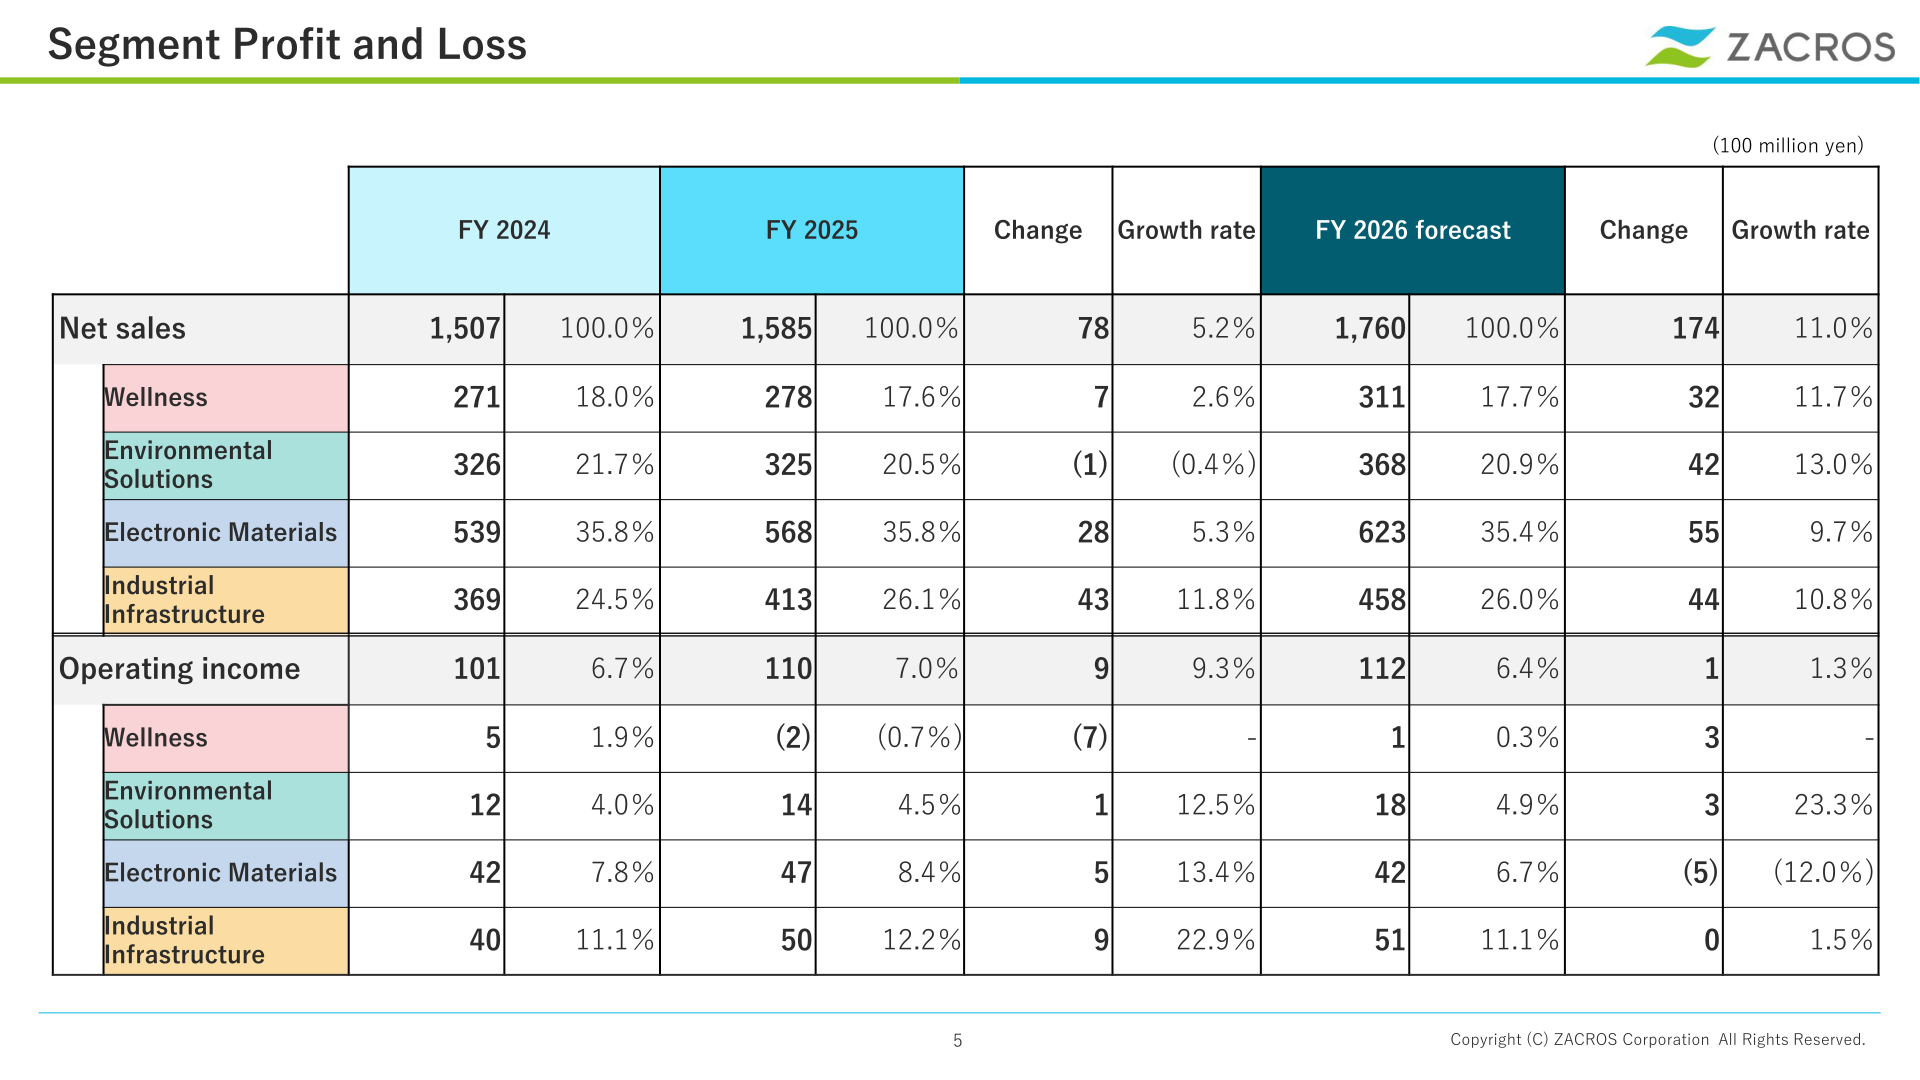
By segment, net sales increased in Wellness, Electronic Materials, and Industrial Infrastructure, while Environmental Solutions net sales declined slightly year over year. Operating income increased in Environmental Solutions, Electronic Materials, and Industrial Infrastructure, while Wellness recorded an operating loss, primarily due to higher depreciation expenses for the new building at the Mie Plant and upfront costs associated with expanding sales of single-use bags for bioprocess applications.
| Segment / Item (100 million yen) | FY2024 | FY2025 | Change | Growth Rate |
|---|---|---|---|---|
| Net sales (Total) | 1,507 (100.0%) | 1,585 (100.0%) | 78 | 5.2% |
| Wellness | 271 (18.0%) | 278 (17.6%) | 7 | 2.6% |
| Environmental Solutions | 326 (21.7%) | 325 (20.5%) | (1) | (0.4%) |
| Electronic Materials | 539 (35.8%) | 568 (35.8%) | 28 | 5.3% |
| Industrial Infrastructure | 369 (24.5%) | 413 (26.1%) | 43 | 11.8% |
| Operating income (Total) | 101 (6.7%) | 110 (7.0%) | 9 | 9.3% |
| Wellness | 5 (1.9%) | (2) (0.7%) | (7) | – |
| Environmental Solutions | 12 (4.0%) | 14 (4.5%) | 1 | 12.5% |
| Electronic Materials | 42 (7.8%) | 47 (8.4%) | 5 | 13.4% |
| Industrial Infrastructure | 40 (11.1%) | 50 (12.2%) | 9 | 22.9% |
FY2026 Forecast
| Item | FY2025 (Actual) | FY2026 (Forecast) | Change | Growth Rate |
|---|---|---|---|---|
| Net sales (millions of yen) | 158,535 | 176,000 | 17,464 | 11.0% |
| Operating income (millions of yen) | 11,054 | 11,200 | 145 | 1.3% |
| Ordinary income (millions of yen) | 12,303 | 11,500 | (803) | (6.5%) |
| Net income attributable to owners of parent (millions of yen) | 7,707 | 6,500 | (1,207) | (15.7%) |
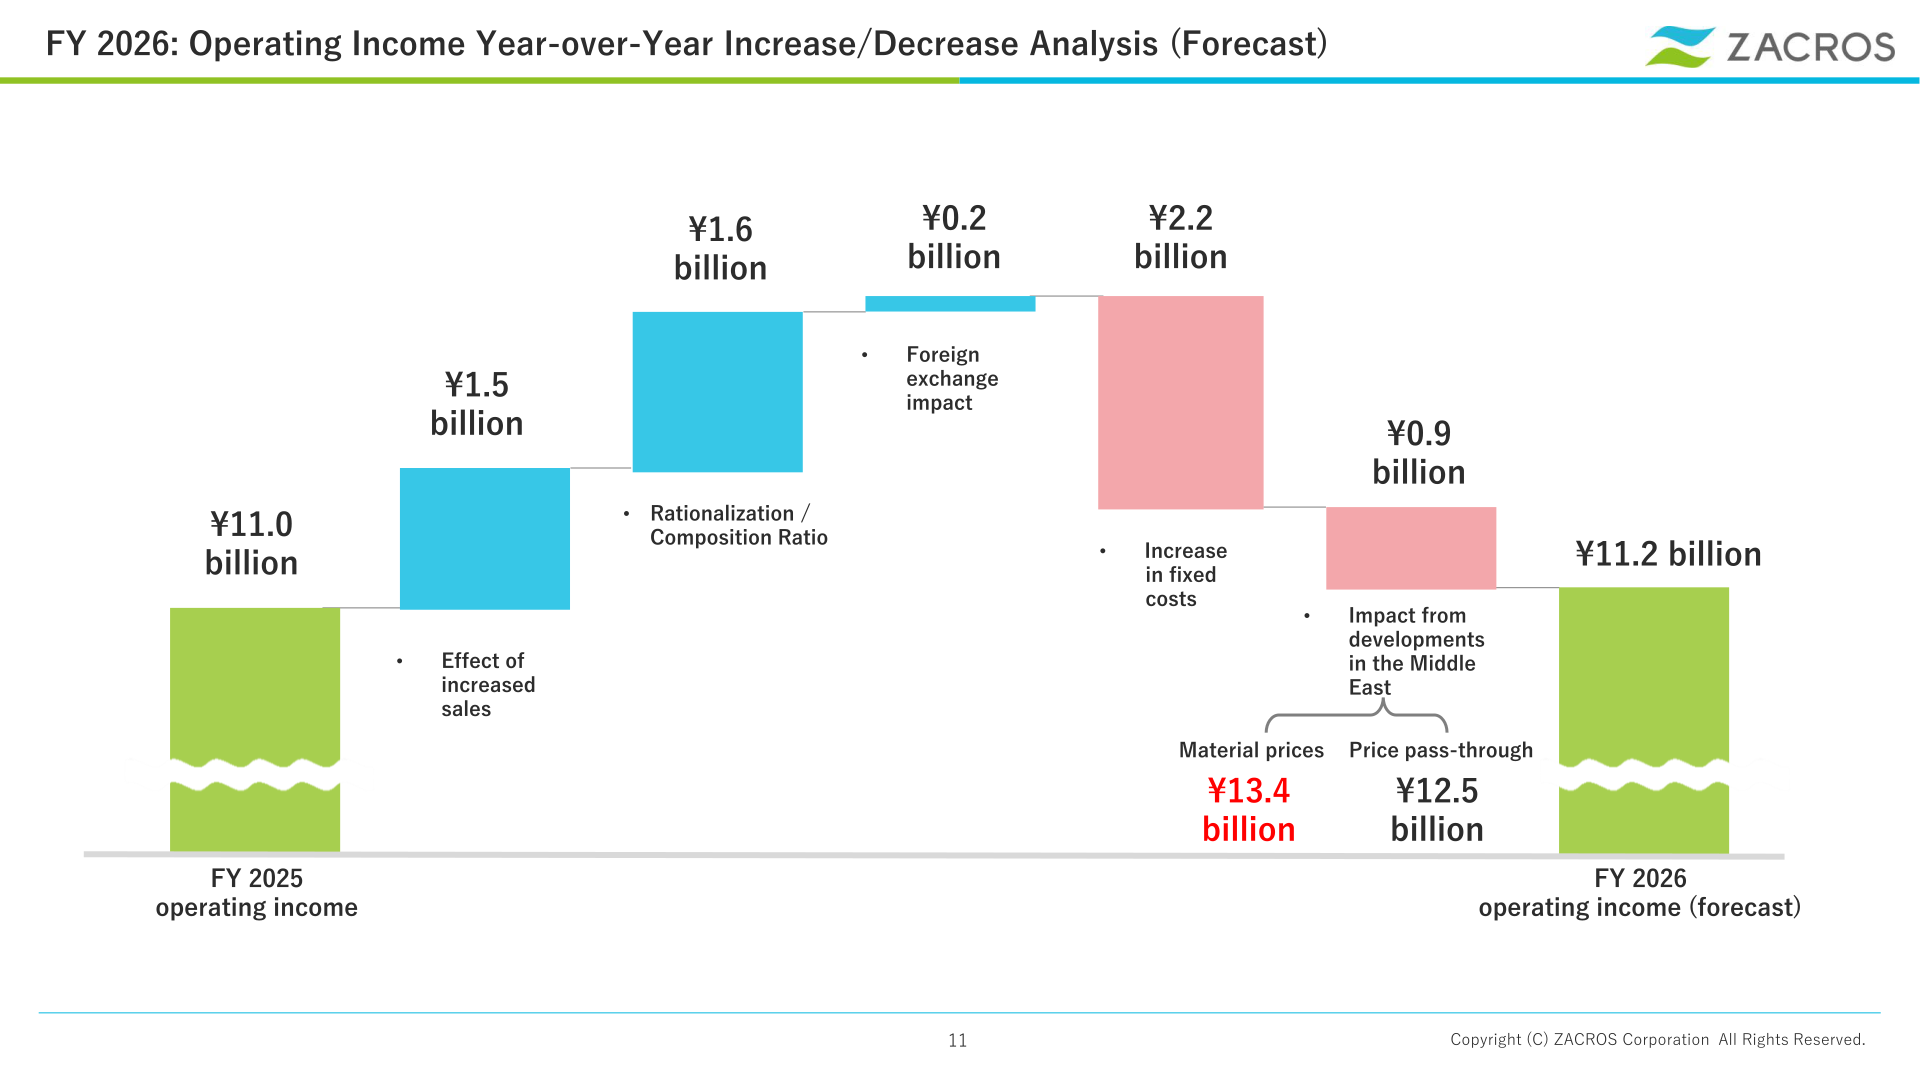
For FY2026, the company forecasts operating income to increase to ¥11.2 billion from ¥11.0 billion in FY2025. Positive contributors include the effect of increased sales (+¥1.5 billion), rationalization/composition ratio (+¥1.6 billion), and a foreign exchange impact (+¥0.2 billion). These are expected to be more than offset by an increase in fixed costs (-¥2.2 billion) and a net impact of ¥0.9 billion related to developments in the Middle East, reflecting an estimated ¥13.4 billion increase in material prices only partially offset by ¥12.5 billion of price pass-through.
Shareholder Returns
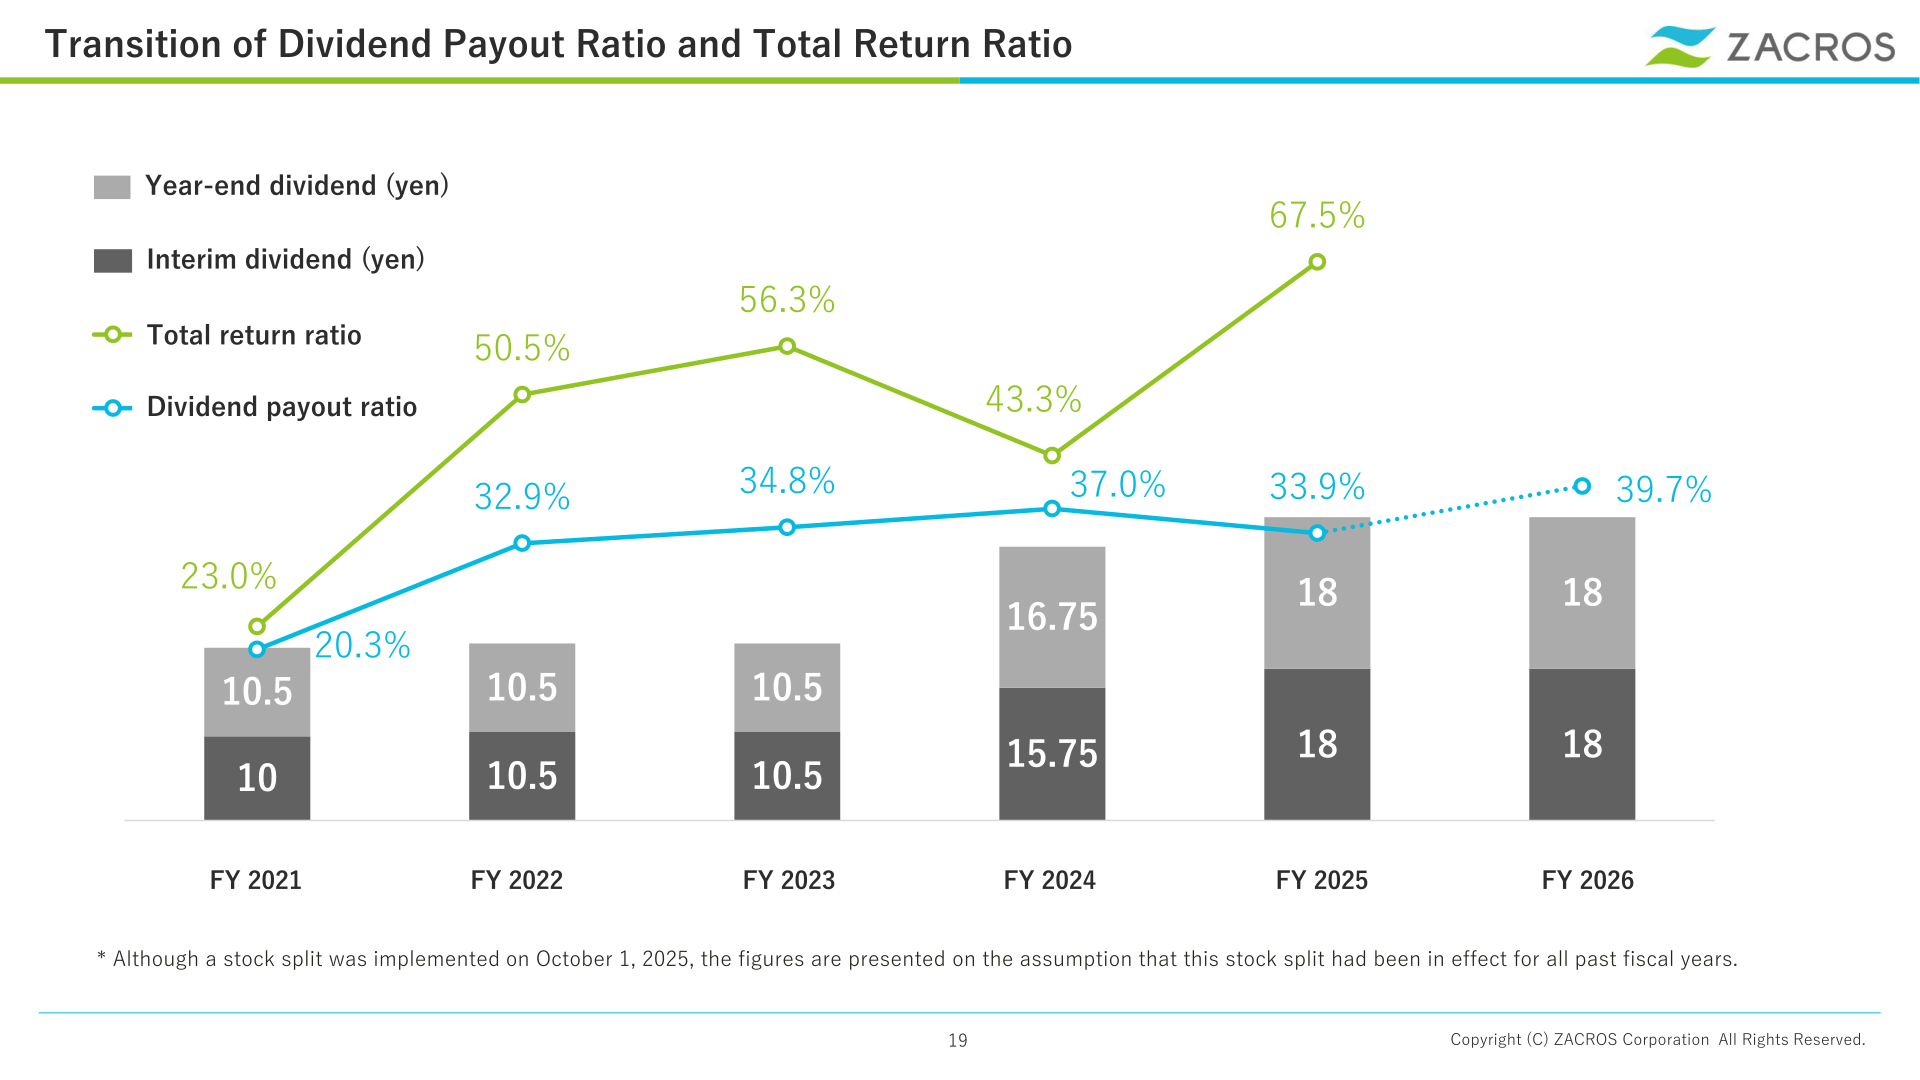
For FY2025, ZACROS paid an interim dividend of ¥18 per share and a year-end dividend of ¥18 per share, for an annual dividend of ¥36 per share, up from ¥32.5 per share in FY2024 (figures reflect the 4-for-1 stock split effective October 1, 2025, applied retroactively to all prior fiscal years). The dividend payout ratio was 33.9% for FY2025, and the total return ratio, which includes treasury share repurchases, was 67.5%, compared with 43.3% in FY2024. The company also repurchased ¥2,584 million of treasury shares during FY2025, up from ¥409 million in FY2024. For FY2026, the company’s dividend chart shows a planned annual dividend of ¥36 per share (¥18 interim, ¥18 year-end), with a dividend payout ratio of 39.7%.
| Item | FY2024 | FY2025 | FY2026 (Forecast) |
|---|---|---|---|
| Interim dividend (yen) | 15.75 | 18 | 18 |
| Year-end dividend (yen) | 16.75 | 18 | 18 |
| Annual dividend (yen) | 32.5 | 36 | 36 |
| Dividend payout ratio | 37.0% | 33.9% | 39.7% |
| Total return ratio | 43.3% | 67.5% | N/A (not disclosed) |
This article is an analysis based on publicly available information and is not a recommendation to buy or sell any specific securities. Investment decisions are your own responsibility.
















