
This article is based on publicly available IR materials and is not a recommendation to buy or sell any specific securities.
Nissha Co., Ltd. (fiscal year ended December 31, 2025) reported a slight decline in net sales and a much sharper drop in profit for FY2025, as upfront costs for new mobility products and an equipment impairment loss weighed on the bottom line. Consolidated net sales were 194,898 million yen (down 0.4% year on year), operating profit fell 26.0% to 4,040 million yen, and profit attributable to owners of parent decreased 74.0% to 1,001 million yen. Even so, all of these figures came in above the company’s previous forecast. For FY2026, Nissha forecasts a further 1.7% decline in net sales to 191,500 million yen but expects operating profit to rebound 63.4% to 6,600 million yen, helped by the elimination of one-off costs recorded in 2025 and the consolidation of newly acquired USM Healthcare (Vietnam) from March 2026.
Consolidated Results (Full-Year Actual)
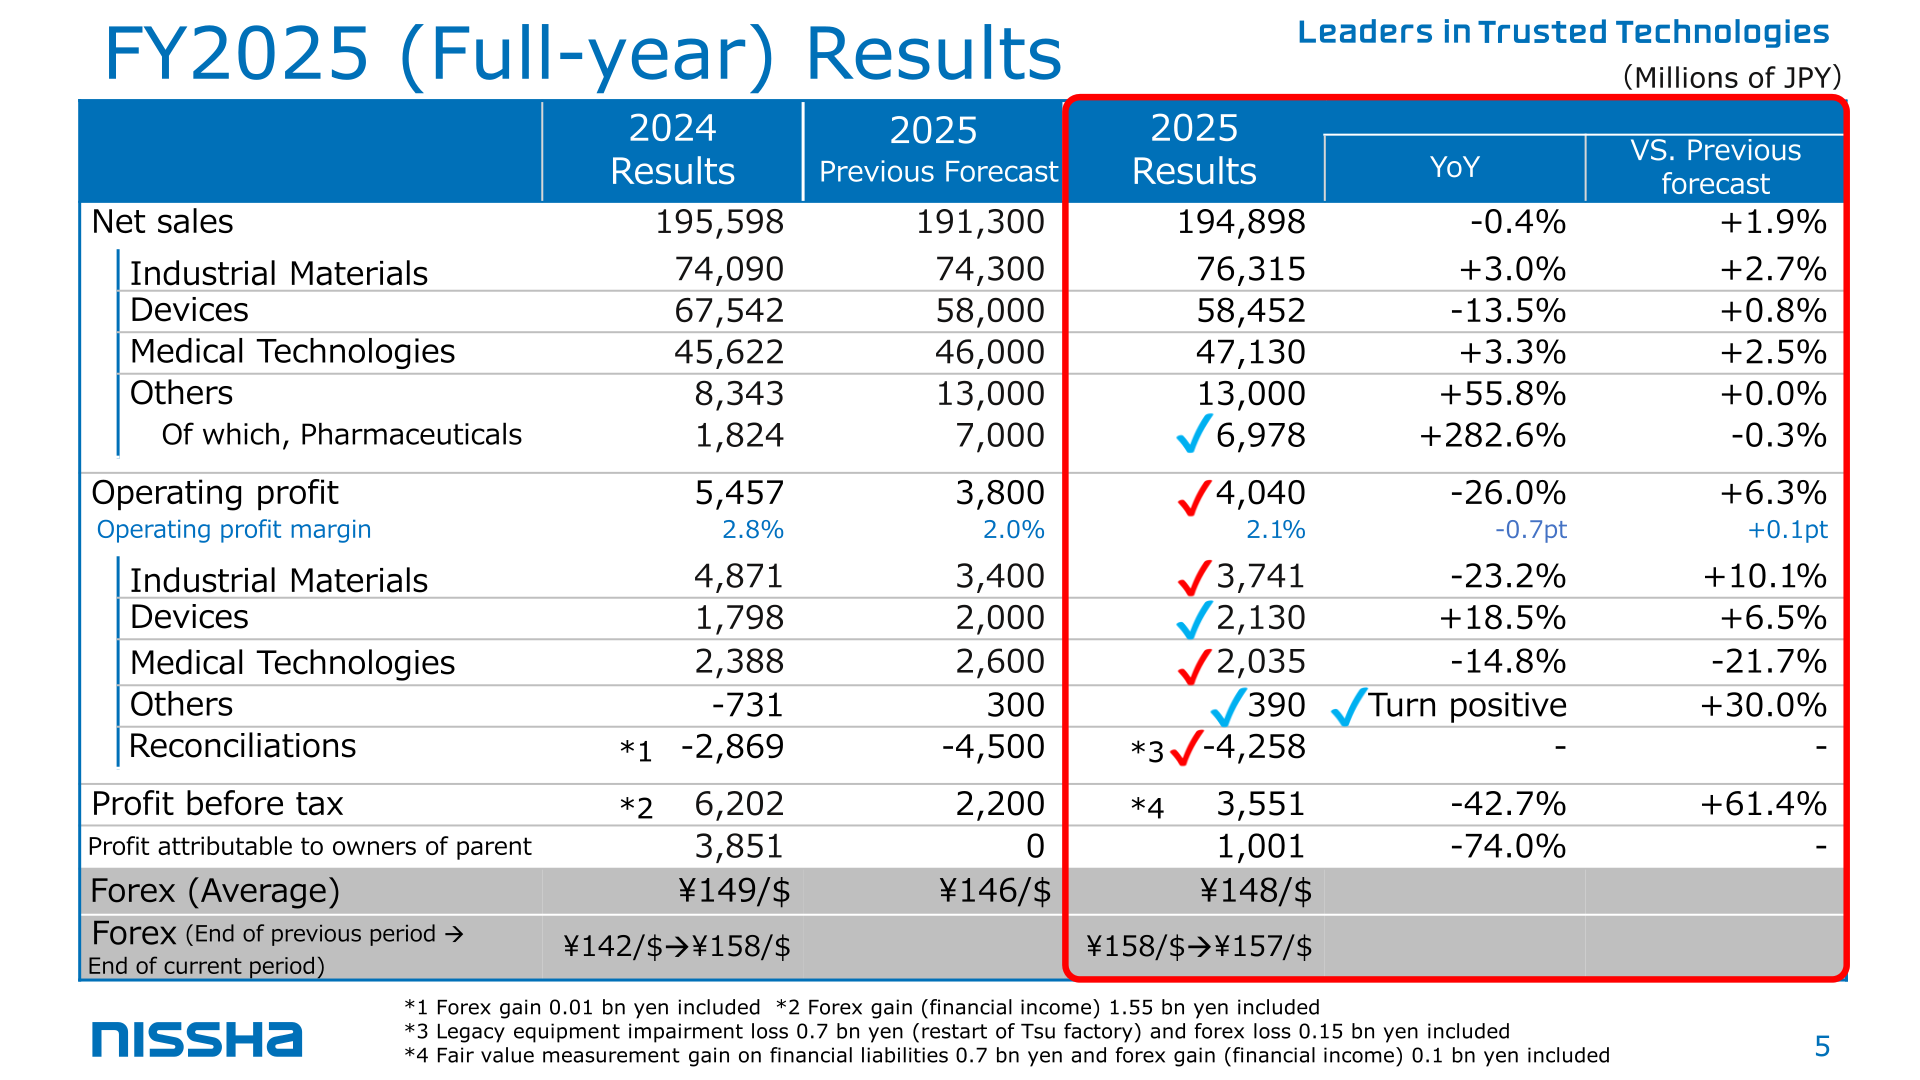
FY2025 results exceeded the company’s previous forecast on every line shown: net sales beat the 191,300 million yen previous forecast by 1.9%, and operating profit beat the 3,800 million yen previous forecast by 6.3%. Operating profit margin was 2.1% (down 0.7pt year on year, up 0.1pt versus the previous forecast). Profit before tax was 3,551 million yen (down 42.7% year on year but up 61.4% versus the previous forecast of 2,200 million yen); the FY2025 figure included a fair value measurement gain on financial liabilities of 0.7 billion yen and a forex gain (financial income) of 0.1 billion yen, while the FY2024 comparison base included a forex gain (financial income) of 1.55 billion yen. Profit attributable to owners of parent of 1,001 million yen (down 74.0% year on year) reflected, among other items, a 0.7 billion yen legacy equipment impairment loss tied to the planned restart of the Tsu factory and a 0.15 billion yen forex loss. The average exchange rate for FY2025 was 148 yen per US dollar, versus 149 yen per US dollar in FY2024.
| Item | FY2024 Results | FY2025 Previous Forecast | FY2025 Results | YoY | vs. Previous Forecast |
|---|---|---|---|---|---|
| Net sales (millions of yen) | 195,598 | 191,300 | 194,898 | -0.4% | +1.9% |
| Operating profit (millions of yen) | 5,457 | 3,800 | 4,040 | -26.0% | +6.3% |
| Operating profit margin | 2.8% | 2.0% | 2.1% | -0.7pt | +0.1pt |
| Profit before tax (millions of yen) | 6,202 | 2,200 | 3,551 | -42.7% | +61.4% |
| Profit attributable to owners of parent (millions of yen) | 3,851 | 0 | 1,001 | -74.0% | – |
Segment Results
Industrial Materials net sales rose 3.0% to 76,315 million yen, supported by steady demand for decorative products and the start of mass production of new mobility exterior functional components in the third quarter, but segment operating profit fell 23.2% to 3,741 million yen as upfront costs for the new mobility products pressured profitability. Devices net sales declined 13.5% to 58,452 million yen on lower tablet demand, yet segment operating profit increased 18.5% to 2,130 million yen as factory consolidation mitigated the impact of the demand decrease. Medical Technologies net sales grew 3.3% to 47,130 million yen on solid demand for the medical device CDMO business, while segment operating profit fell 14.8% to 2,035 million yen due to deteriorating profitability of the company’s own-brand products and temporary costs recorded in the fourth quarter. In the Others segment, net sales rose 55.8% to 13,000 million yen, of which Pharmaceuticals contributed 6,978 million yen (+282.6% year on year), as Shigaken Pharm., an OTC pharmaceuticals CDMO business acquired in January 2025, contributed to consolidated results with record-high profit and the company decided to invest in capacity expansion (conversion and restart of the Devices segment’s Tsu factory); the Others segment operating profit turned positive at 390 million yen, up 30.0% versus the previous forecast, though this also reflected an impairment loss on the legacy equipment at that same Tsu factory.
| Segment | Metric | FY2024 Results | FY2025 Results | YoY |
|---|---|---|---|---|
| Industrial Materials | Net sales (millions of yen) | 74,090 | 76,315 | +3.0% |
| Industrial Materials | Operating profit (millions of yen) | 4,871 | 3,741 | -23.2% |
| Devices | Net sales (millions of yen) | 67,542 | 58,452 | -13.5% |
| Devices | Operating profit (millions of yen) | 1,798 | 2,130 | +18.5% |
| Medical Technologies | Net sales (millions of yen) | 45,622 | 47,130 | +3.3% |
| Medical Technologies | Operating profit (millions of yen) | 2,388 | 2,035 | -14.8% |
| Others | Net sales (millions of yen) | 8,343 | 13,000 | +55.8% |
| Of which, Pharmaceuticals | Net sales (millions of yen) | 1,824 | 6,978 | +282.6% |
| Others | Operating profit (millions of yen) | (731) | 390 | Turn positive |
| Reconciliations | Operating profit (millions of yen) | (2,869) | (4,258) | – |
FY2026 Forecast
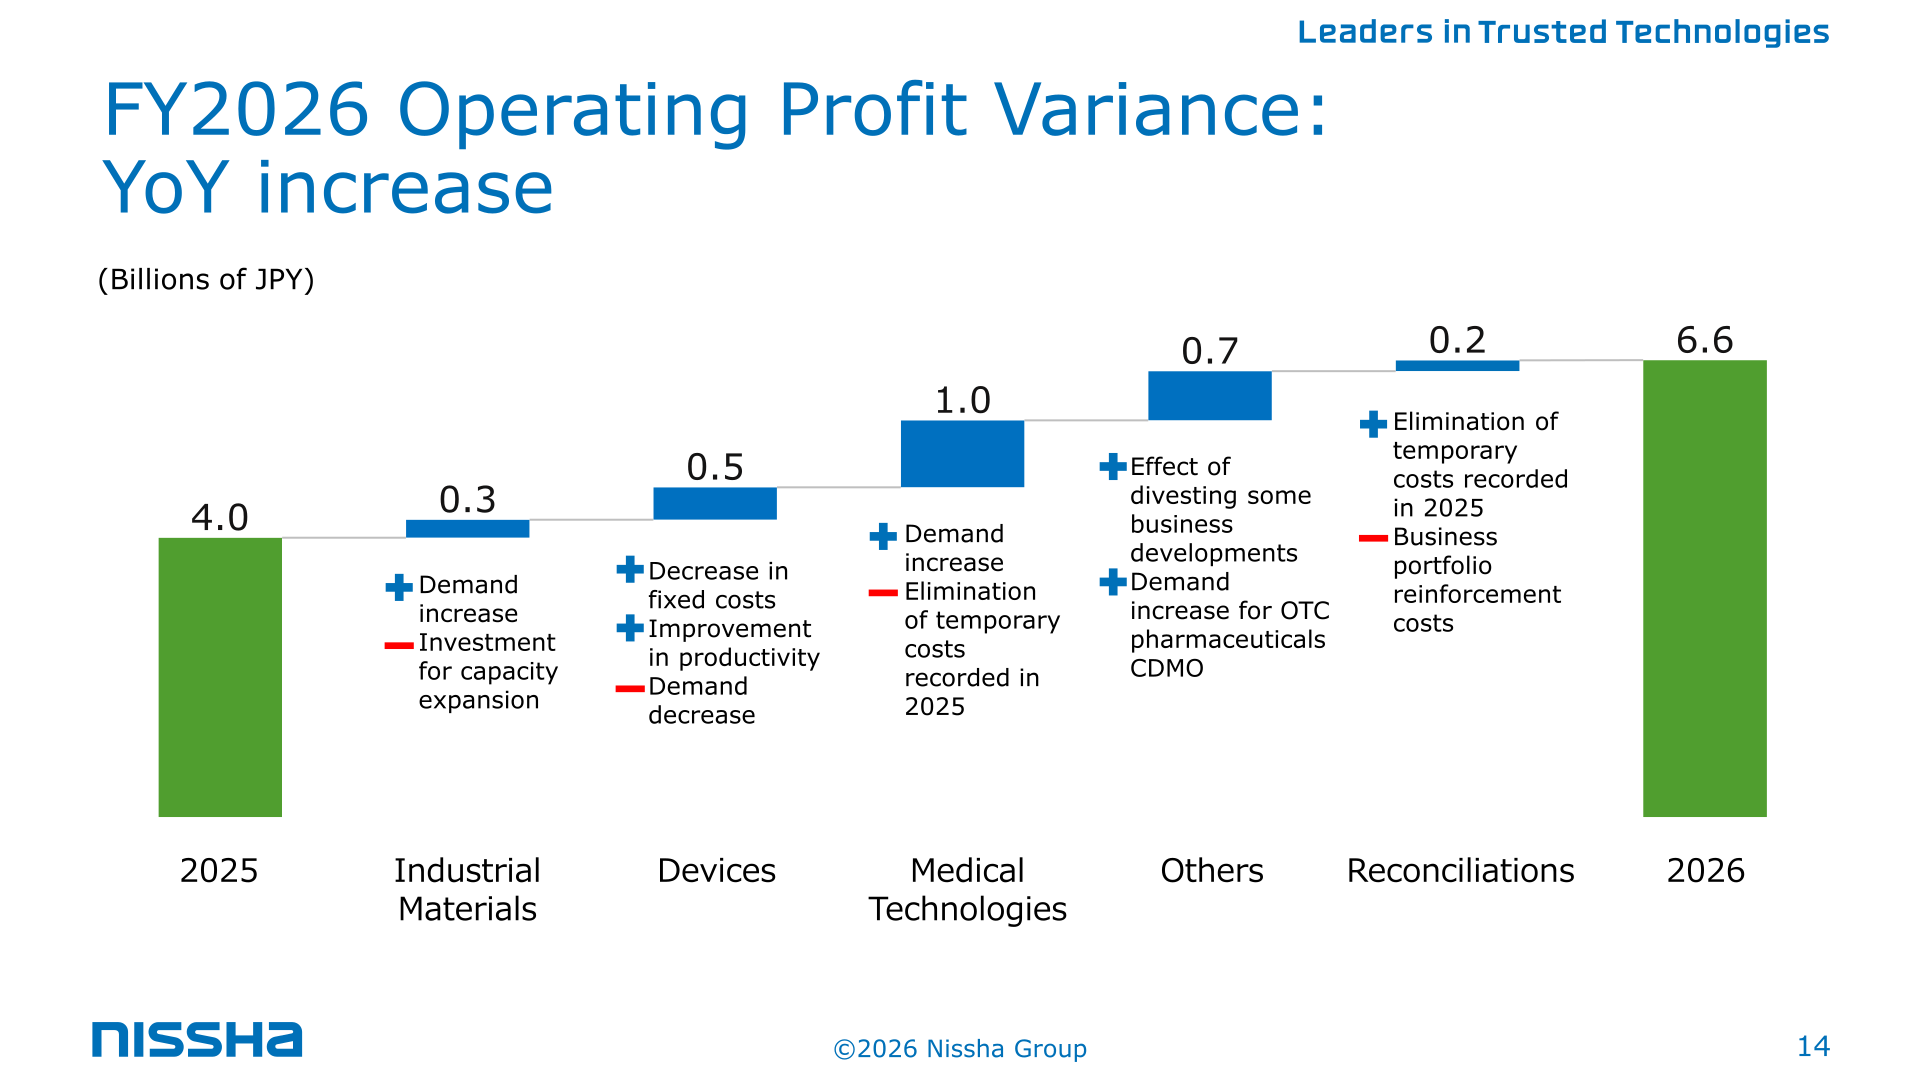
For FY2026, Nissha forecasts consolidated net sales of 191,500 million yen (down 1.7% year on year) and operating profit of 6,600 million yen (up 63.4%), with operating profit margin improving to 3.4% from 2.1% (+1.3pt). The net sales variance versus FY2025 (194.8 billion yen to 191.5 billion yen) breaks down as +2.3 billion yen from Industrial Materials (increases in decoration for mobility, exterior functional components, and home appliances, concentrated in H2), -5.9 billion yen from Devices (a significant decrease for tablets in H1 with recovery expected in H2), and +0.1 billion yen each from Medical Technologies and Others. The operating profit variance (4.0 billion yen to 6.6 billion yen) breaks down as +0.3 billion yen from Industrial Materials (demand increase net of capacity-expansion investment), +0.5 billion yen from Devices (lower fixed costs and productivity improvement net of the demand decrease), +1.0 billion yen from Medical Technologies (demand increase and elimination of temporary costs recorded in 2025), +0.7 billion yen from Others (the effect of divesting some business developments and demand increase for OTC pharmaceuticals CDMO), and +0.2 billion yen from Reconciliations (elimination of temporary costs recorded in 2025, net of business portfolio reinforcement costs). Profit before tax is forecast at 5,000 million yen (+40.8%) and profit attributable to owners of parent at 2,300 million yen (+129.6%), on an assumed exchange rate of 145 yen per US dollar. On a half-year basis, the plan calls for an operating loss in the first quarter on weak Devices tablet demand, with the bulk of the operating profit improvement concentrated in the second half (H2 operating profit margin planned at 5.5% versus H1’s 1.0%).
| Item | FY2025 Full-Year Results | FY2025 H1 Results | FY2025 H2 Results | FY2026 Full-Year Plan | FY2026 H1 Plan | FY2026 H2 Plan | YoY |
|---|---|---|---|---|---|---|---|
| Net Sales — Total (millions of yen) | 194,898 | 97,049 | 97,849 | 191,500 | 87,500 | 104,000 | -1.7% |
| Net Sales — Industrial Materials (millions of yen) | 76,315 | 37,570 | 38,745 | 78,600 | 37,000 | 41,600 | +3.0% |
| Net Sales — Devices (millions of yen) | 58,452 | 29,752 | 28,700 | 52,600 | 21,900 | 30,700 | -10.0% |
| Net Sales — Medical Technologies (millions of yen) | 47,130 | 23,459 | 23,671 | 47,200 | 22,700 | 24,500 | +0.1% |
| Net Sales — Others (millions of yen) | 13,000 | 6,267 | 6,733 | 13,100 | 5,900 | 7,200 | +0.8% |
| Net Sales — Of which, Pharmaceuticals (millions of yen) | 6,978 | 3,427 | 3,551 | 7,400 | 3,200 | 4,200 | +6.0% |
| Operating Profit — Total (millions of yen) | 4,040 | 2,558 | 1,482 | 6,600 | 900 | 5,700 | +63.4% |
| Operating Profit Margin | 2.1% | 2.6% | 1.5% | 3.4% | 1.0% | 5.5% | +1.3pt |
| Operating Profit — Industrial Materials (millions of yen) | 3,741 | 2,107 | 1,634 | 4,000 | 1,200 | 2,800 | +6.9% |
| Operating Profit — Devices (millions of yen) | 2,130 | 1,097 | 1,033 | 2,600 | 300 | 2,300 | +22.0% |
| Operating Profit — Medical Technologies (millions of yen) | 2,035 | 1,267 | 768 | 3,000 | 1,300 | 1,700 | +47.3% |
| Operating Profit — Others (millions of yen) | 390 | 291 | 99 | 1,100 | 400 | 700 | +181.7% |
| Operating Profit — Reconciliations (millions of yen) | (4,258) | (2,205) | (2,053) | (4,100) | (2,300) | (1,800) | – |
| Profit Before Tax (millions of yen) | 3,551 | 1,092 | 2,458 | 5,000 | 100 | 4,900 | +40.8% |
| Profit Attributable to Owners of Parent (millions of yen) | 1,001 | 20 | 981 | 2,300 | (1,100) | 3,400 | +129.6% |
Shareholder Returns
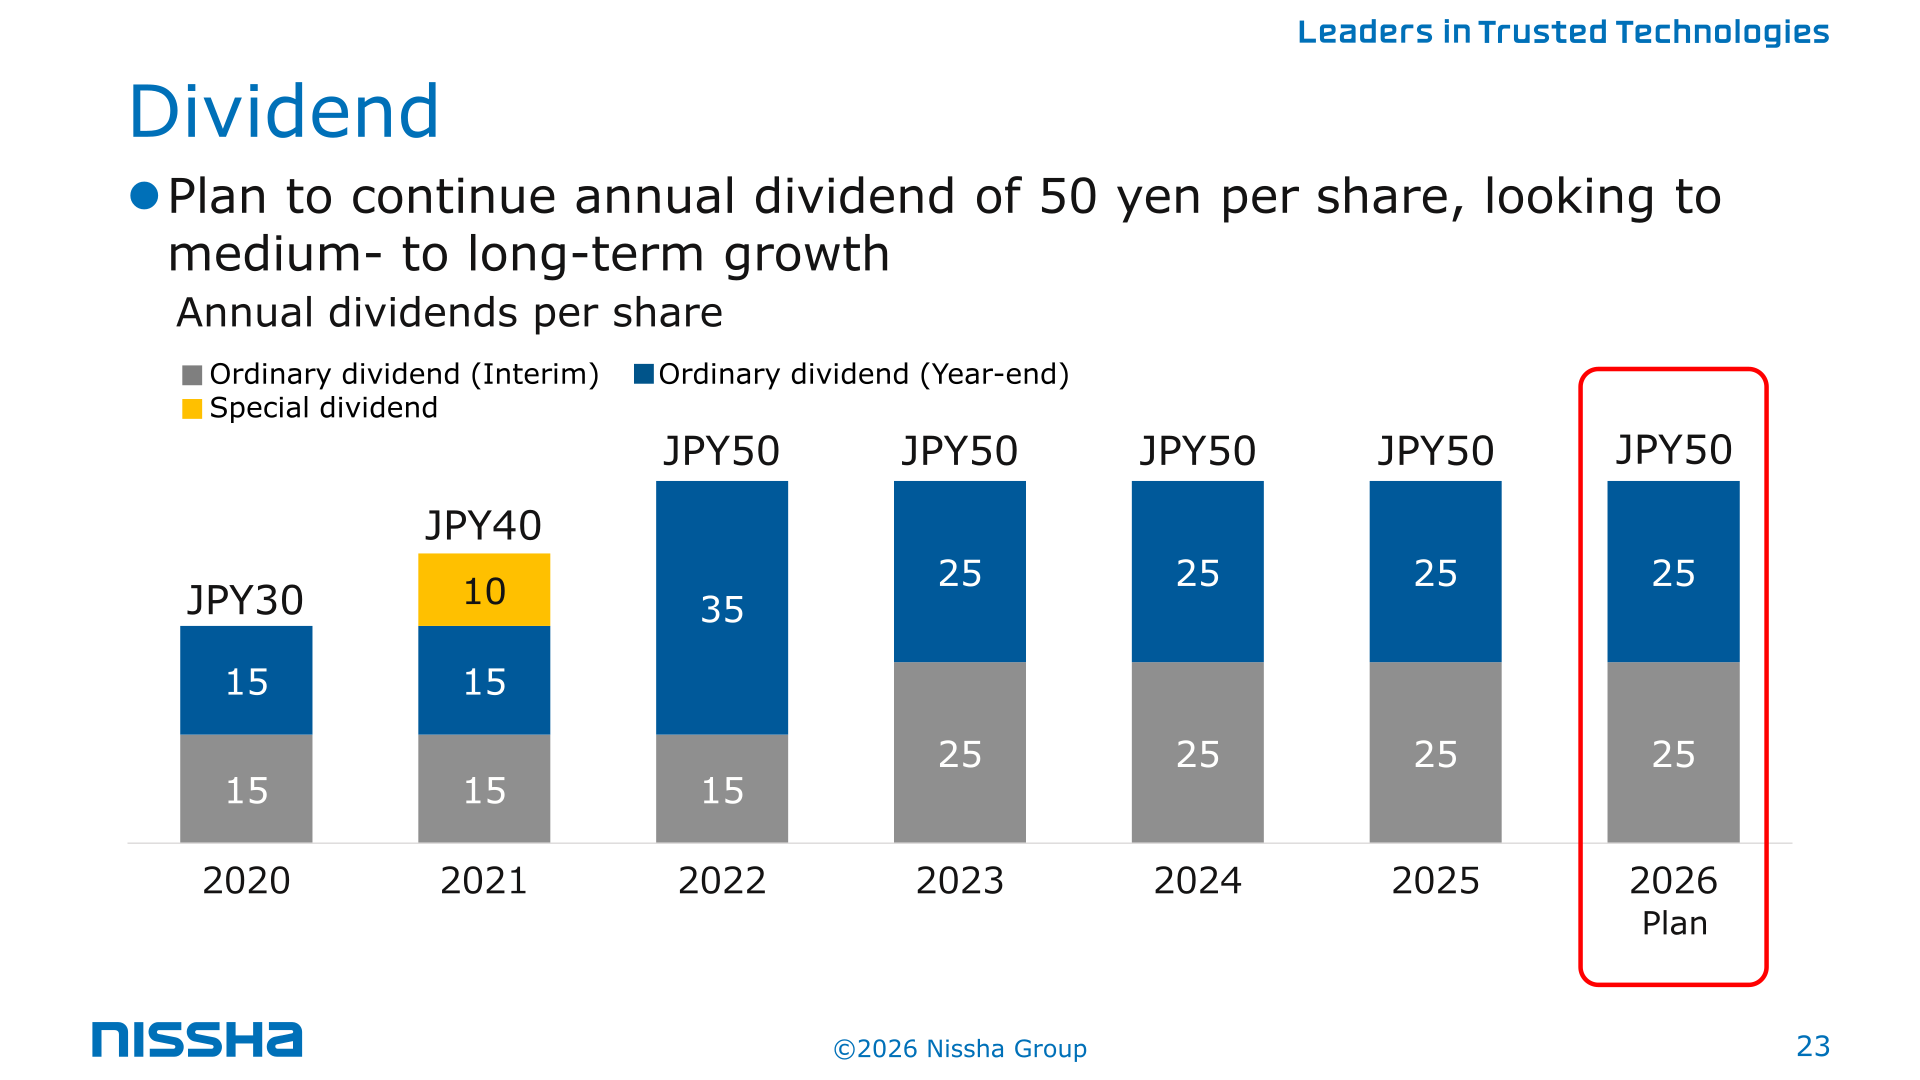
Nissha plans to continue an annual dividend of 50 yen per share (25 yen interim, 25 yen year-end) in FY2026, unchanged from FY2025 and FY2024, as it looks to medium- to long-term growth. Under the cash allocation plan for the 8th medium-term business plan (FY2024-2026), the shareholder returns target is 10.0 billion yen or higher over the three-year period, against which two-year (FY2024-FY2025) results reached 4.4 billion yen (68% progress), including dividends of 2.4 billion yen equivalent to 50 yen per share annually.
| Item | 2024 | 2025 | 2026 Plan |
|---|---|---|---|
| Interim dividend (yen per share) | 25 | 25 | 25 |
| Year-end dividend (yen per share) | 25 | 25 | 25 |
| Annual dividend total (yen per share) | 50 | 50 | 50 |
Medium-Term Plan / Topics
Nissha is pursuing “selective and disciplined diversification” under its 8th medium-term business plan, aiming to enhance ROE by improving operating profit margin through active investment in high-profit businesses and profitability improvement or divestiture of low-profit businesses; the company states that ROE has remained low, below its estimated cost of equity of 6-8% (calculated based on CAPM). In the Devices segment, Nissha executed a share purchase agreement to acquire USM Healthcare, a Vietnamese medical devices manufacturer based in Ho Chi Minh City (established 2012, net sales 417.0 billion VND / 2.4 billion yen and EBITDA 89.0 billion VND / 0.5 billion yen for FY2025.12), to be consolidated from March 2026; the company is the sole domestic stent manufacturer in Vietnam and is expected to benefit from Southeast Asia’s medical device market, projected to grow at over 10%, as well as Nissha’s existing customer network in the U.S. and Japan. Under the FY2024-2026 cash allocation plan, two-year (FY2024-FY2025) progress against three-year targets was: capital investment 11.7 billion yen against a 30.0 billion yen target (71%, corrected from a previously reported figure), M&A 13.6 billion yen against 25.0 billion yen or higher (70%, including 9.5 billion yen for the Shigaken Pharm. acquisition and the subsequently executed USM Healthcare agreement), operating cash flows 9.2 billion yen against 37.0 billion yen or higher (58%, corrected from a previously reported figure on March 23, 2026), and sale of non-operating assets/financing and others 22.1 billion yen against 28.0 billion yen or higher (95%).
This article is an analysis based on publicly available information and is not a recommendation to buy or sell any specific securities. Investment decisions are your own responsibility.
















