
This article is based on publicly available IR materials and is not a recommendation to buy or sell any specific securities.
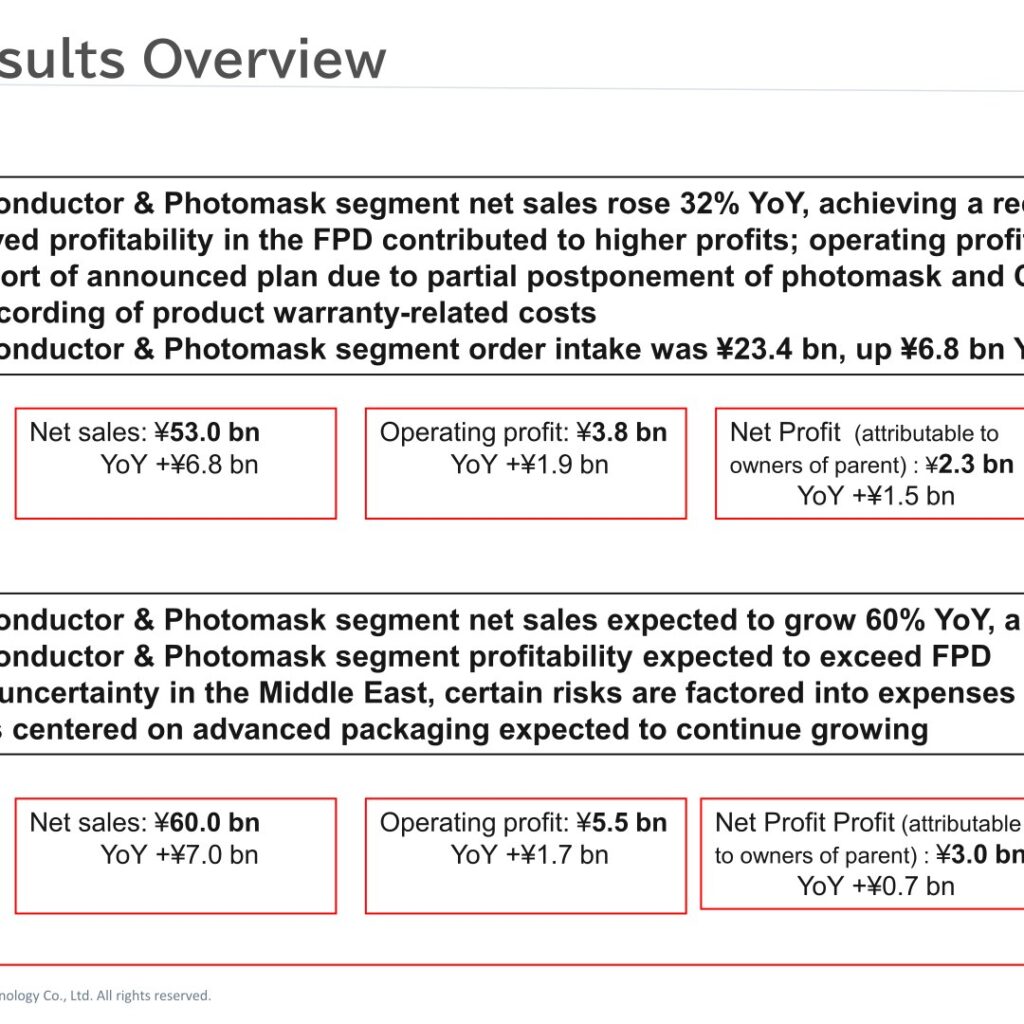
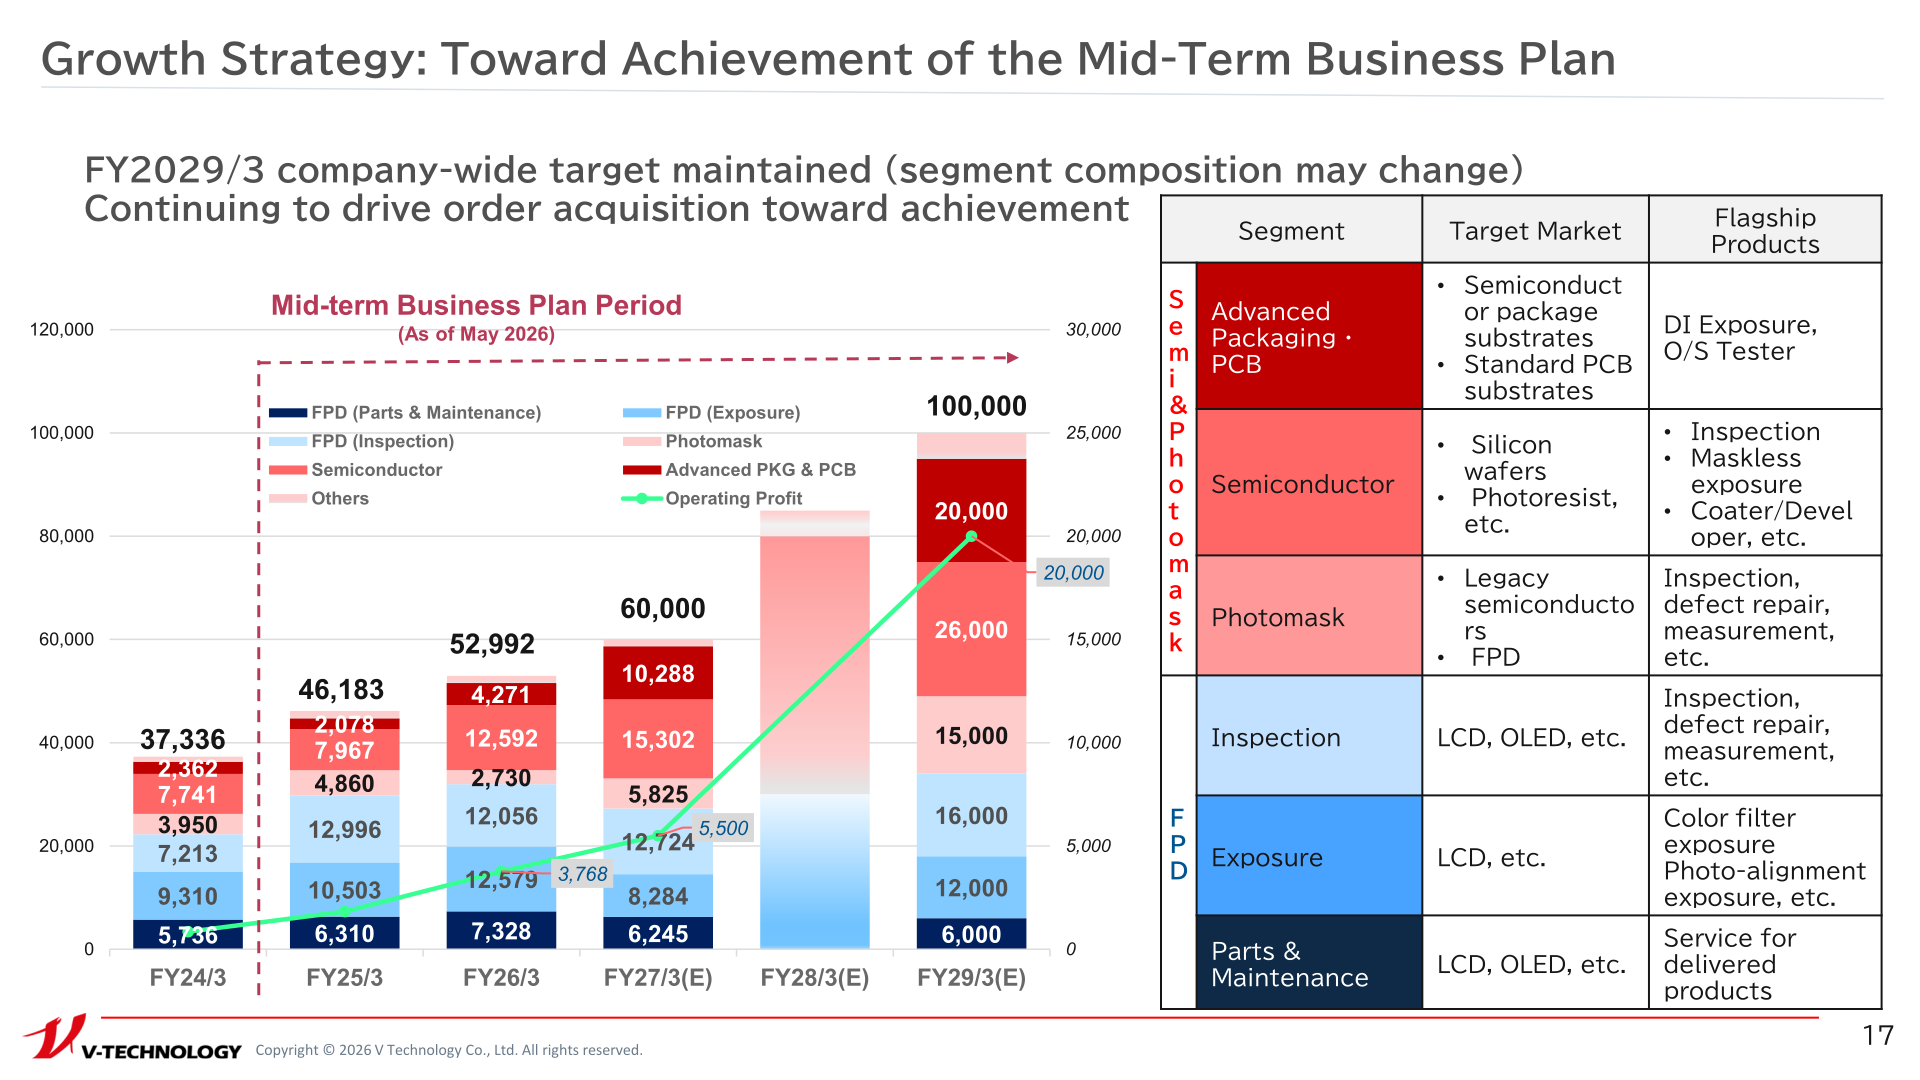
V Technology Co., Ltd. (TSE: 7717) reported consolidated results for the fiscal year ended March 31, 2026 (FY2026/3), with net sales of ¥52,992 million (¥53.0 bn), up ¥6.8 bn year on year, as net sales in the Semiconductor & Photomask segment rose 32% year on year to a record high. Operating profit doubled year on year to ¥3,768 million (¥3.8 bn), YoY +¥1.9 bn, helped by improved profitability in the FPD segment. The company noted that results fell short of its previously announced plan due to a partial postponement of photomask and CF exposure equipment sales and the recording of product warranty-related costs. For the fiscal year ending March 31, 2027 (FY2027/3), V Technology forecasts net sales of ¥60,000 million and operating profit of ¥5,500 million, with the Semiconductor & Photomask segment expected to grow 60% year on year.
Note: V Technology labels the fiscal year ended March 31, 2026 as “FY2026/3” and the following fiscal year as “FY2027/3” in its own results materials; this article follows that labeling for all figures, tables and segment data below.
Consolidated Results (FY2026/3 Actual)
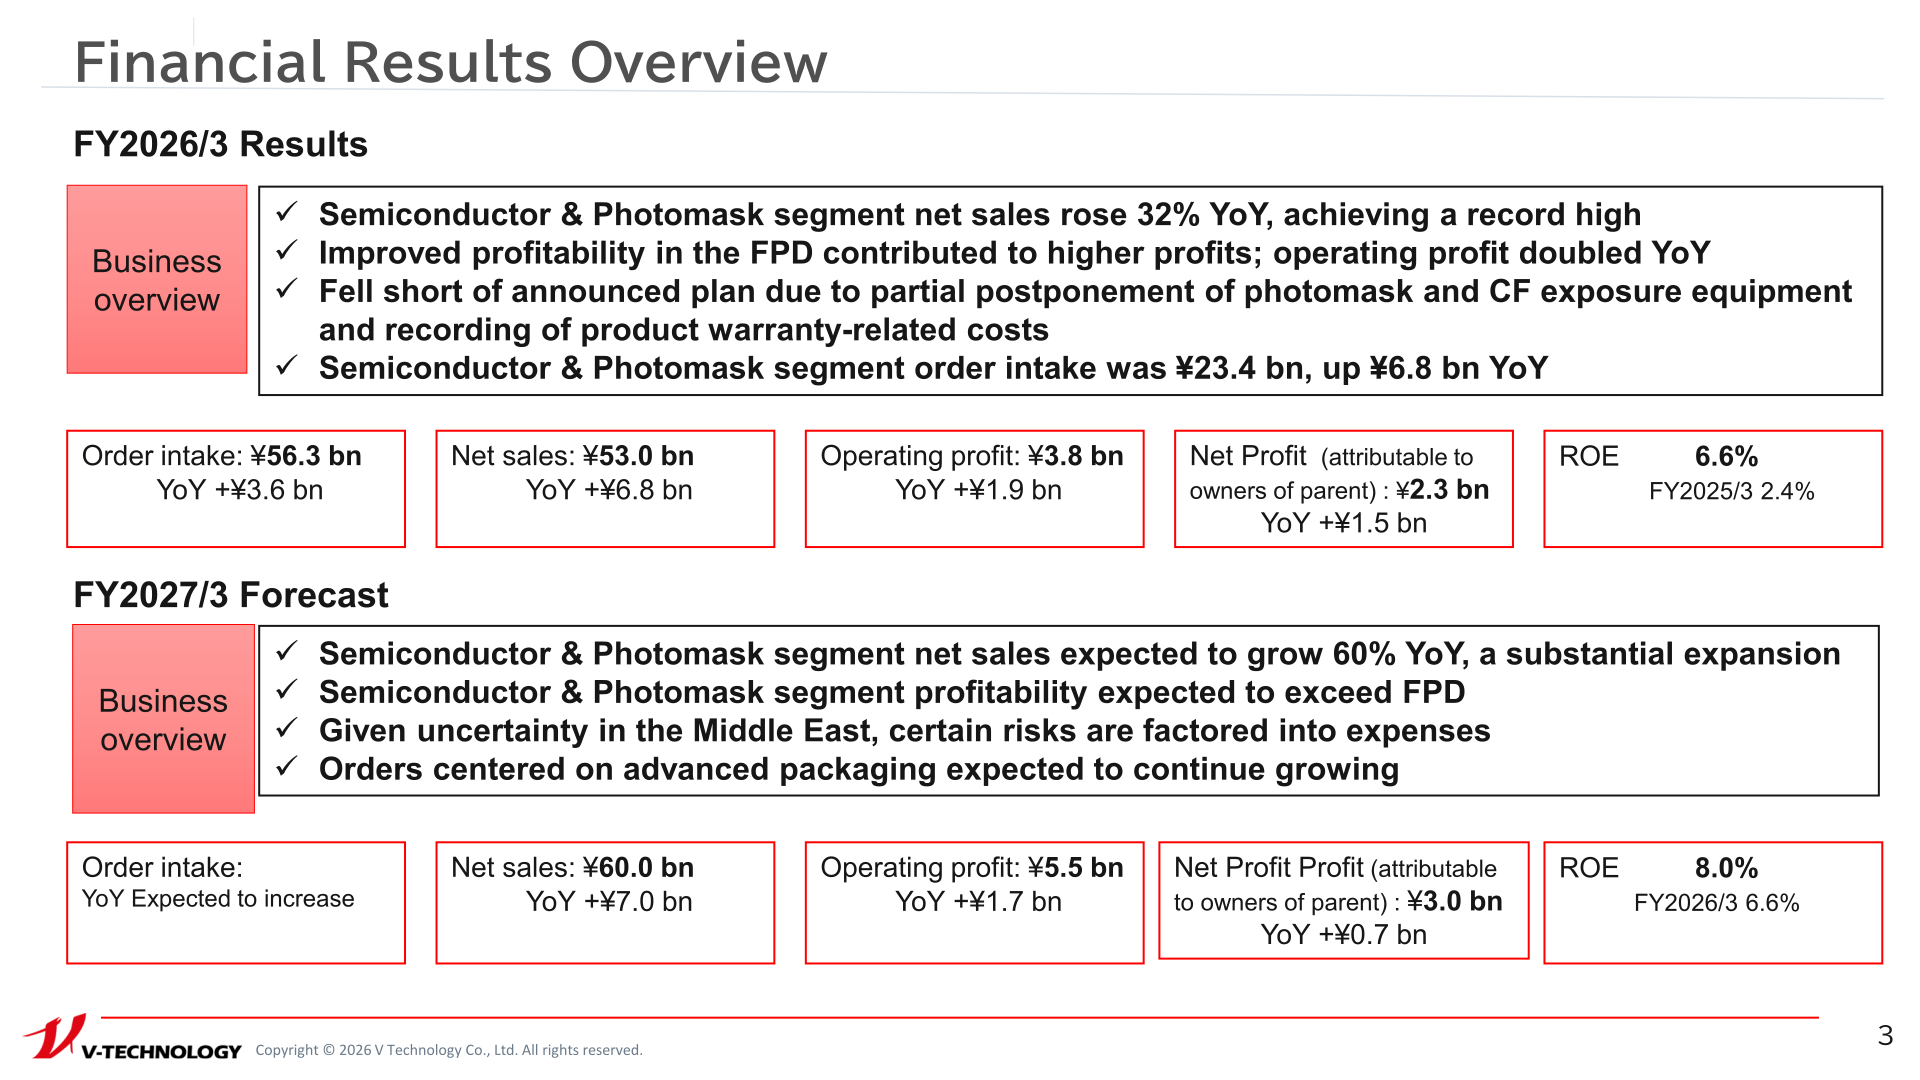
Order intake for FY2026/3 was ¥56,342 million (¥56.3 bn), up ¥3.6 bn year on year, driven by Semiconductor & Photomask segment order intake of ¥23.4 bn, up ¥6.8 bn year on year. Gross profit rose to ¥14,730 million from ¥12,130 million, and ROE improved to 6.6% from 2.4% in FY2025/3. Net profit attributable to owners of parent increased to ¥2,301 million (¥2.3 bn), up ¥1.5 bn year on year, from ¥800 million, with earnings per share of ¥243.48 versus ¥84.07 in FY2025/3.
| Item | FY2026/3 | FY2025/3 |
|---|---|---|
| Order intake (¥mn) | 56,342 | 52,747 |
| Net sales (¥mn) | 52,992 | 46,182 |
| Gross profit (¥mn) | 14,730 | 12,130 |
| Operating profit (¥mn) | 3,768 | 1,821 |
| Ordinary profit (¥mn) | 3,474 | 1,891 |
| Net profit attributable to owners of parent (¥mn) | 2,301 | 800 |
| EPS (JPY) | 243.48 | 84.07 |
| ROE | 6.6% | 2.4% |
Segment Results
By segment, Semiconductor & Photomask net sales rose to ¥19,593 million from ¥14,905 million, driven by advanced packaging and semiconductor wafer inspection equipment, while photomask net sales declined significantly to ¥2,730 million from ¥4,860 million. FPD segment net sales were ¥31,963 million versus ¥29,809 million, with inspection equipment remaining flat in both net sales and order intake, maintenance revenue increasing, and CF exposure equipment and other FPD manufacturing sales declining.
| Segment | Metric | FY2026/3 | FY2025/3 |
|---|---|---|---|
| Semiconductor & Photomask | Net sales (¥mn) | 19,593 | 14,905 |
| Semiconductor & Photomask | Order intake (¥mn) | 23,381 | 16,562 |
| – Photomask | Net sales (¥mn) | 2,730 | 4,860 |
| – Semiconductor (Wafer Mfg, etc.) | Net sales (¥mn) | 12,592 | 7,967 |
| – Advanced Packaging & PCB | Net sales (¥mn) | 4,271 | 2,078 |
| FPD | Net sales (¥mn) | 31,963 | 29,809 |
| FPD | Order intake (¥mn) | 31,136 | 34,716 |
| – Inspection | Net sales (¥mn) | 12,056 | 12,996 |
| – Manufacturing | Net sales (¥mn) | 12,579 | 10,503 |
| – Maintenance | Net sales (¥mn) | 7,328 | 6,310 |
| Others | Net sales (¥mn) | 1,436 | 1,469 |
FY2027/3 Forecast
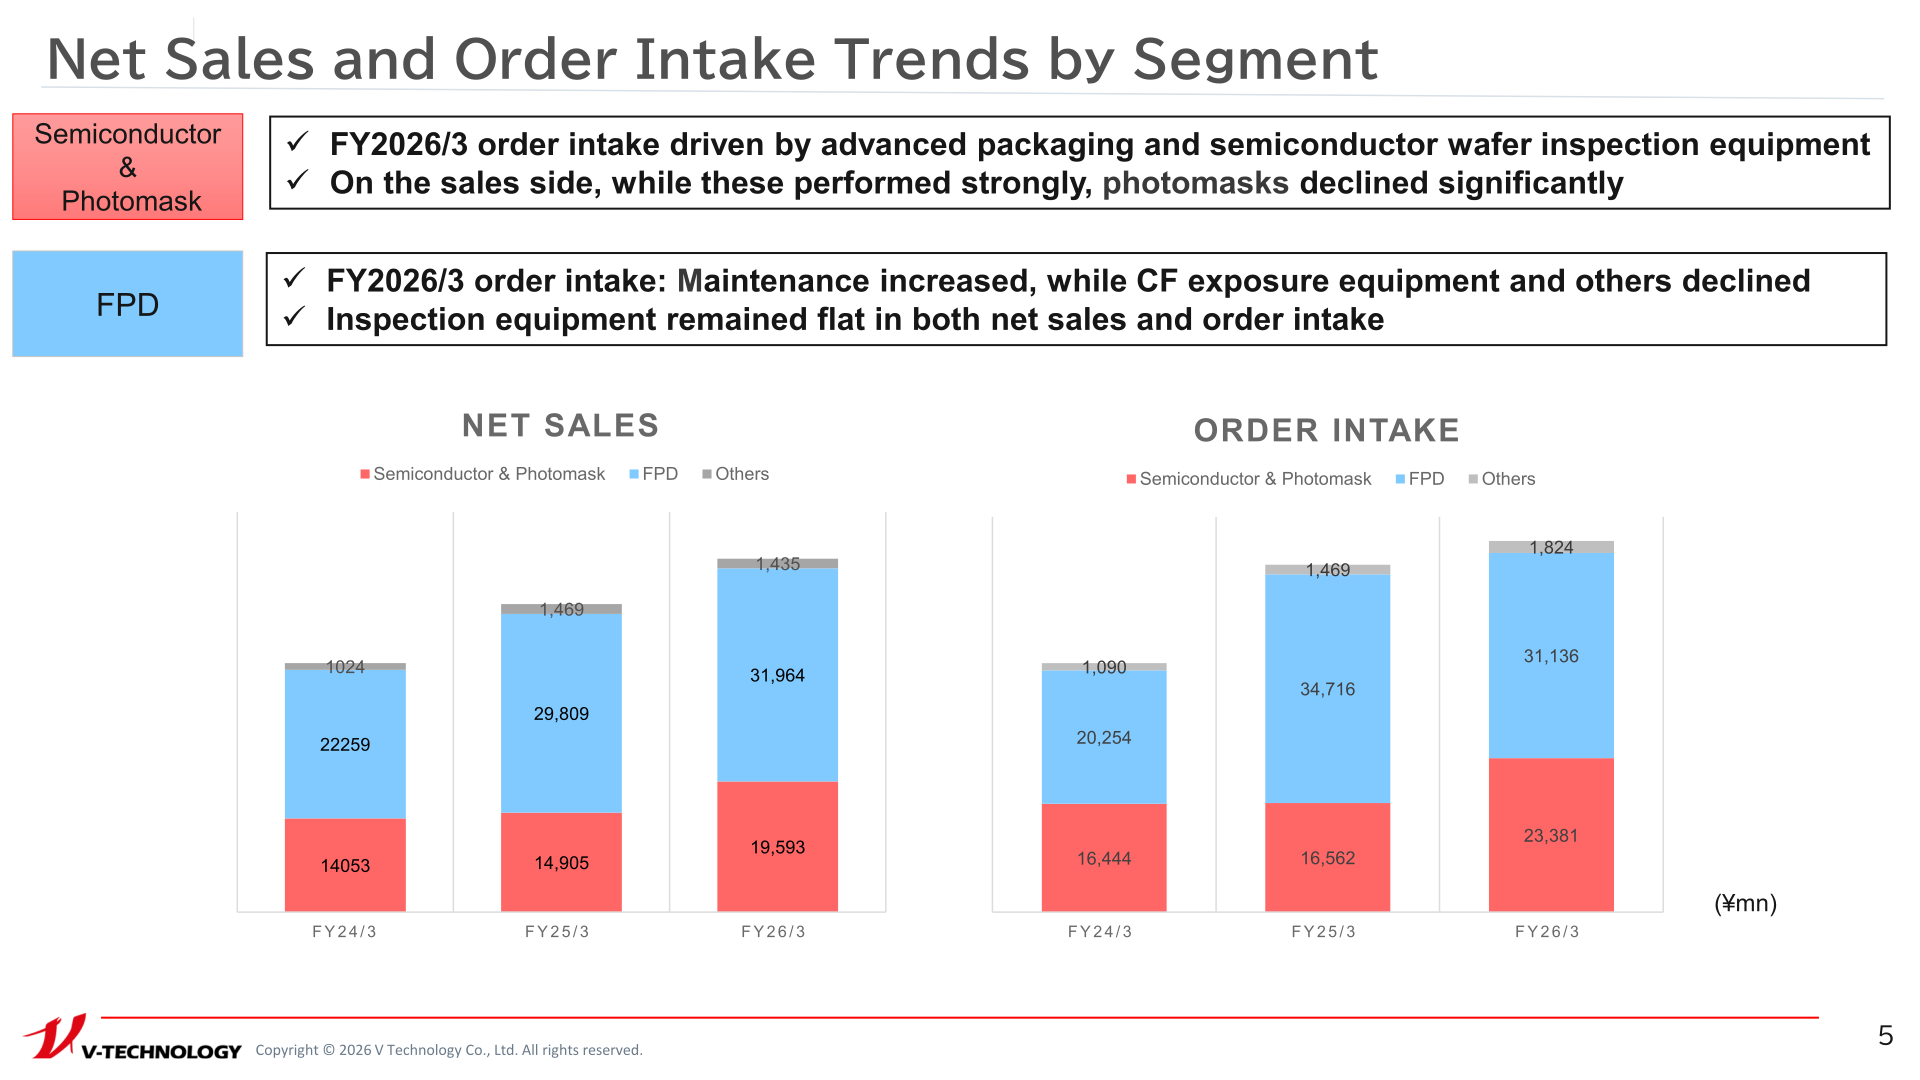
For FY2027/3, V Technology expects full-scale expansion of DI exposure equipment for advanced packaging to contribute to Semiconductor & Photomask segment growth, with photomask net sales expected to recover from the low level of FY2026/3. In the FPD segment, CF exposure equipment sales are expected to decline while inspection equipment is expected to remain strong. The company also cited uncertainty in the Middle East as a factor incorporated into its expense assumptions.
| Item | FY2027/3 Forecast | FY2026/3 (Actual) | Change |
|---|---|---|---|
| Net Sales (¥mn) | 60,000 | 52,992 | +7,008 |
| Operating profit (¥mn) | 5,500 | 3,768 | +1,732 |
| Operating profit margin | 9.1% | 7.1% | |
| Ordinary profit (¥mn) | 4,700 | 3,474 | +1,226 |
| Ordinary profit margin | 7.8% | 6.6% | |
| Net Profit attributable to owners of parent (¥mn) | 3,000 | 2,301 | +699 |
| Net profit margin | 5.0% | 4.3% | |
| EPS (JPY) | 317.35 | 243.48 | +73.87 |
| Dividend – 1st Half (JPY) | 40 | 40 | – |
| Dividend – 2nd Half (JPY) | 40 | 40 | – |
| Payout ratio | 25.2% | 32.9% |
Shareholder Returns
V Technology’s shareholder return policy considers stability, continuity, payout ratio, and the internal reserves needed for M&A and capital expenditure, with a policy of returning profits commensurate with business performance. The company plans an annual dividend of ¥80 per share for FY2027/3, unchanged from FY2026/3, split evenly between an interim dividend of ¥40 and a year-end dividend of ¥40, and stated that aggressive returns are also under consideration and that it will continue exploring flexible share buybacks to enhance returns.
| Item | FY2025/3 | FY2026/3 | FY2027/3 (E) |
|---|---|---|---|
| Dividend amount (Total, ¥mn) | 765 | 765 | 765 |
| Payout ratio (%) | 95.2 | 32.9 | 25.2 |
| Dividends per share – 1st Half (JPY) | 40 | 40 | 40 |
| Dividends per share – 2nd Half (JPY) | 40 | 40 | 40 |
| Dividends per share – Total (JPY) | 80 | 80 | 80 |
Growth Strategy / Mid-Term Plan
V Technology maintains its FY2029/3 company-wide targets under its mid-term business plan (as of May 2026), targeting net sales of ¥100,000 million and operating profit of ¥20,000 million, stating that segment composition may change and that it will continue driving order acquisition toward achievement. Growth is centered on the Advanced Packaging & PCB sub-segment, with flagship products including DI exposure equipment and open/short testers for semiconductor package substrates and standard PCB substrates. The company also cited an April 7, 2026 news release stating that V Technology and its consolidated subsidiary LE-TECHNOLOGY Co., Ltd. received an order from NEDO, through Osaka Metropolitan University, for LAMBDI, a DI exposure system the companies describe as the world’s first to achieve L/S = 0.5μm-class resolution for interposers and package substrates.
This article is an analysis based on publicly available information and is not a recommendation to buy or sell any specific securities. Investment decisions are your own responsibility.
















