
This article is based on publicly available IR materials and is not a recommendation to buy or sell any specific securities.
Note: Ohashi Technica’s own results presentation labels the fiscal year ended March 31, 2026 as “FY2026” and the prior fiscal year ended March 31, 2025 as “FY2025” (i.e. the company names each fiscal year after its ending calendar year). This differs from japan-equity.com’s site-wide convention of designating the most recently completed fiscal year as “FY2025” in the article title and slug. All tables and figures below retain the company’s own “FY2025″/”FY2026” labels exactly as presented in the source materials.
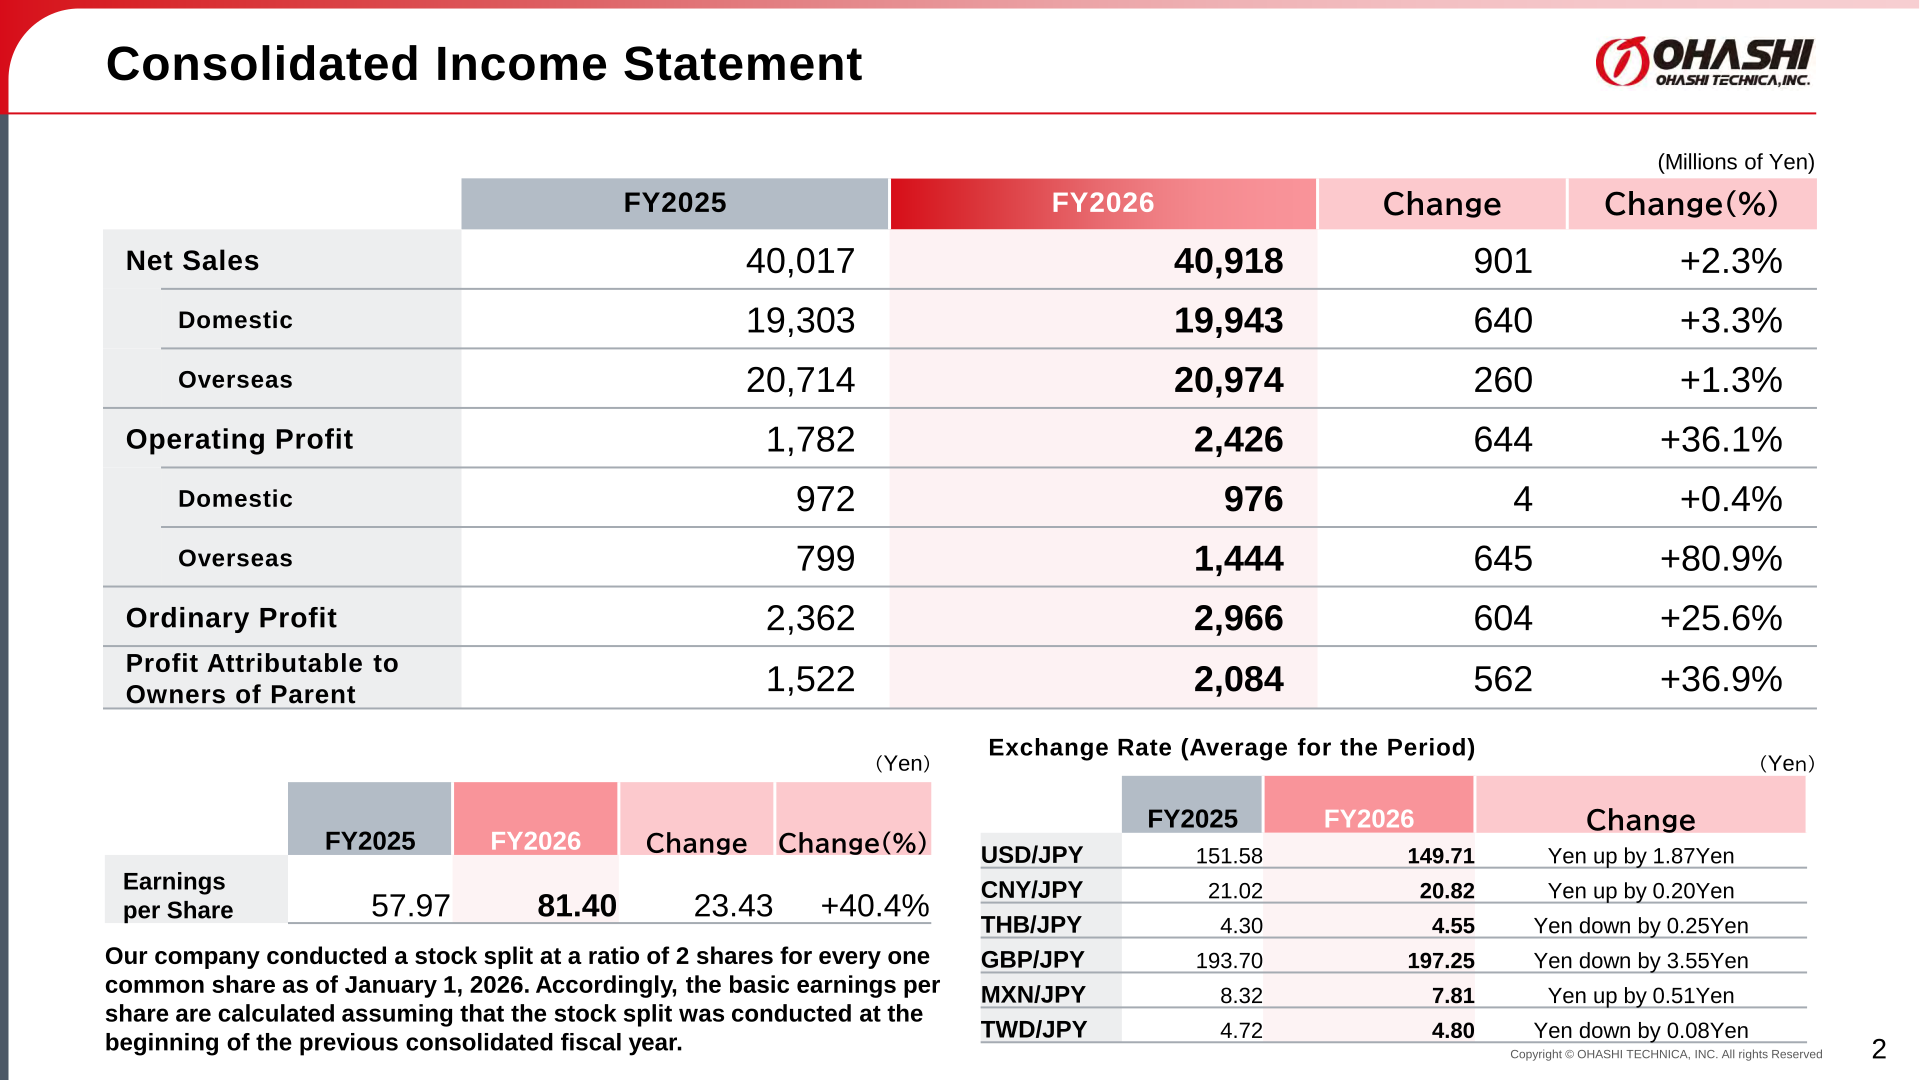
Ohashi Technica, Inc. reported consolidated net sales of ¥40,918 million for the fiscal year ended March 31, 2026 (the company’s “FY2026”), up 2.3% year on year, with both domestic and overseas sales increasing. Operating profit rose 36.1% to ¥2,426 million, ordinary profit rose 25.6% to ¥2,966 million, and profit attributable to owners of parent rose 36.9% to ¥2,084 million. The increase was led by overseas operating profit, which climbed 80.9% to ¥1,444 million, primarily on a 62.3% jump in Americas operating profit.
Consolidated Results (FY2026 Actual)
Net sales grew in both the domestic market (+3.3%) and overseas markets (+1.3%), while overseas operating profit growth (+80.9%) far outpaced domestic (+0.4%). Basic earnings per share rose 40.4% to ¥81.40; the company conducted a two-for-one stock split effective January 1, 2026, and FY2025 EPS is calculated assuming the split occurred at the start of that prior fiscal year.
| Item | FY2025 | FY2026 | Change | Change (%) |
|---|---|---|---|---|
| Net Sales | 40,017 | 40,918 | 901 | +2.3% |
| Domestic | 19,303 | 19,943 | 640 | +3.3% |
| Overseas | 20,714 | 20,974 | 260 | +1.3% |
| Operating Profit | 1,782 | 2,426 | 644 | +36.1% |
| Domestic | 972 | 976 | 4 | +0.4% |
| Overseas | 799 | 1,444 | 645 | +80.9% |
| Ordinary Profit | 2,362 | 2,966 | 604 | +25.6% |
| Profit Attributable to Owners of Parent | 1,522 | 2,084 | 562 | +36.9% |
| Earnings per Share (Yen) | 57.97 | 81.40 | 23.43 | +40.4% |
Results by Region
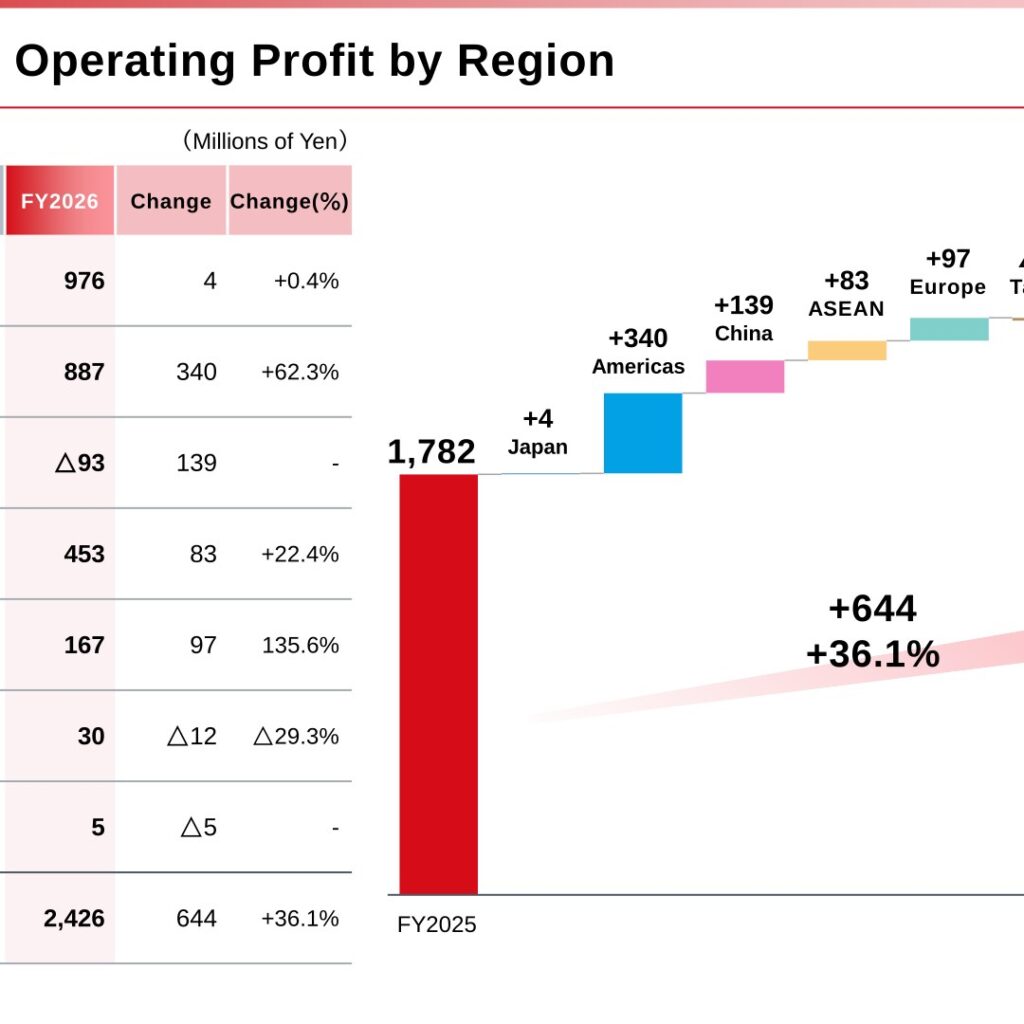
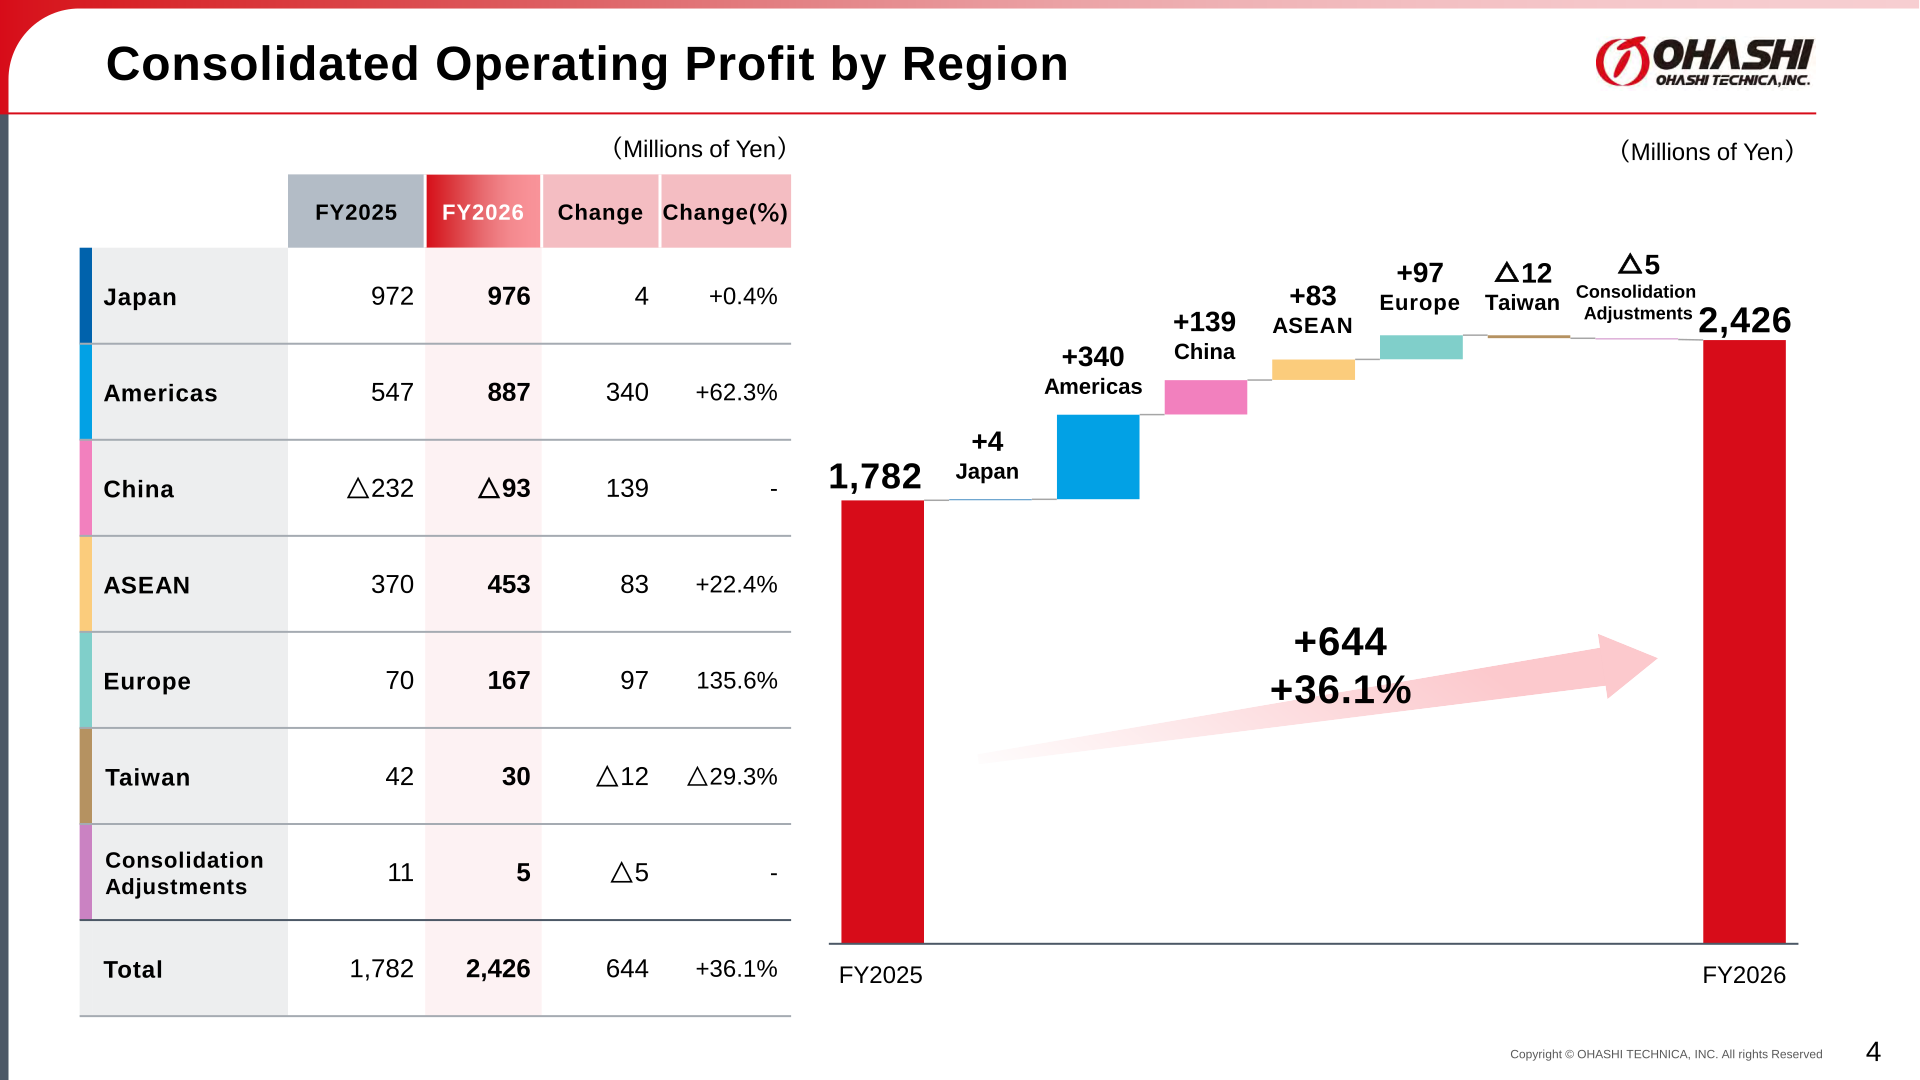
By region, net sales increased across Japan, the Americas, ASEAN and Europe, while China sales declined 16.5%. The ratio of overseas sales to total sales was 51.3% in FY2026, versus 51.8% in FY2025. On the profit side, Americas operating profit rose ¥340 million (+62.3%) to ¥887 million, Europe rose 135.6% to ¥167 million, and the China operating loss narrowed from ¥232 million to ¥93 million; Taiwan operating profit declined 29.3% to ¥30 million.
| Region | FY2025 Net Sales | FY2026 Net Sales | Change | Change (%) |
|---|---|---|---|---|
| Japan | 19,303 | 19,943 | 640 | +3.3% |
| Americas | 13,630 | 14,109 | 479 | +3.5% |
| China | 2,722 | 2,273 | △449 | △16.5% |
| ASEAN | 2,938 | 3,105 | 167 | +5.7% |
| Europe | 1,422 | 1,487 | 65 | +4.6% |
| Total | 40,017 | 40,918 | 901 | +2.3% |
| Region | FY2025 Operating Profit | FY2026 Operating Profit | Change | Change (%) |
|---|---|---|---|---|
| Japan | 972 | 976 | 4 | +0.4% |
| Americas | 547 | 887 | 340 | +62.3% |
| China | △232 | △93 | 139 | – |
| ASEAN | 370 | 453 | 83 | +22.4% |
| Europe | 70 | 167 | 97 | 135.6% |
| Taiwan | 42 | 30 | △12 | △29.3% |
| Consolidation Adjustments | 11 | 5 | △5 | – |
| Total | 1,782 | 2,426 | 644 | +36.1% |
Balance Sheet and Cash Flow
Total assets were ¥48,134 million at the end of FY2026, versus ¥48,683 million a year earlier, with an equity ratio of 80.4% (FY2025: 84.2%). Operating activities generated ¥2,520 million in cash. Investing activities used ¥888 million, mainly ¥1,729 million for purchases of property, plant and equipment, partly offset by ¥866 million in proceeds from the sale of investment securities and a ¥123 million increase in time deposits. Financing activities used ¥1,347 million, including ¥914 million in dividends paid and ¥292 million for purchases of treasury shares. Including a positive ¥304 million effect of exchange rate changes, cash and cash equivalents rose ¥588 million to ¥17,603 million at fiscal year-end, from ¥17,015 million at the start of the year.
FY2027 Forecast
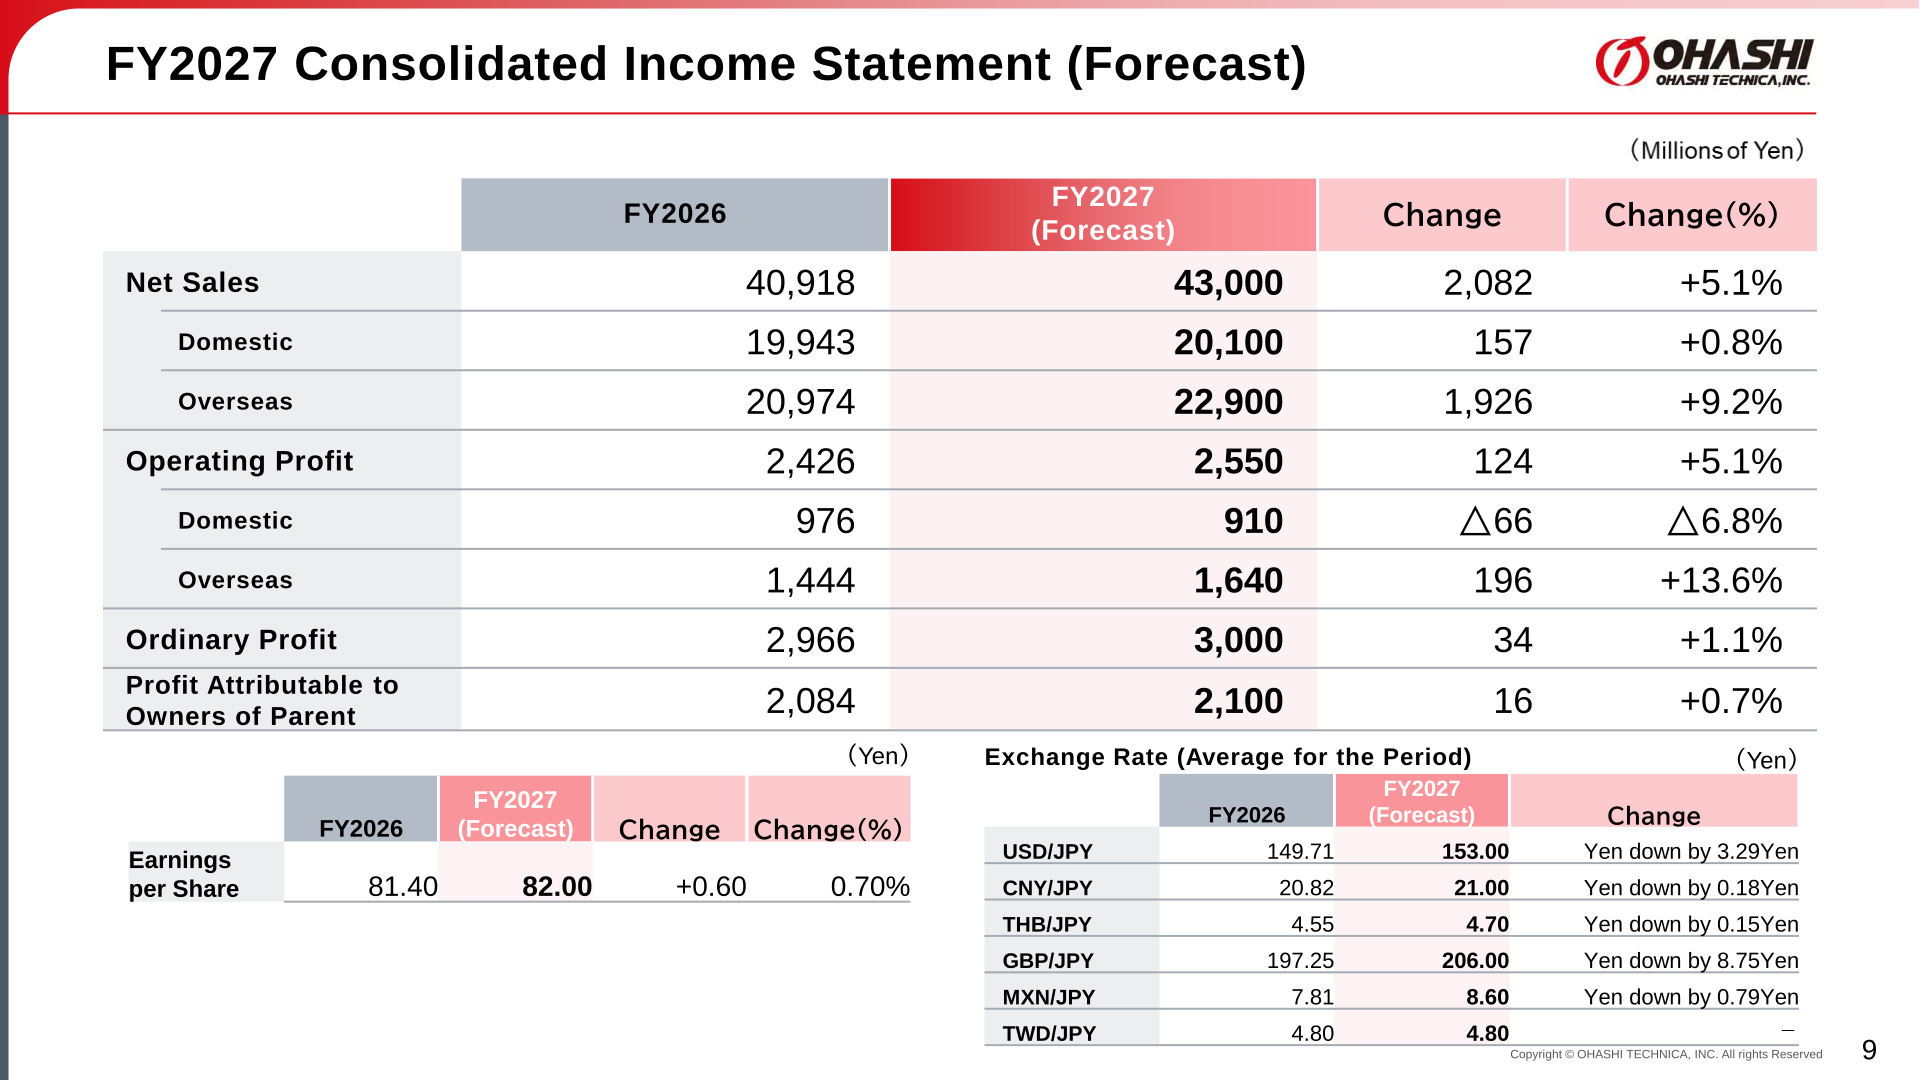
For the fiscal year ending March 31, 2027 (the company’s “FY2027”), Ohashi Technica forecasts consolidated net sales of ¥43,000 million (+5.1%), operating profit of ¥2,550 million (+5.1%), ordinary profit of ¥3,000 million (+1.1%), and profit attributable to owners of parent of ¥2,100 million (+0.7%). Overseas net sales are forecast to grow 9.2% to ¥22,900 million and overseas operating profit is forecast to grow 13.6% to ¥1,640 million, while domestic operating profit is forecast to decline 6.8% to ¥910 million. The forecast assumes an average USD/JPY rate of ¥153.00, versus ¥149.71 in FY2026.
| Item | FY2026 | FY2027 (Forecast) | Change | Change (%) |
|---|---|---|---|---|
| Net Sales | 40,918 | 43,000 | 2,082 | +5.1% |
| Domestic | 19,943 | 20,100 | 157 | +0.8% |
| Overseas | 20,974 | 22,900 | 1,926 | +9.2% |
| Operating Profit | 2,426 | 2,550 | 124 | +5.1% |
| Domestic | 976 | 910 | △66 | △6.8% |
| Overseas | 1,444 | 1,640 | 196 | +13.6% |
| Ordinary Profit | 2,966 | 3,000 | 34 | +1.1% |
| Profit Attributable to Owners of Parent | 2,084 | 2,100 | 16 | +0.7% |
| Earnings per Share (Yen) | 81.40 | 82.00 | +0.60 | 0.70% |
Shareholder Returns
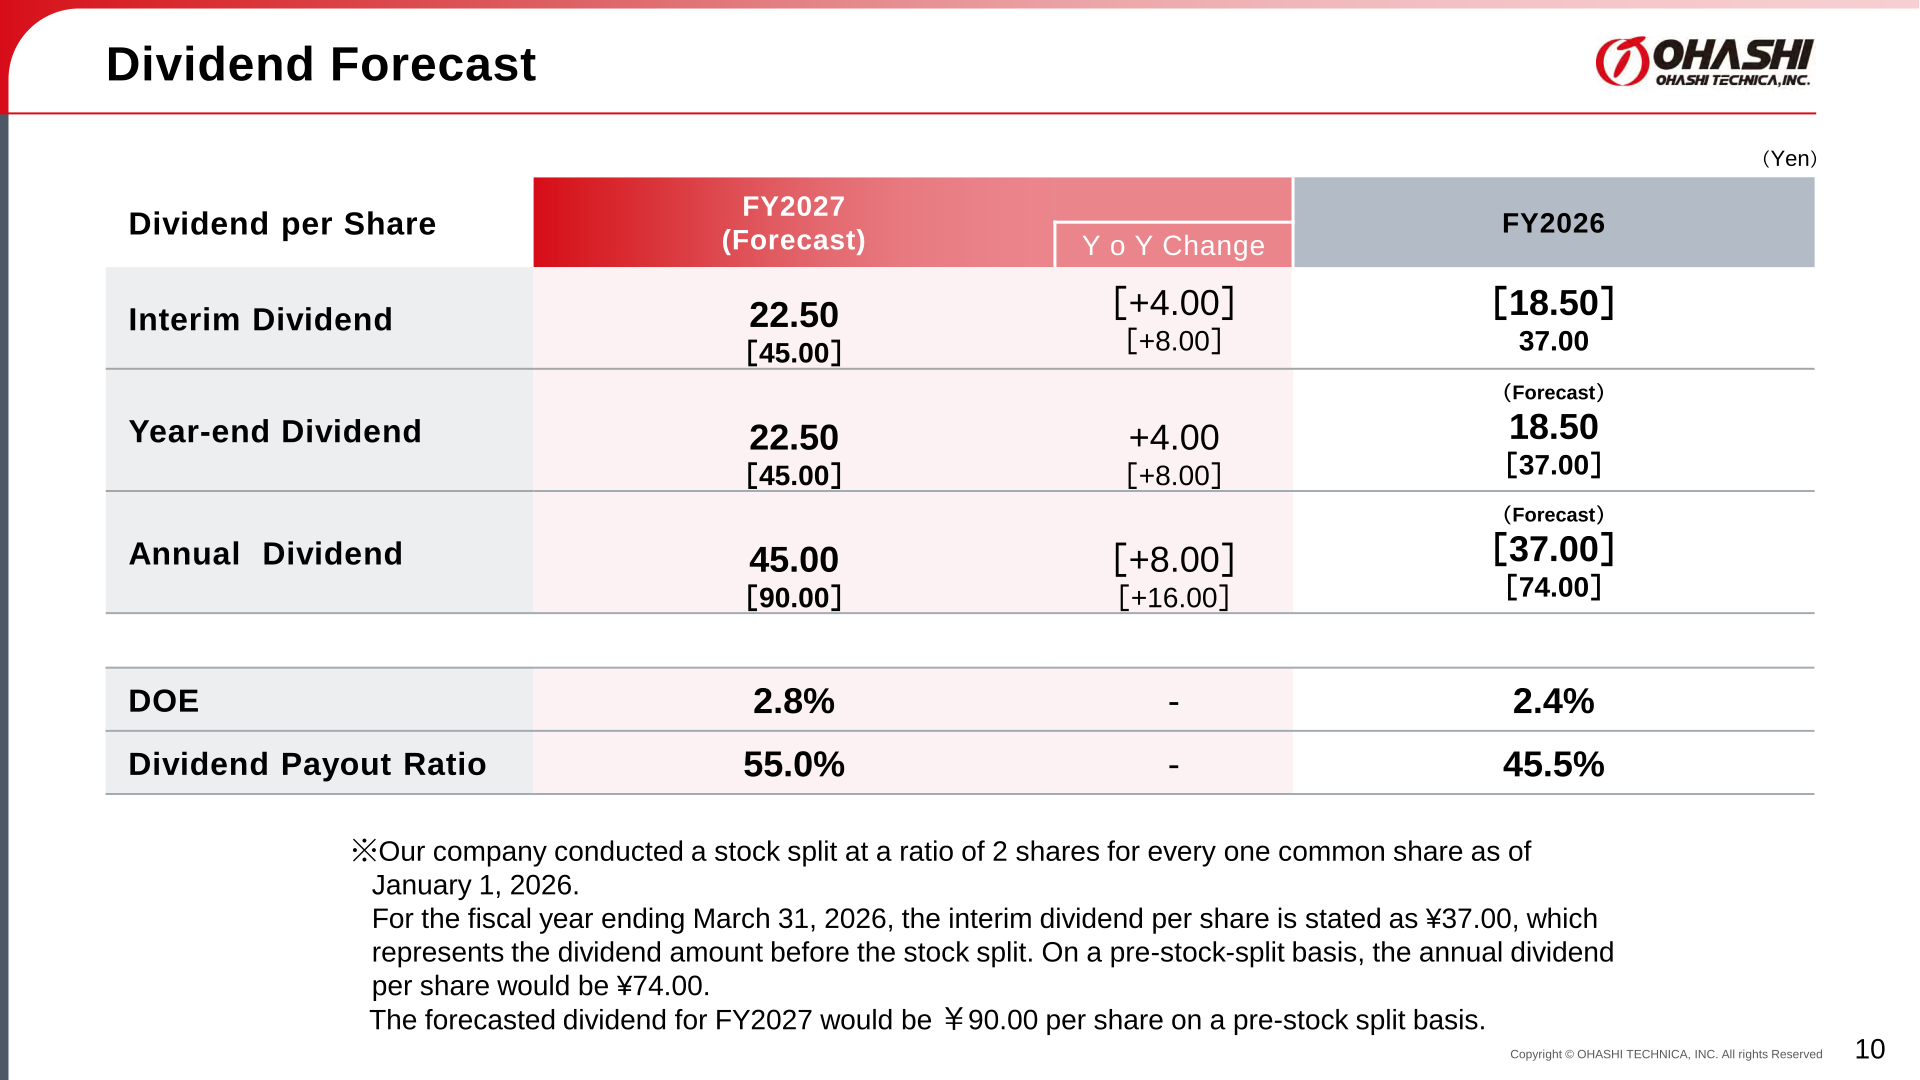
Ohashi Technica conducted a two-for-one stock split effective January 1, 2026. Because the FY2026 interim dividend was determined and paid before the split’s effective date, it is stated in the presentation on a pre-split basis (¥37.00); the FY2026 year-end dividend forecast of ¥18.50 is stated on a post-split basis, so on a pre-split basis the FY2026 annual dividend would be ¥74.00. For FY2027, the company forecasts a post-split annual dividend of ¥45.00 per share (¥22.50 interim, ¥22.50 year-end), equivalent to ¥90.00 per share on a pre-split basis, representing a payout ratio of 55.0% and a DOE of 2.8% (versus a 45.5% payout ratio and 2.4% DOE in FY2026).
| Item | FY2027 (Forecast) | YoY Change | FY2026 |
|---|---|---|---|
| Interim Dividend | 22.50 [45.00] | [+4.00] [+8.00] | [18.50] 37.00 |
| Year-end Dividend | 22.50 [45.00] | +4.00 [+8.00] | (Forecast) 18.50 [37.00] |
| Annual Dividend | 45.00 [90.00] | [+8.00] [+16.00] | (Forecast) [37.00] [74.00] |
| DOE | 2.8% | – | 2.4% |
| Dividend Payout Ratio | 55.0% | – | 45.5% |
This article is an analysis based on publicly available information and is not a recommendation to buy or sell any specific securities. Investment decisions are your own responsibility.
















