
This article is based on publicly available IR materials and is not a recommendation to buy or sell any specific securities.
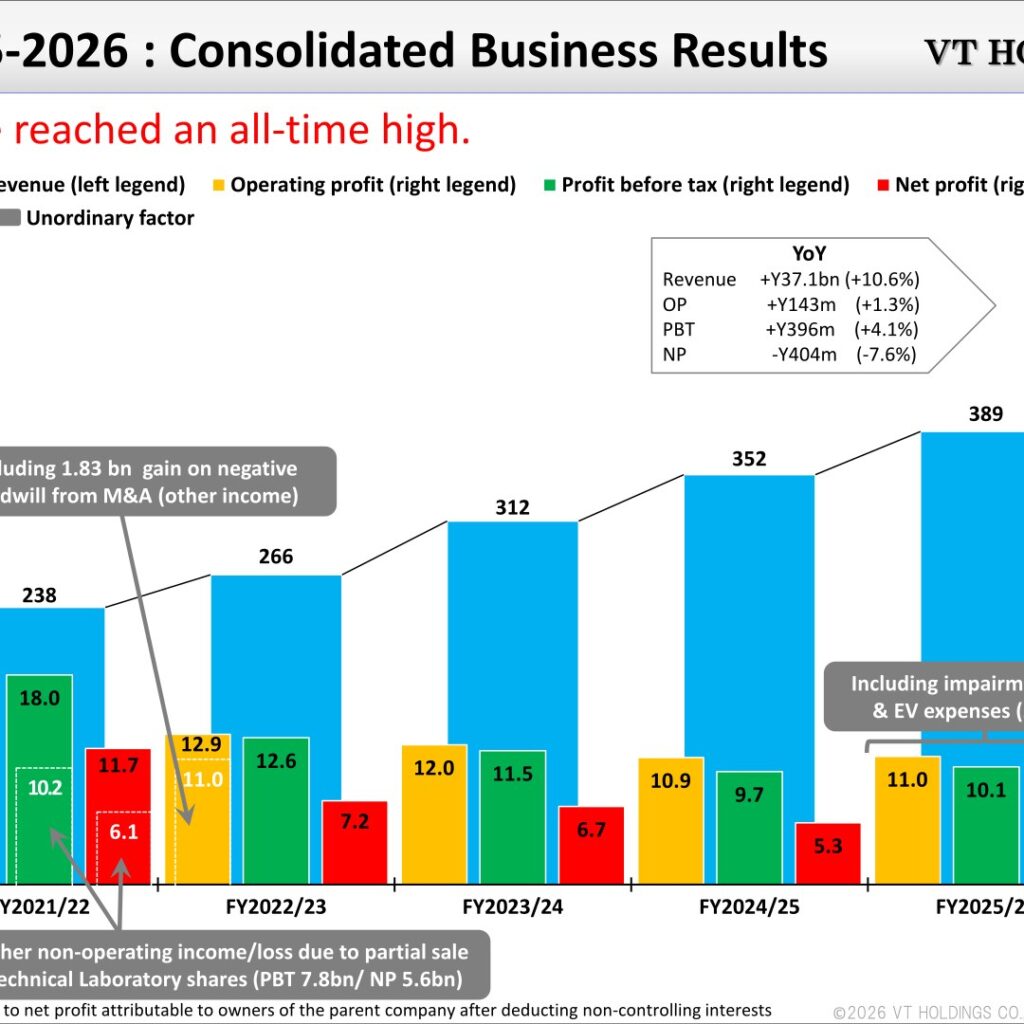
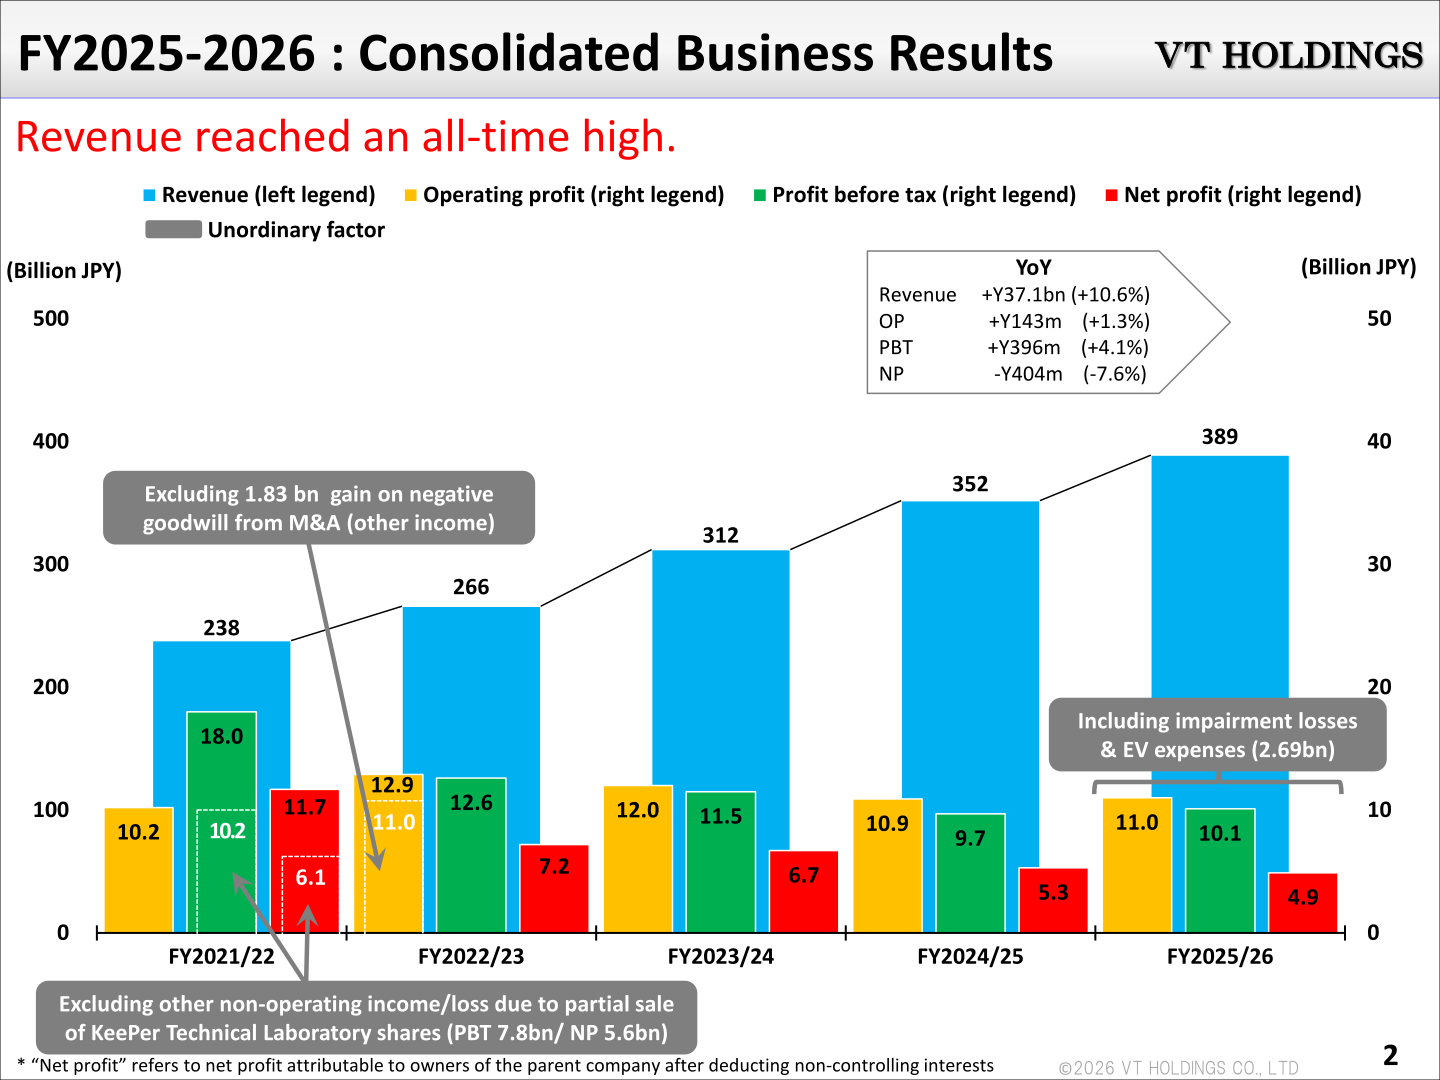
VT HOLDINGS CO., LTD. (7593), an automobile sales group that also runs a housing-related business, posted revenue of 388.7 billion yen for the fiscal year ended March 31, 2026, up 10.6% year on year and an all-time high. Operating profit rose 1.3% to 11.0 billion yen and profit before tax rose 4.1% to 10.1 billion yen, while net profit fell 7.6% to 4.9 billion yen. The presentation attributes the profit decline to impairment losses on fixed assets at unprofitable stores and goodwill impairment losses in the Automobile Sales-Related Business, together with research and development expenses recognized for the development of Caterham’s new EV model. For the fiscal year ending March 31, 2027 the company forecasts revenue of 400.0 billion yen and operating profit of 13.5 billion yen, both of which it expects to be record highs. Note: the source presentation labels this fiscal year “FY2025/26” (the fiscal year ended March 31, 2026); this article classifies it as FY2025 in line with site convention, and body text, tables and segment labels follow the presentation. The company reports under IFRS, and “Net profit” refers to net profit attributable to owners of the parent company after deducting non-controlling interests.
Consolidated Results (Full-Year Actual)
Revenue reached an all-time high. In the Automobile Sales-Related Business, overseas new car sales, primarily in Spain, performed strongly, while used car sales as well as the Service and Car Rental segments also performed well, driving revenue growth. In the Housing-Related Business, as land for properties in prime locations was steadily secured, detached housing sales remained solid, and the custom construction segment continued to receive stable orders for commercial facility projects. Operating profit and profit before tax increased, while net profit declined; the presentation notes that FY2025/26 operating profit of 11.0 billion yen includes impairment losses and EV expenses of 2.69 billion yen.
| Item (Billion JPY) | FY2025/26 | FY2024/25 | YoY |
|---|---|---|---|
| Revenue | 388.7 | 351.6 | +Y37.1bn (+10.6%) |
| Operating profit | 11.0 | 10.9 | +Y143m (+1.3%) |
| Profit before tax | 10.1 | 9.7 | +Y396m (+4.1%) |
| Net profit | 4.9 | 5.3 | -Y404m (-7.6%) |
Segment Results
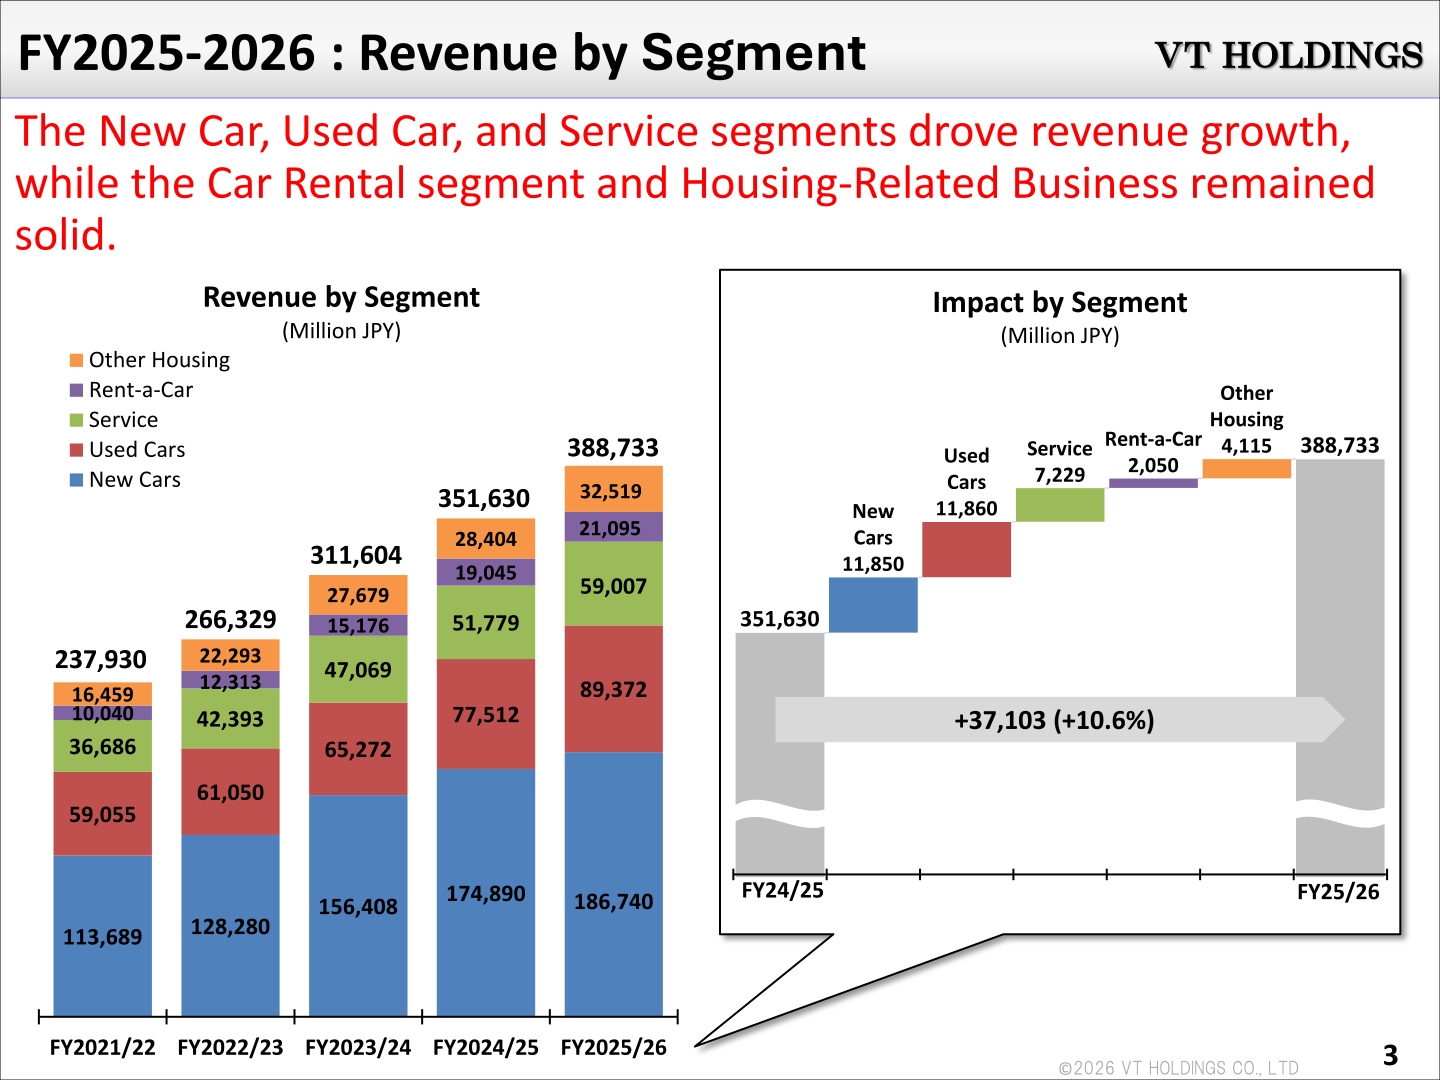
The New Car, Used Car and Service segments drove revenue growth, while the Car Rental segment and the Housing-Related Business remained solid. Consolidated revenue increased 37,103 million yen (+10.6%), with New Cars contributing 11,850 million yen, Used Cars 11,860 million yen, Service 7,229 million yen, Rent-a-Car 2,050 million yen and Other/Housing 4,115 million yen. Gross profit rose 6,614 million yen (+12.4%), led by the Used Car and Service segments; the presentation states that overall profit growth has continued for six years since FY2021. Figures below are in millions of yen.
| Segment | Revenue FY2025/26 | Revenue FY2024/25 | Gross profit FY2025/26 | Gross profit FY2024/25 |
|---|---|---|---|---|
| New Cars | 186,740 | 174,890 | 15,614 | 14,331 |
| Used Cars | 89,372 | 77,512 | 13,169 | 11,150 |
| Service | 59,007 | 51,779 | 19,450 | 17,299 |
| Rent-a-Car | 21,095 | 19,045 | 6,390 | 6,205 |
| Other / Housing | 32,519 | 28,404 | 5,368 | 4,393 |
| Total | 388,733 | 351,630 | 59,992 | 53,378 |
Revenue by Region and Vehicle Unit Sales
Both domestic and overseas sales grew steadily, and the overseas sales ratio remained on an upward trend. Domestic revenue was 202,714 million yen (+7.8%) and overseas revenue was 186,019 million yen (+13.7%), taking the overseas revenue ratio to 47.9% from 46.5% a year earlier. By region, the revenue composition was Japan 52.1%, Europe 42.3%, Africa 3.8%, Oceania 1.2%, Asia 0.4% and the Americas 0.1%; revenues are classified based on the location of the sale destination. Total vehicles sold rose 2.1% year on year to 100,187 units. New car sales were 51,078 units, up 213 units (+0.4%), as an increase of 1,946 units overseas offset a decrease of 1,733 units in Japan. Used car sales were 49,109 units, up 1,820 units (+3.8%), with domestic up 2,467 units and overseas up 1,836 units against a decline of 2,483 units in exports.
Financial Position and Cash Flow
Total assets increased by 25.2 billion yen from the previous fiscal year-end to 303.1 billion yen, reflecting an increase in vehicle inventories to support higher sales, capital expenditures for store construction, and increases in fixed assets due to the acquisition of rental cars. Current assets rose 21.5 billion yen (+17.1%), including inventories up 15.8 billion yen, while current liabilities rose 24.5 billion yen (+18.4%). Equity decreased 2.5 billion yen (-3.1%). Net interest-bearing debt rose to 130.1 billion yen and the net D/E ratio rose to 1.8 times from 1.5 times, while the current ratio (93.4%) and fixed long-term ratio (112.9%) remained stable. Operating cash flow totaled 18.8 billion yen and free cash flow totaled 8.0 billion yen.
FY2026-2027 Forecast
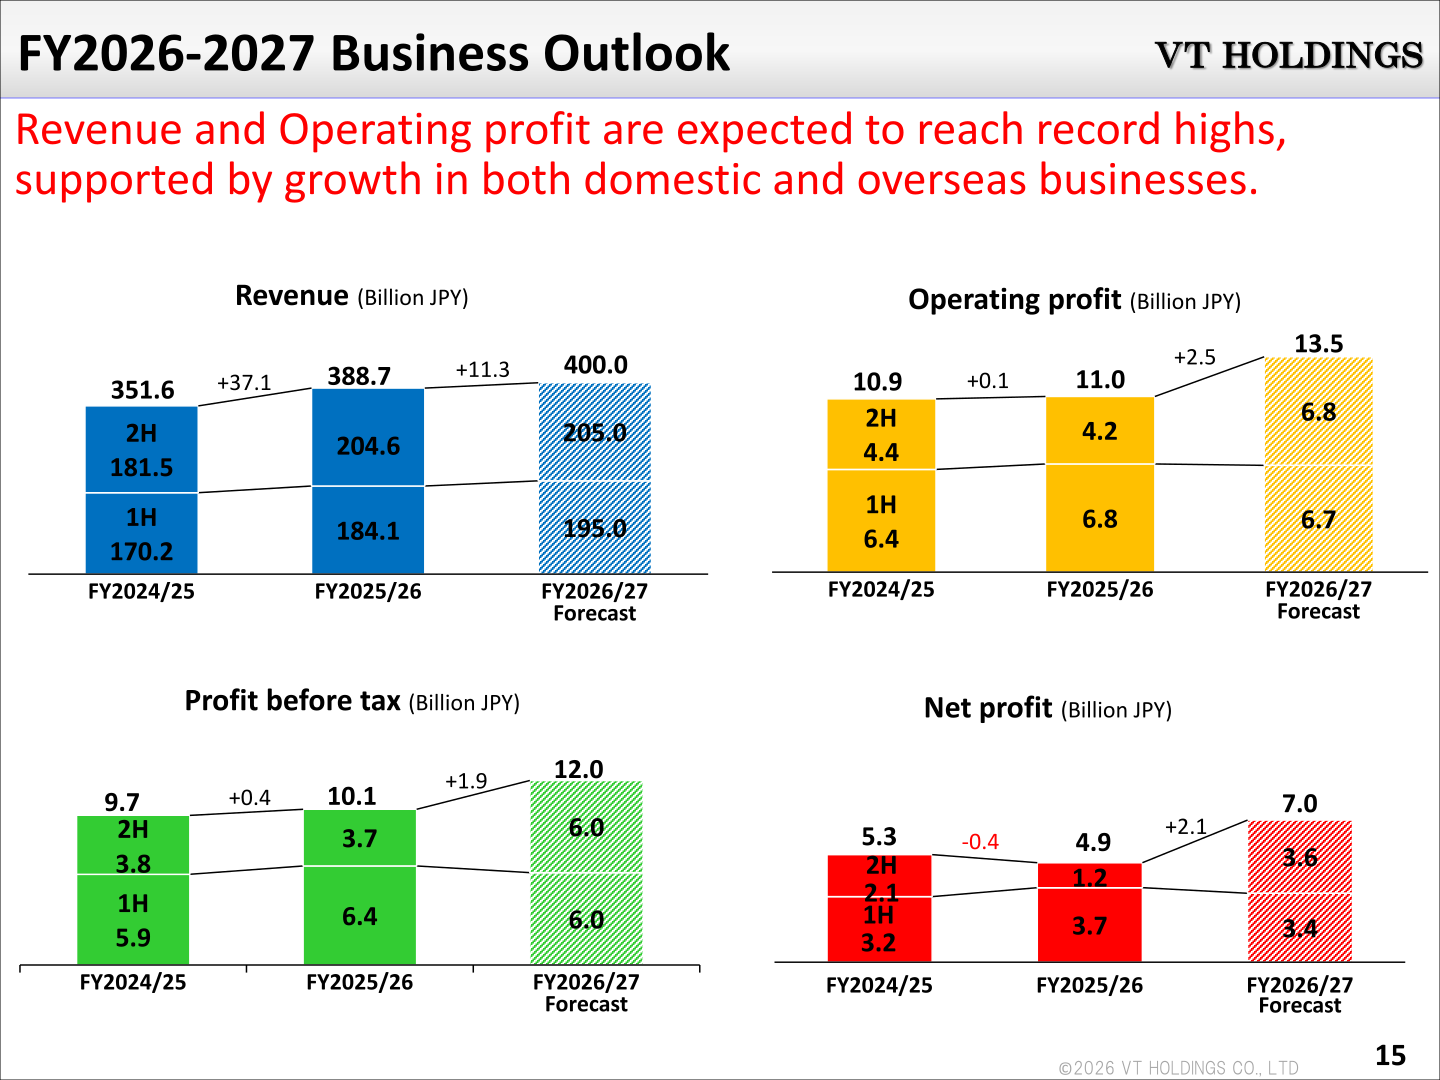
Revenue and operating profit are expected to reach record highs, supported by growth in both domestic and overseas businesses. The company assumes exchange rates for the fiscal year ending March 2027 of ¥183/EUR, ¥160/US$, ¥211/GBP, ¥110/AUD and ¥9.3/ZAR, against period-average rates for the fiscal year ended March 2026 of ¥174.79/EUR, ¥150.78/US$, ¥202.10/GBP, ¥99.81/AUD and ¥8.72/ZAR. Assuming the euro is 1 yen weaker than the assumed rate, the impact on consolidated earnings is +109.6 million yen on revenue and +9 million yen on operating profit.
| Item (Billion JPY) | FY2026/27 Forecast | FY2025/26 Actual | Change |
|---|---|---|---|
| Revenue | 400.0 | 388.7 | +11.3 |
| Operating profit | 13.5 | 11.0 | +2.5 |
| Profit before tax | 12.0 | 10.1 | +1.9 |
| Net profit | 7.0 | 4.9 | +2.1 |
Shareholder Returns
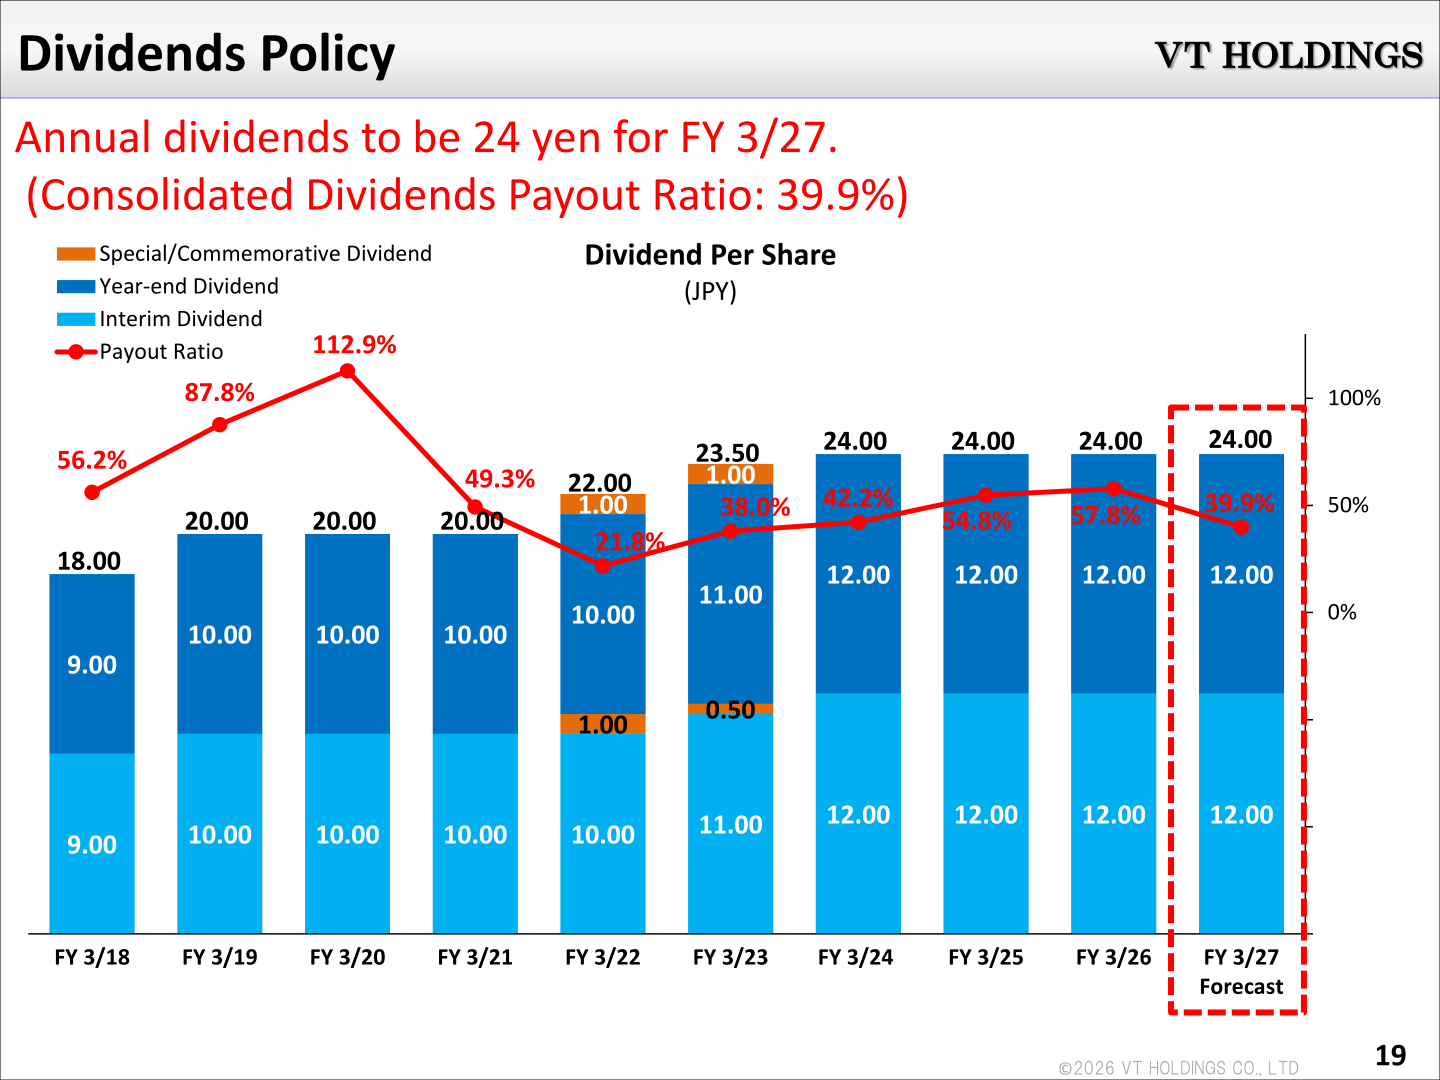
The annual dividend per share for FY 3/26 was 24.00 yen, comprising an interim dividend of 12.00 yen and a year-end dividend of 12.00 yen, unchanged from the previous three fiscal years. The consolidated payout ratio was 57.8% and DOE was 3.9%. For FY 3/27 the company plans annual dividends of 24 yen, which it states corresponds to a consolidated dividend payout ratio of 39.9%.
Capital-Cost-Conscious Management Targets
The presentation reports progress on the numerical targets related to management focused on capital costs and stock prices that were disclosed on October 28, 2024. Operating profit and the payout ratio improved year on year, while ROE, the operating profit margin, the equity-to-asset ratio, the net D/E ratio and DOE moved away from their targets.
| Item | Actual FY 3/25 | Actual FY 3/26 | Target FY 3/28 |
|---|---|---|---|
| ROE | 7.4% | 6.9% | 12% or more |
| Operating profit (Million JPY) | 10,859 | 11,003 | 20,000 |
| Operating profit margin | 3.1% | 2.8% | 5.0% or more |
| Equity-to-asset ratio | 25.6% | 23.3% | 30~40% |
| Net D/E ratio (times) | 1.5 | 1.8 | 1.0 or less |
| Payout ratio | 54.8% | 57.8% | 40% or more |
| DOE | 4.1% | 3.9% | 4.0% or more |
Topics
The company is moving to a new management framework on June 25, 2026, reducing the board from 14 to 12 directors, lowering the average age from 62.1 years to 59.6 years and raising the ratio of independent outside directors from 43% to 50%. Under the new structure Takuya Yamazaki is listed as President & CEO, Representative Director and Kazuho Takahashi as Executive Advisor, Director.
On April 1, 2026 the company acquired 100% of the shares of NISSAN PRINCE YAMANASHI CO., LTD., a Nissan dealer founded in April 1969 with 10 new car and 1 used car dealerships in Yamanashi Prefecture. In the Caterham business, the latest prototype of “Project V,” a next-generation EV sports coupe, was unveiled globally for the first time at Tokyo Auto Salon 2026 in January 2026, with development toward mass production currently underway. As of March 31, 2026 the group comprised 59 consolidated subsidiaries and 3 equity method affiliates with 5,574 consolidated employees including 1,047 temporary staff, and as of April 1, 2026 it operated 261 dealerships (227 new car and 34 used car), of which 195 were in Japan and 66 overseas.
This article is an analysis based on publicly available information and is not a recommendation to buy or sell any specific securities. Investment decisions are your own responsibility.
















