
This article is based on publicly available IR materials and is not a recommendation to buy or sell any specific securities.
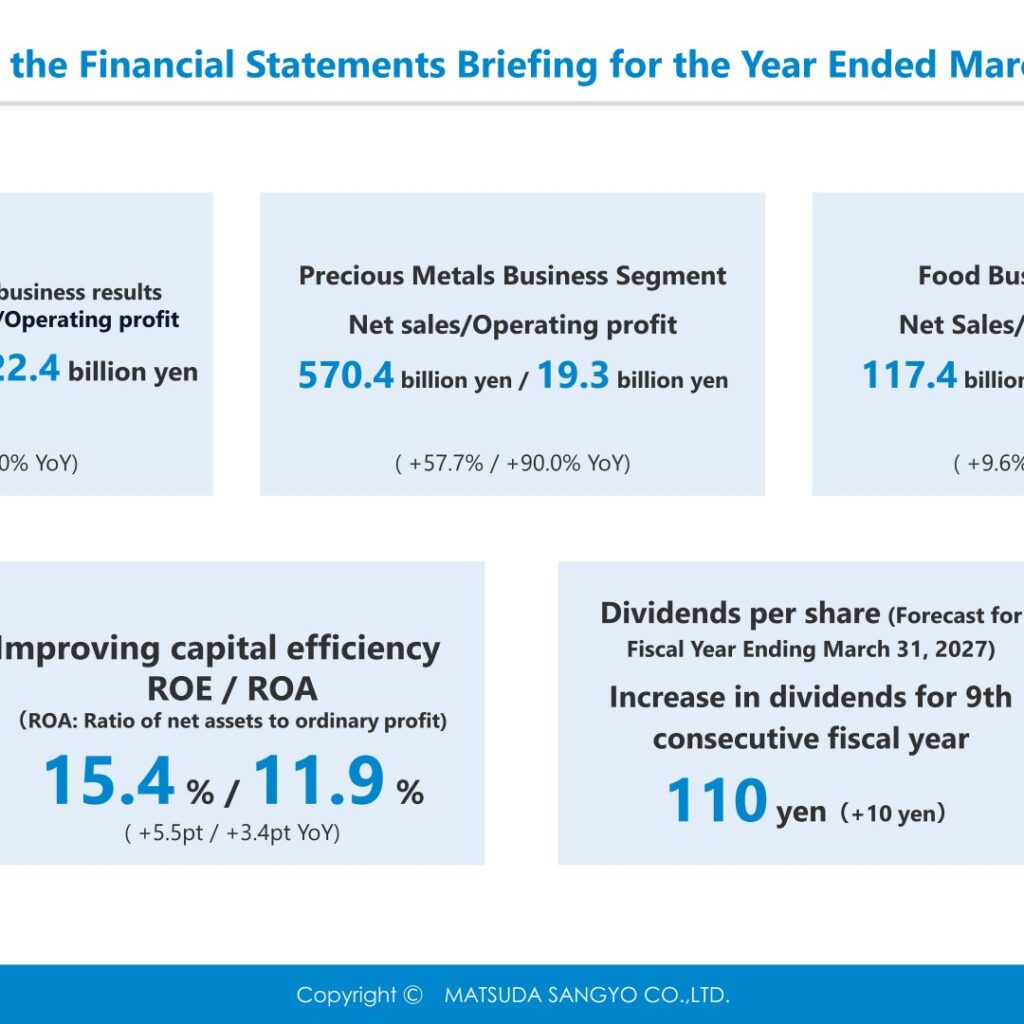
Note: the company labels the year ended March 31, 2026 as “FY3/26” (and as “FY25” in its medium-term plan sections); this site classifies it as FY2025, and the tables below keep the company’s own labels. Matsuda Sangyo Co., Ltd. reported record-high business results for the fiscal year ended March 31, 2026, with consolidated net sales of 687.8 billion yen (+46.7% year on year) and operating profit of 22.4 billion yen (+77.0%). Both the Precious Metals Business Segment and the Food Business Segment showed strong performance, and the company describes the increase in sales and profits as significant compared with the previous period, driven by price increases and improvements in operating profit margins. ROE was 15.4% and ROA (ratio of net assets to ordinary profit) was 11.9%. For the fiscal year ending March 31, 2027 the company forecasts net sales of 700.0 billion yen and operating profit of 24.0 billion yen, and plans a dividend of 110 yen per share, an increase for the 9th consecutive fiscal year.
Consolidated Results (Full-Year Actual)
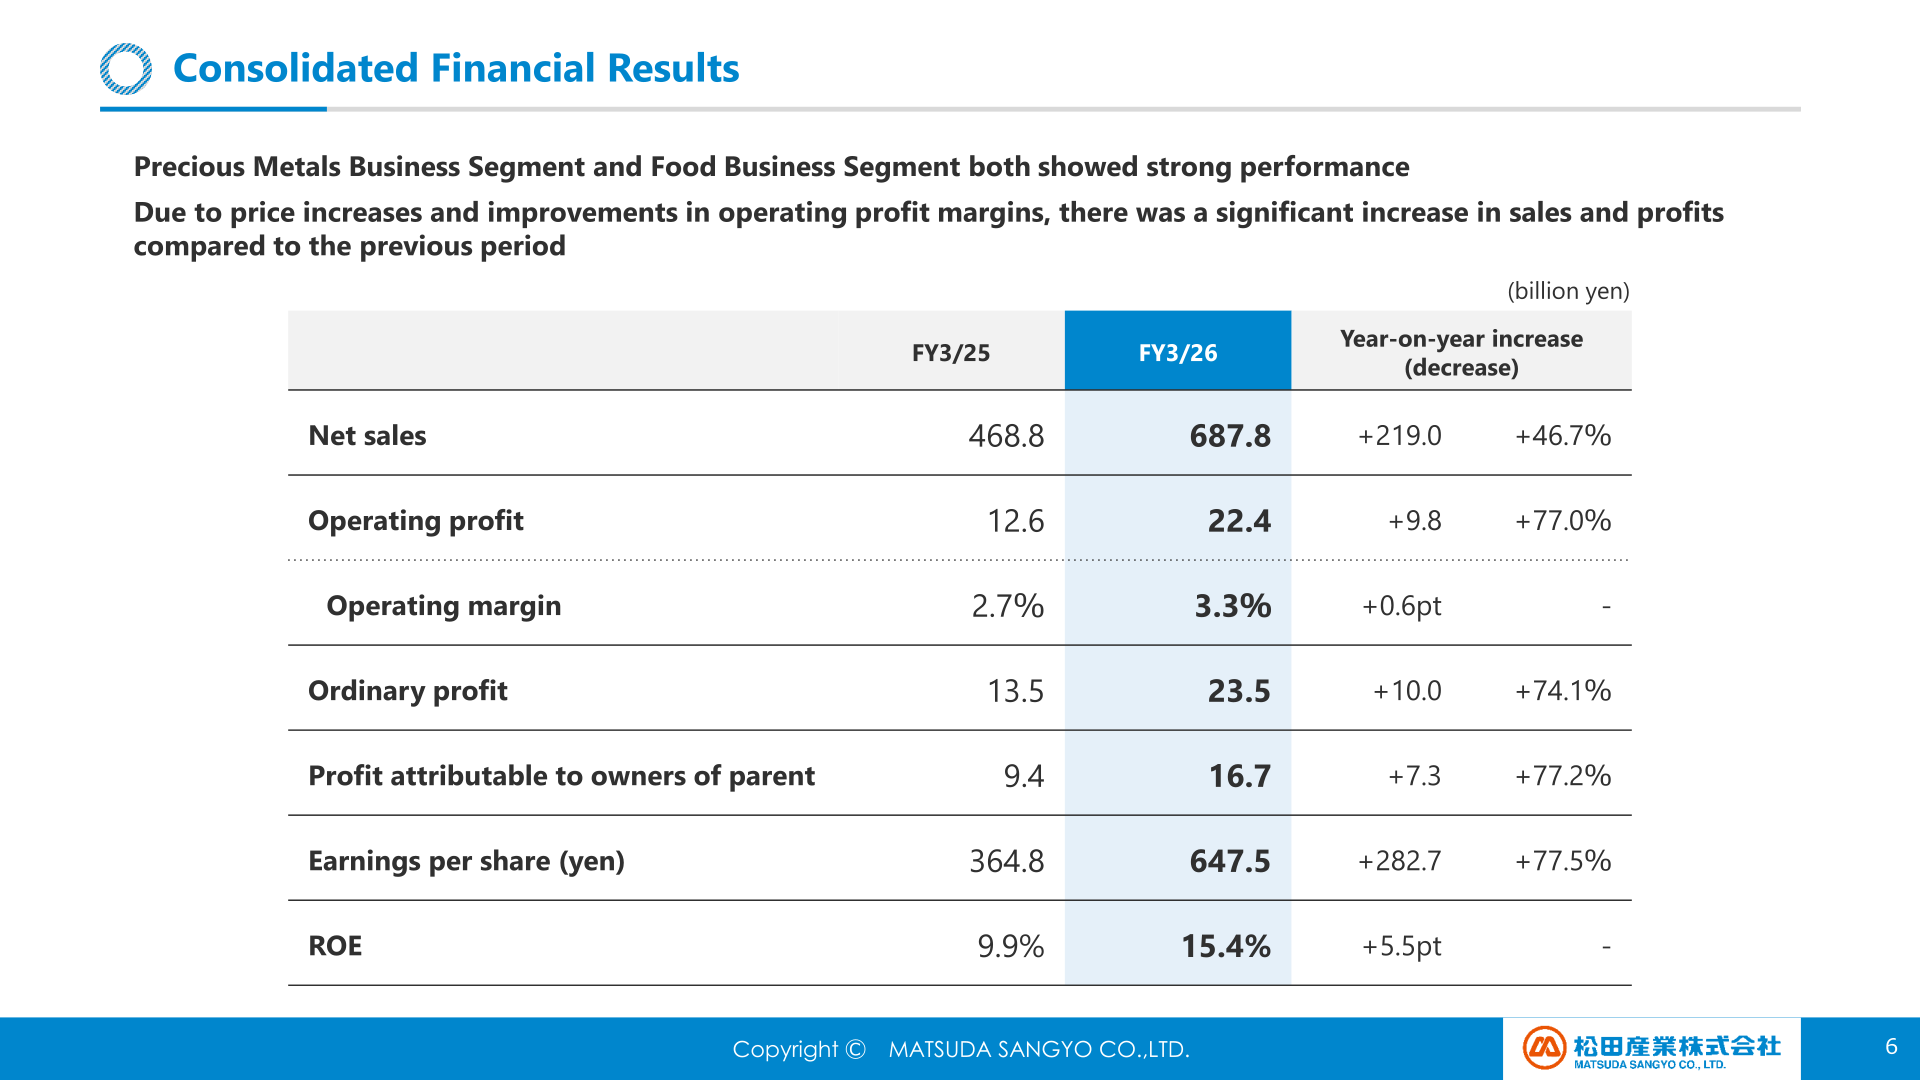
The materials state that the Precious Metals Business Segment and the Food Business Segment both showed strong performance, and that due to price increases and improvements in operating profit margins there was a significant increase in sales and profits compared to the previous period. Net sales rose 219.0 billion yen to 687.8 billion yen, operating profit rose 9.8 billion yen to 22.4 billion yen, and profit attributable to owners of parent rose 7.3 billion yen to 16.7 billion yen. The operating margin improved 0.6pt to 3.3% and ROE improved 5.5pt to 15.4%. On a three-year view the materials show net sales of 360.5 billion yen (FY3/24), 468.8 billion yen (FY3/25) and 687.8 billion yen (FY3/26), with operating profit of 9.3, 12.6 and 22.4 billion yen and profit attributable to owners of parent of 7.2, 9.4 and 16.7 billion yen over the same three years.
| Item (billion yen) | FY3/25 | FY3/26 | Year-on-year increase (decrease) |
|---|---|---|---|
| Net sales | 468.8 | 687.8 | +219.0 (+46.7%) |
| Operating profit | 12.6 | 22.4 | +9.8 (+77.0%) |
| Operating margin | 2.7% | 3.3% | +0.6pt |
| Ordinary profit | 13.5 | 23.5 | +10.0 (+74.1%) |
| Profit attributable to owners of parent | 9.4 | 16.7 | +7.3 (+77.2%) |
| Earnings per share (yen) | 364.8 | 647.5 | +282.7 (+77.5%) |
| ROE | 9.9% | 15.4% | +5.5pt |
Balance Sheet and Cash Flows
Total assets increased 58.5 billion yen to 227.7 billion yen as of March 31, 2026, with current assets up 54.6 billion yen to 170.7 billion yen on an increase in notes and accounts receivable-trade and inventories, and non-current assets up 3.9 billion yen to 57.0 billion yen on new installation of factory equipment. Total liabilities increased 39.6 billion yen to 108.7 billion yen, and interest-bearing debt rose 19.1 billion yen to 52.4 billion yen. Total net assets increased 18.9 billion yen to 119.0 billion yen on higher retained earnings and deferred gains or losses on hedges, and the shareholders’ equity ratio was 52.0%, versus 58.9% a year earlier. The materials note that the Company finalized the provisional accounting treatment for business combinations during the fiscal year under review, and that figures for the fiscal year ended March 31, 2025 reflect that finalization. Cash flows from operating activities were (8.9) billion yen versus 2.5 billion yen in the prior year, reflecting a decrease in cash from an increase in accounts receivable-trade and inventories and income taxes paid; cash flows from investing activities were (4.4) billion yen, free cash flows were (13.4) billion yen, and cash flows from financing activities were 16.2 billion yen. Cash and cash equivalents at end of period were 14.5 billion yen.
Segment Results
The Precious Metals Business Segment achieved increased sales and profit due to higher precious metals recycling volume and rising precious metals prices, with net sales of 570.4 billion yen (+57.7%) and operating profit of 19.3 billion yen (+90.0%); the operating margin was 3.4% versus 2.8%. The Food Business Segment achieved increased sales and profit due to its response to changing customer needs and efforts to build a stable supply system, with net sales of 117.4 billion yen (+9.6%) and operating profit of 3.1 billion yen (+23.9%); the operating margin was 2.6%, up 0.3pt. The materials attribute the change in Precious Metals operating profit to a quantity factor of +6.2 billion yen and an improvement in profit margin (including market impact) of +6.4 billion yen, against an increase in production costs and SG&A expenses of (3.4) billion yen; for the Food segment the corresponding factors were +0.4 billion yen, +0.7 billion yen and (0.5) billion yen.
| Segment | Metric (billion yen) | FY3/25 | FY3/26 | Change |
|---|---|---|---|---|
| Precious Metals Business Segment | Net sales | 361.6 | 570.4 | +208.8 (+57.7%) |
| Precious Metals Business Segment | Operating profit | 10.1 | 19.3 | +9.2 (+90.0%) |
| Precious Metals Business Segment | Operating margin | 2.8% | 3.4% | – |
| Food Business Segment | Net sales | 107.2 | 117.4 | +10.2 (+9.6%) |
| Food Business Segment | Operating profit | 2.5 | 3.1 | +0.6 (+23.9%) |
| Food Business Segment | Operating margin | 2.3% | 2.6% | +0.3pt |
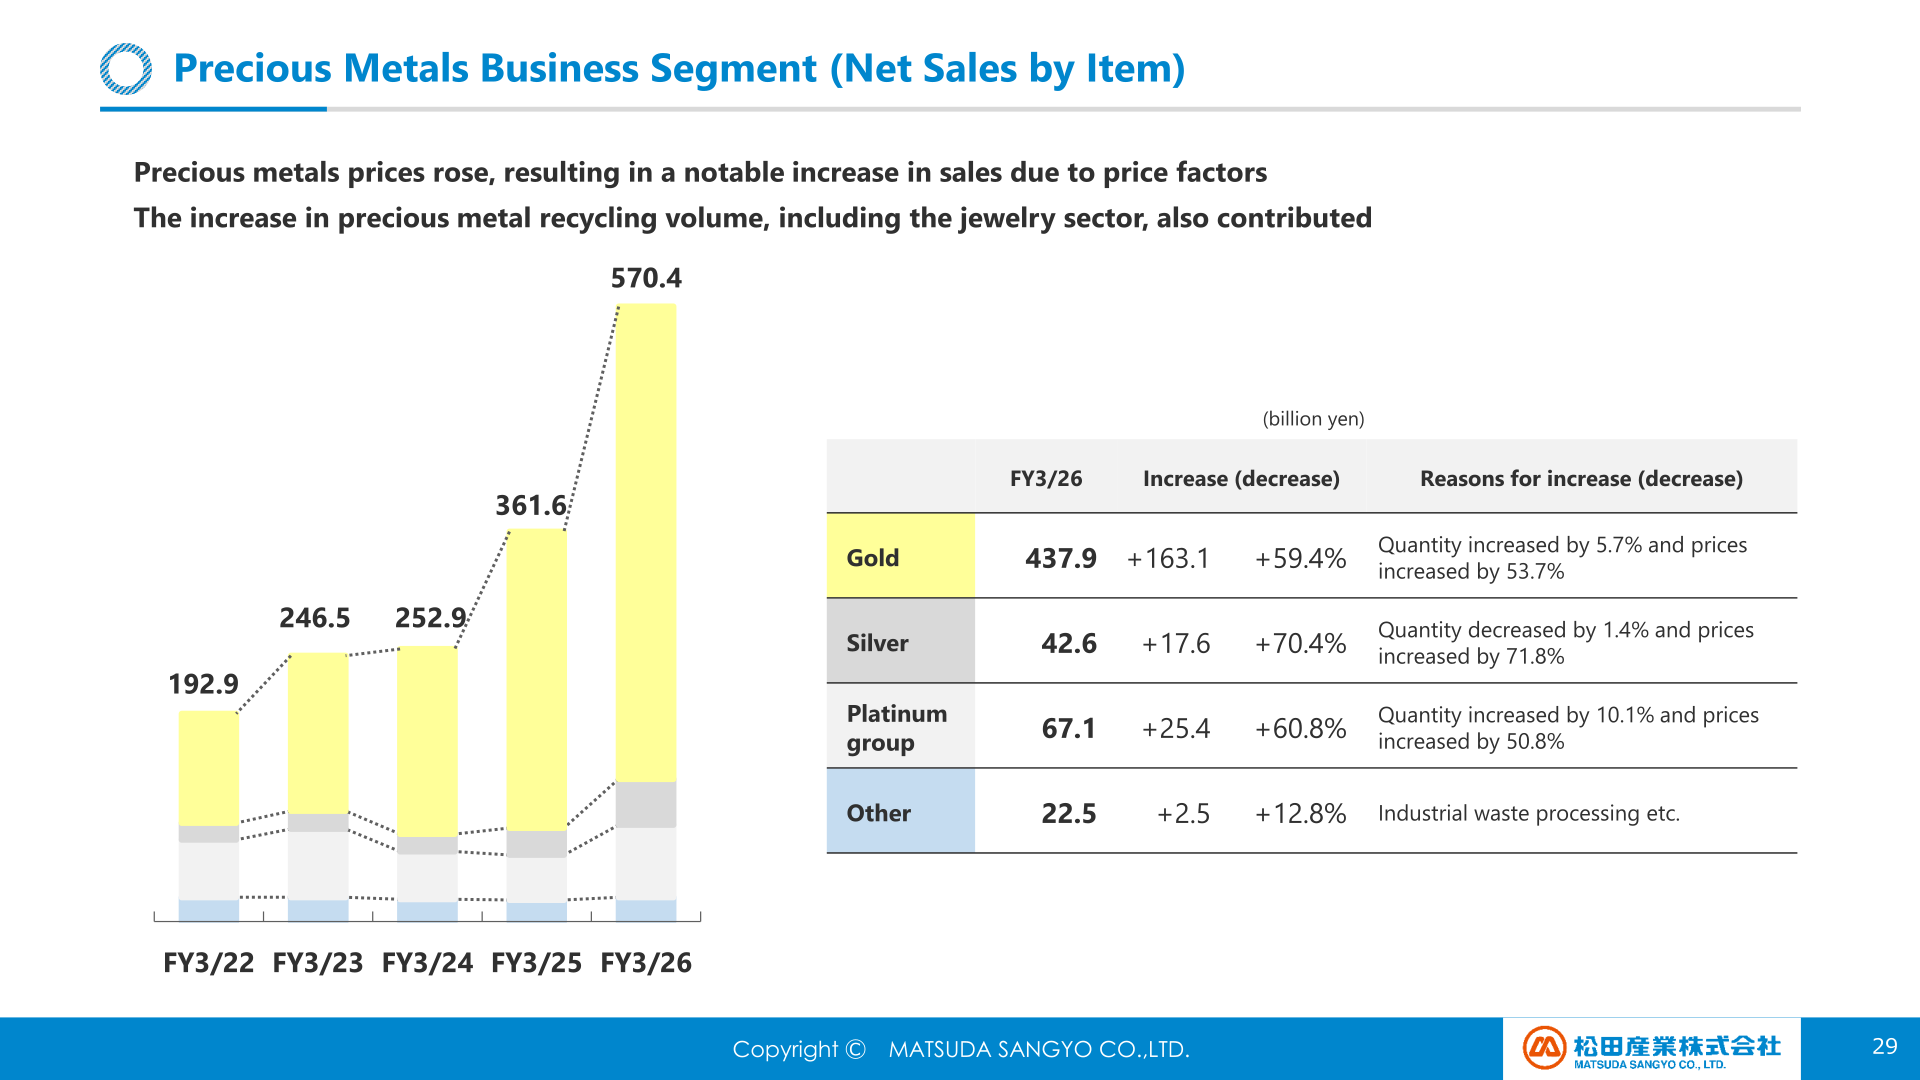
By item, precious metals prices rose, resulting in a notable increase in sales due to price factors, while the increase in precious metal recycling volume, including the jewelry sector, also contributed. In the Food Business Segment, increased sales volumes of marine products, livestock products and agricultural products, along with price pass-throughs to absorb higher raw material prices, contributed to higher sales across all product categories.
| Segment | Item | FY3/26 net sales (billion yen) | Increase (decrease) | Reasons for increase (decrease) |
|---|---|---|---|---|
| Precious Metals | Gold | 437.9 | +163.1 (+59.4%) | Quantity increased by 5.7% and prices increased by 53.7% |
| Precious Metals | Silver | 42.6 | +17.6 (+70.4%) | Quantity decreased by 1.4% and prices increased by 71.8% |
| Precious Metals | Platinum group | 67.1 | +25.4 (+60.8%) | Quantity increased by 10.1% and prices increased by 50.8% |
| Precious Metals | Other | 22.5 | +2.5 (+12.8%) | Industrial waste processing etc. |
| Food | Marine products | 47.4 | +4.0 (+9.2%) | Quantity increased by 1.6% and prices increased by 7.6% |
| Food | Livestock products | 46.8 | +3.9 (+9.2%) | Quantity increased by 3.1% and prices increased by 6.2% |
| Food | Agricultural products | 14.3 | +0.7 (+5.8%) | Quantity increased by 4.0% and prices increased by 1.8% |
| Food | Other | 8.7 | +1.4 (+20.5%) | – |
FY3/27 Forecast
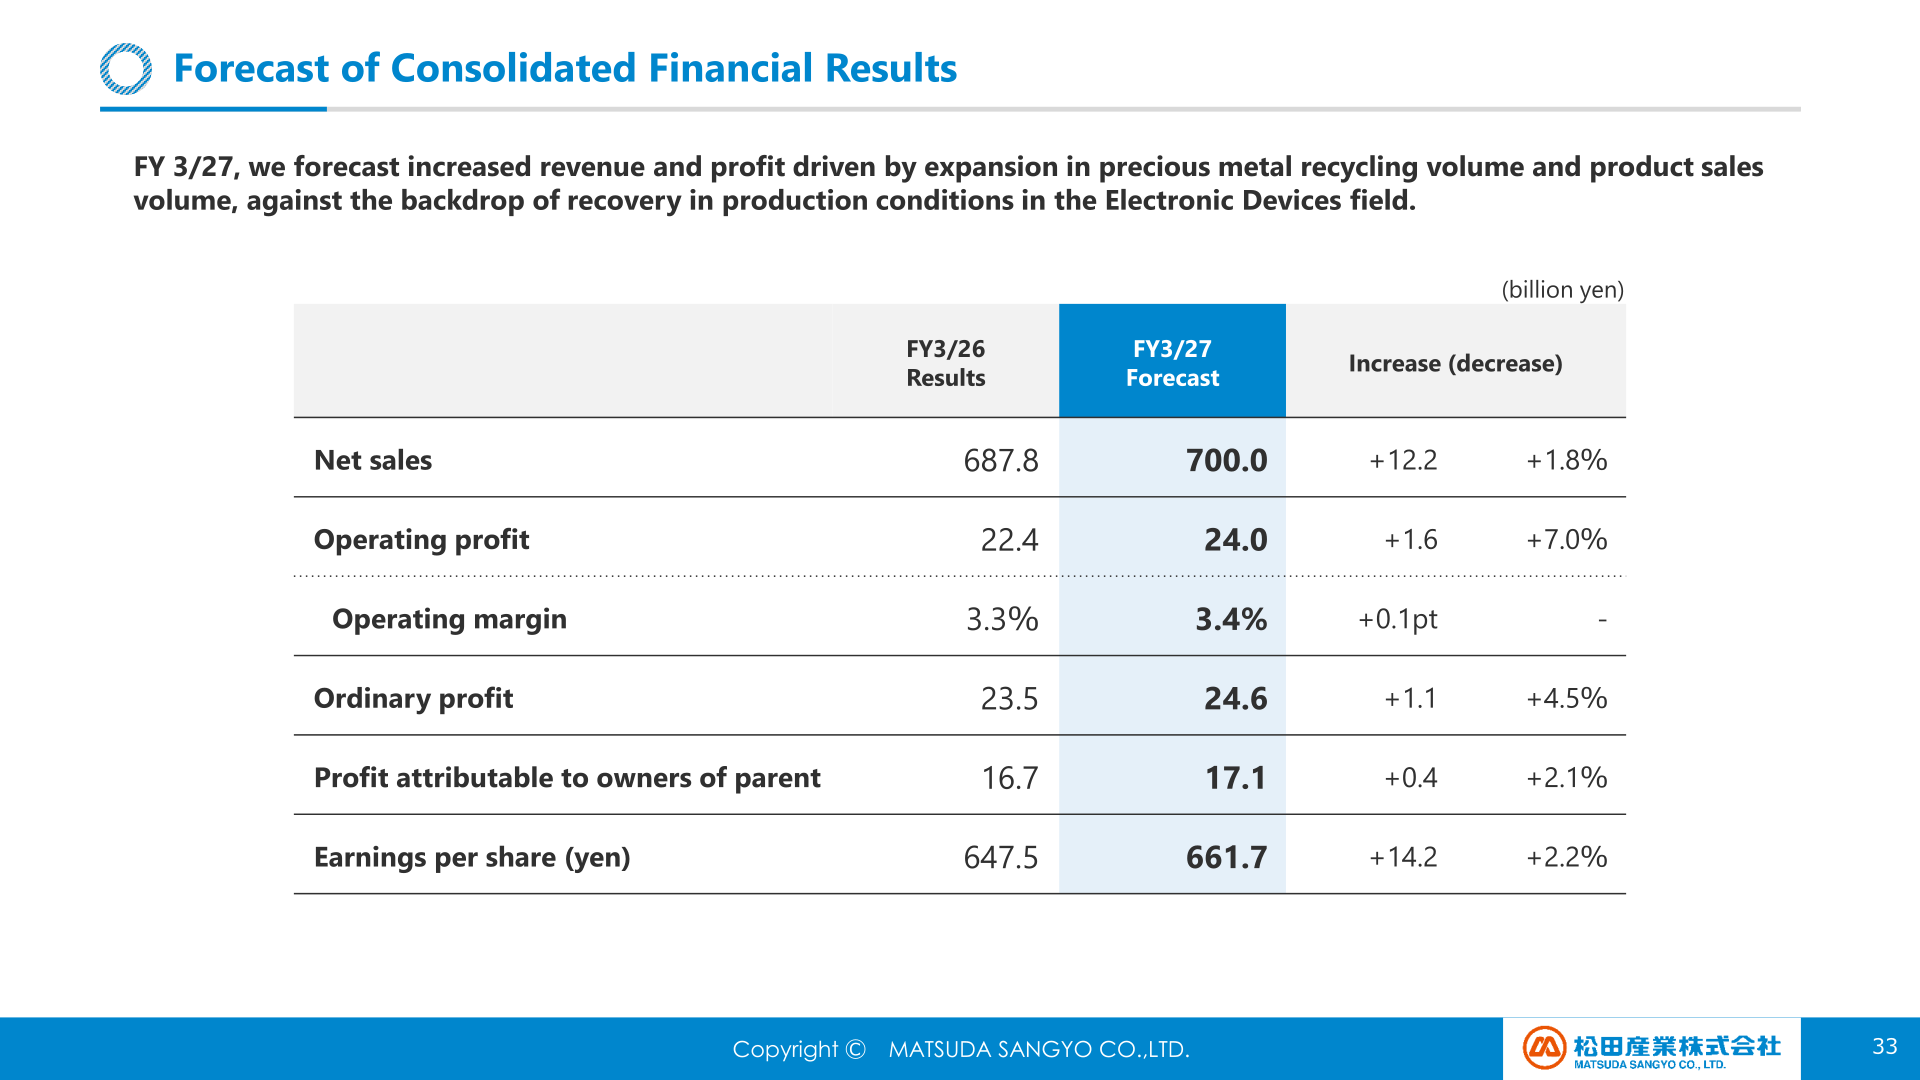
For FY3/27 the company forecasts increased revenue and profit driven by expansion in precious metal recycling volume and product sales volume, against the backdrop of recovery in production conditions in the Electronic Devices field. In the Precious Metals Business Segment, both net sales and operating profit are expected to increase due to an increase in precious metals recycling volume and the recovery outlook for demand in the electronic devices sector. In the Food Business Segment, operating profit is expected to remain flat due to an increase in SG&A expenses, despite an increase in net sales from higher sales volume. Precious metals market prices are assumed to be on par with the average for FY3/26 (Gold: 24,000yen/g, Silver: 400yen/g), and the plan assumes capital investment of approximately 7.3 billion yen and depreciation of approximately 4.0 billion yen.
| Item (billion yen) | FY3/26 Results | FY3/27 Forecast | Increase (decrease) |
|---|---|---|---|
| Net sales | 687.8 | 700.0 | +12.2 (+1.8%) |
| Operating profit | 22.4 | 24.0 | +1.6 (+7.0%) |
| Operating margin | 3.3% | 3.4% | +0.1pt |
| Ordinary profit | 23.5 | 24.6 | +1.1 (+4.5%) |
| Profit attributable to owners of parent | 16.7 | 17.1 | +0.4 (+2.1%) |
| Earnings per share (yen) | 647.5 | 661.7 | +14.2 (+2.2%) |
| Net sales: Precious Metals Business Segment | 570.4 | 580.0 | +9.6 (+1.7%) |
| Net sales: Food Business Segment | 117.4 | 120.0 | +2.6 (+2.2%) |
| Operating profit: Precious Metals Business Segment | 19.3 | 20.9 | +1.6 (+8.1%) |
| Operating profit: Food Business Segment | 3.1 | 3.1 | +0.0 (+0.2%) |
Shareholder Returns
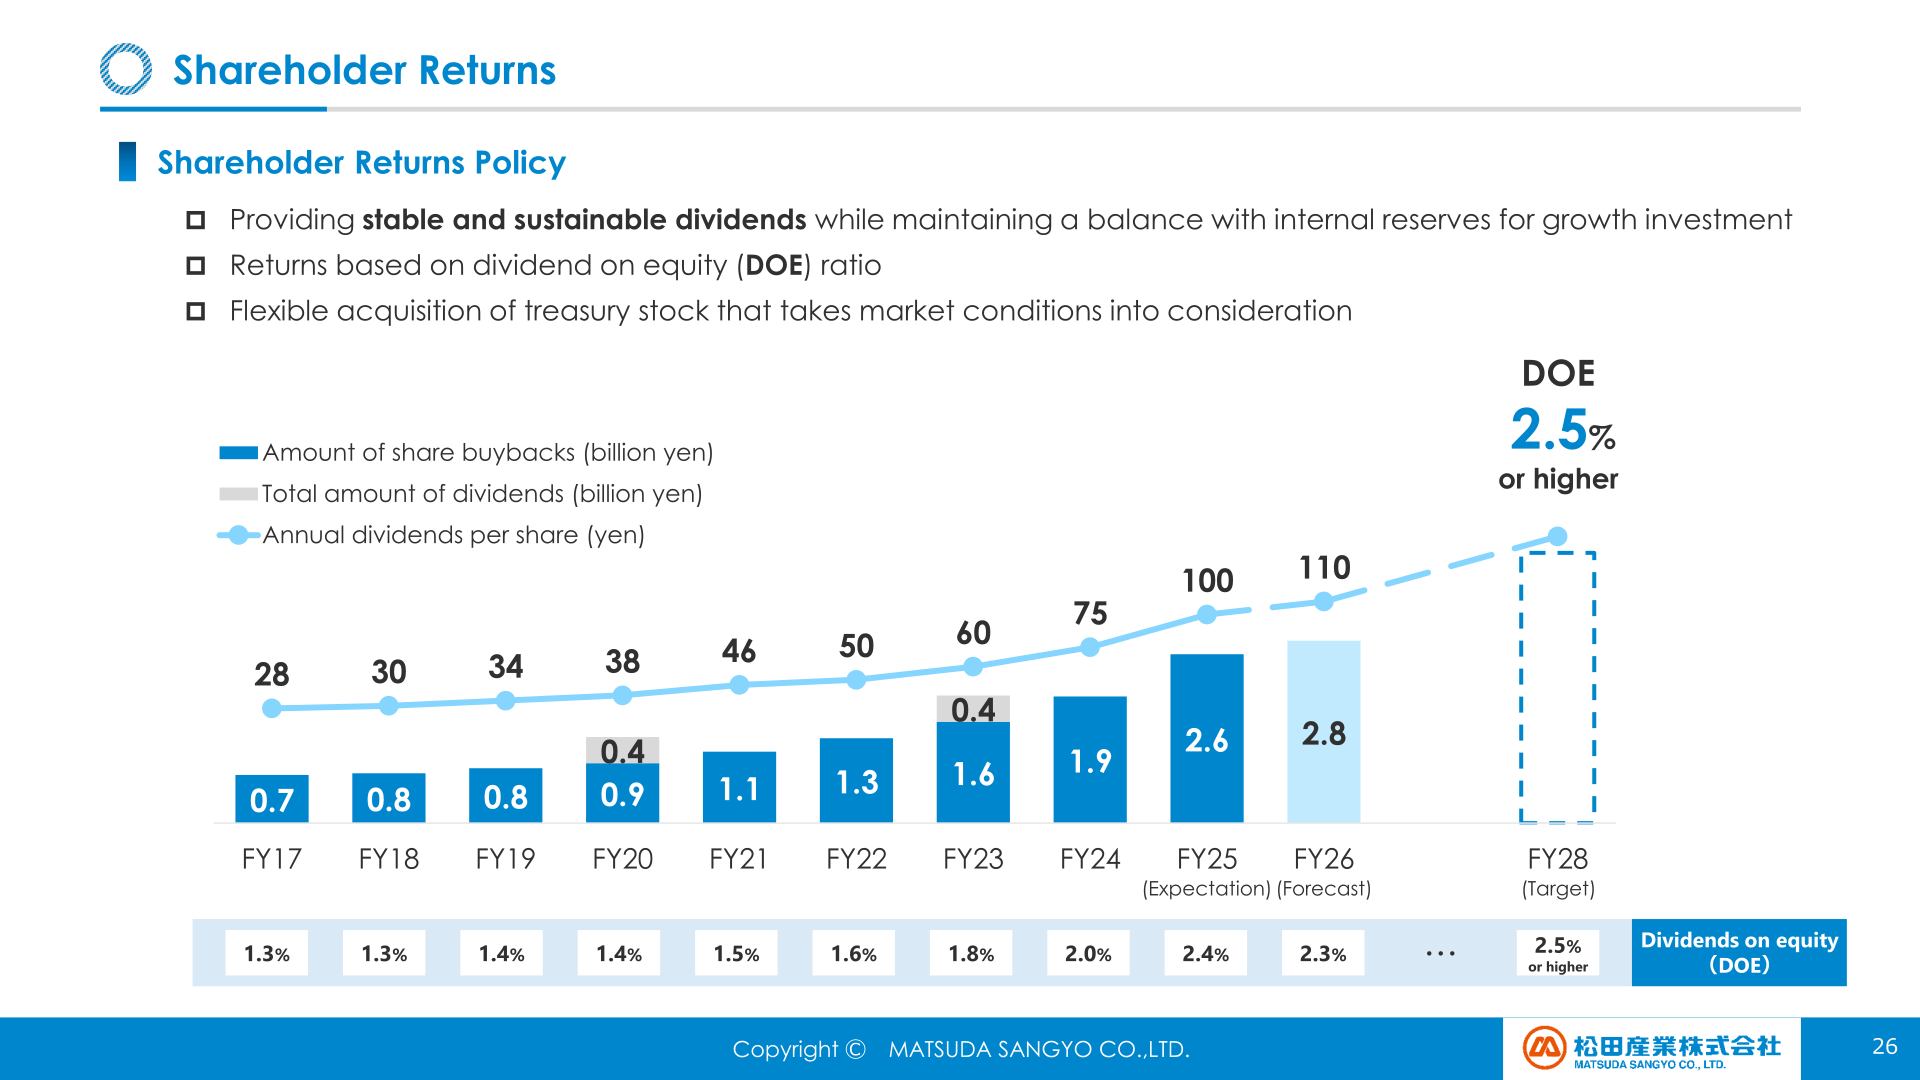
The shareholder returns policy is to provide stable and sustainable dividends while maintaining a balance with internal reserves for growth investment, to base returns on the dividend on equity (DOE) ratio, and to conduct flexible acquisition of treasury stock that takes market conditions into consideration. The materials show annual dividends per share rising from 28 yen in FY17 to 100 yen in FY25, with 110 yen forecast for the fiscal year ending March 31, 2027 (+10 yen), an increase in dividends for the 9th consecutive fiscal year. DOE was 2.3% in FY25 and the target under the medium-term plan is 2.5% or higher.
Medium-term Management Plan 2028 (FY2026 – 2028)
Looking back at the previous medium-term plan, net sales of 687.8 billion yen and operating profit of 22.4 billion yen far exceeded the FY25 targets of 300.0 billion yen and 13.0 billion yen, and ROE of 15.4% and ROA of 11.9% exceeded the targets of 9.0% and 10.0%. The operating margin of 3.3% was below the 4.3% target, and cumulative FY22-25 operating cash flow of 6.0 billion yen fell well short of the 40.0 billion yen target because of an increase in working capital associated with high precious metal market prices.
Under Medium-term Management Plan 2028, the FY28 targets are operating profit of 28.0 billion yen, three-year cumulative operating cash flow of 35.0 billion yen, ROE of 11.0% or higher and ROA of 10.0% or higher; the precious metal price assumption is approximately the FY25 Q4 average (Jan–Mar 2026). Segment profit targets for FY28 are 24.5 billion yen for the Precious Metals Business Segment and 3.5 billion yen for the Food Business Segment, with the Food segment’s average operating margin targeted at 2.5% for FY26-28 versus 2.2% for FY22-25. Cash allocation for the cumulative FY2026 – 2028 period assumes cash flow from operating activities of approximately 35 billion yen, business investment of approximately 18 billion yen, regular capital investments of approximately 13 billion yen and shareholder returns of approximately 10–12 billion yen.
The company also reports that it was included in CDP’s “A List 2025” for the second consecutive year for transparency in combating climate change, and that it is promoting initiatives to achieve carbon neutrality by fiscal year 2050. Non-financial targets under its materiality framework include a 42% reduction in GHG emissions (Scope1+2), a 25% reduction in GHG emissions (Scope3) and a recycling rate of 90% or higher.
This article is an analysis based on publicly available information and is not a recommendation to buy or sell any specific securities. Investment decisions are your own responsibility.
















