
This article is based on publicly available IR materials and is not a recommendation to buy or sell any specific securities.
Note: Nagaileben’s fiscal year ends in August, and the company labels the year ended August 31, 2025 as “FY2025” and the year ending August 31, 2026 as “FY2026”; this article uses the labels exactly as they appear in the materials. In FY2025 the medical apparel maker lifted consolidated net sales 3.5% year on year to ¥16,983 million, but gross profit fell 4.5% to ¥6,712 million as the gross profit to sales ratio dropped from 42.8% to 39.5%, and operating income declined 10.5% to ¥3,583 million with net income down 8.8% to ¥2,573 million. For FY2026 the company targets record-high sales of ¥18.0 billion, +6.0% year on year, and a recovery in profits. Marking its 110th anniversary, Nagaileben plans a total dividend of ¥100 per share for FY2025 and executed ¥2.17 billion of share buybacks, lifting the payout ratio to 120.9% and the total return ratio to 204.3%.
Consolidated Results (Full-Year Actual) and FY2026 Forecast
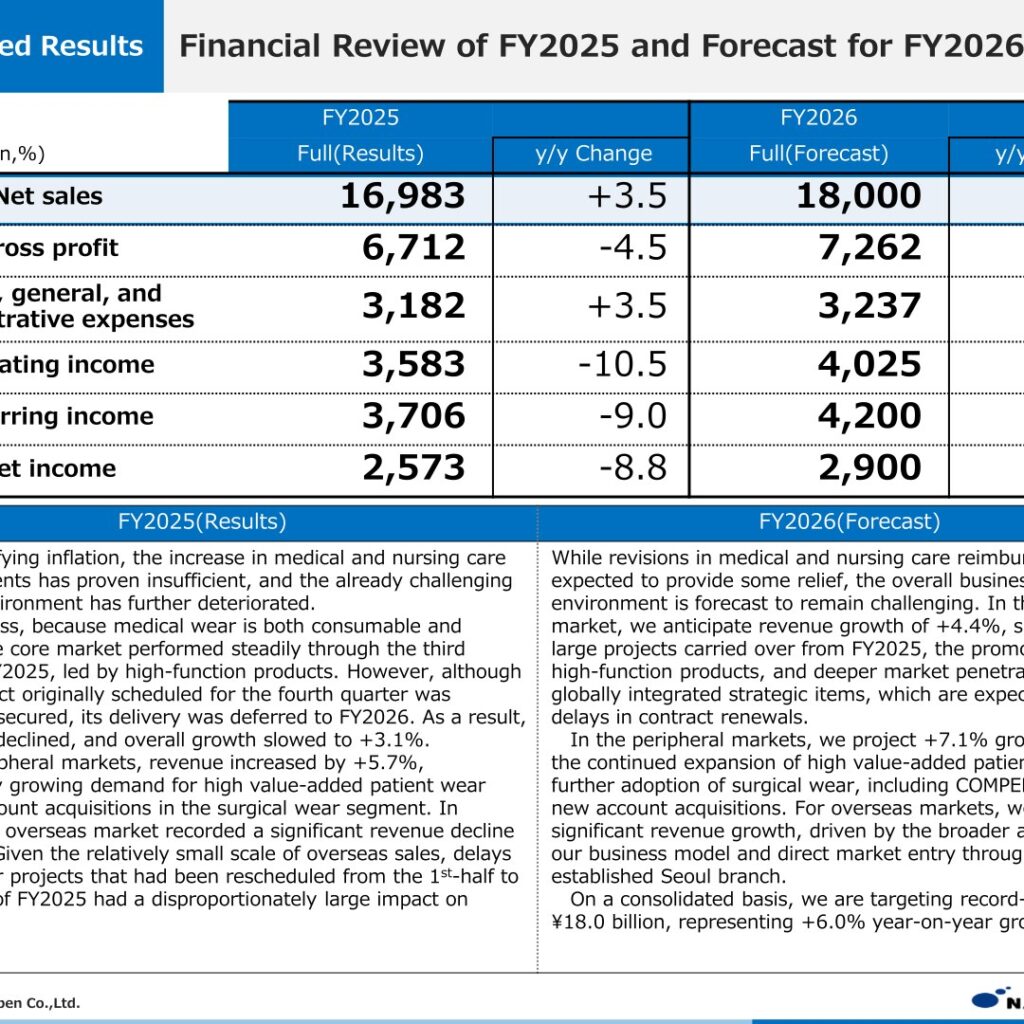
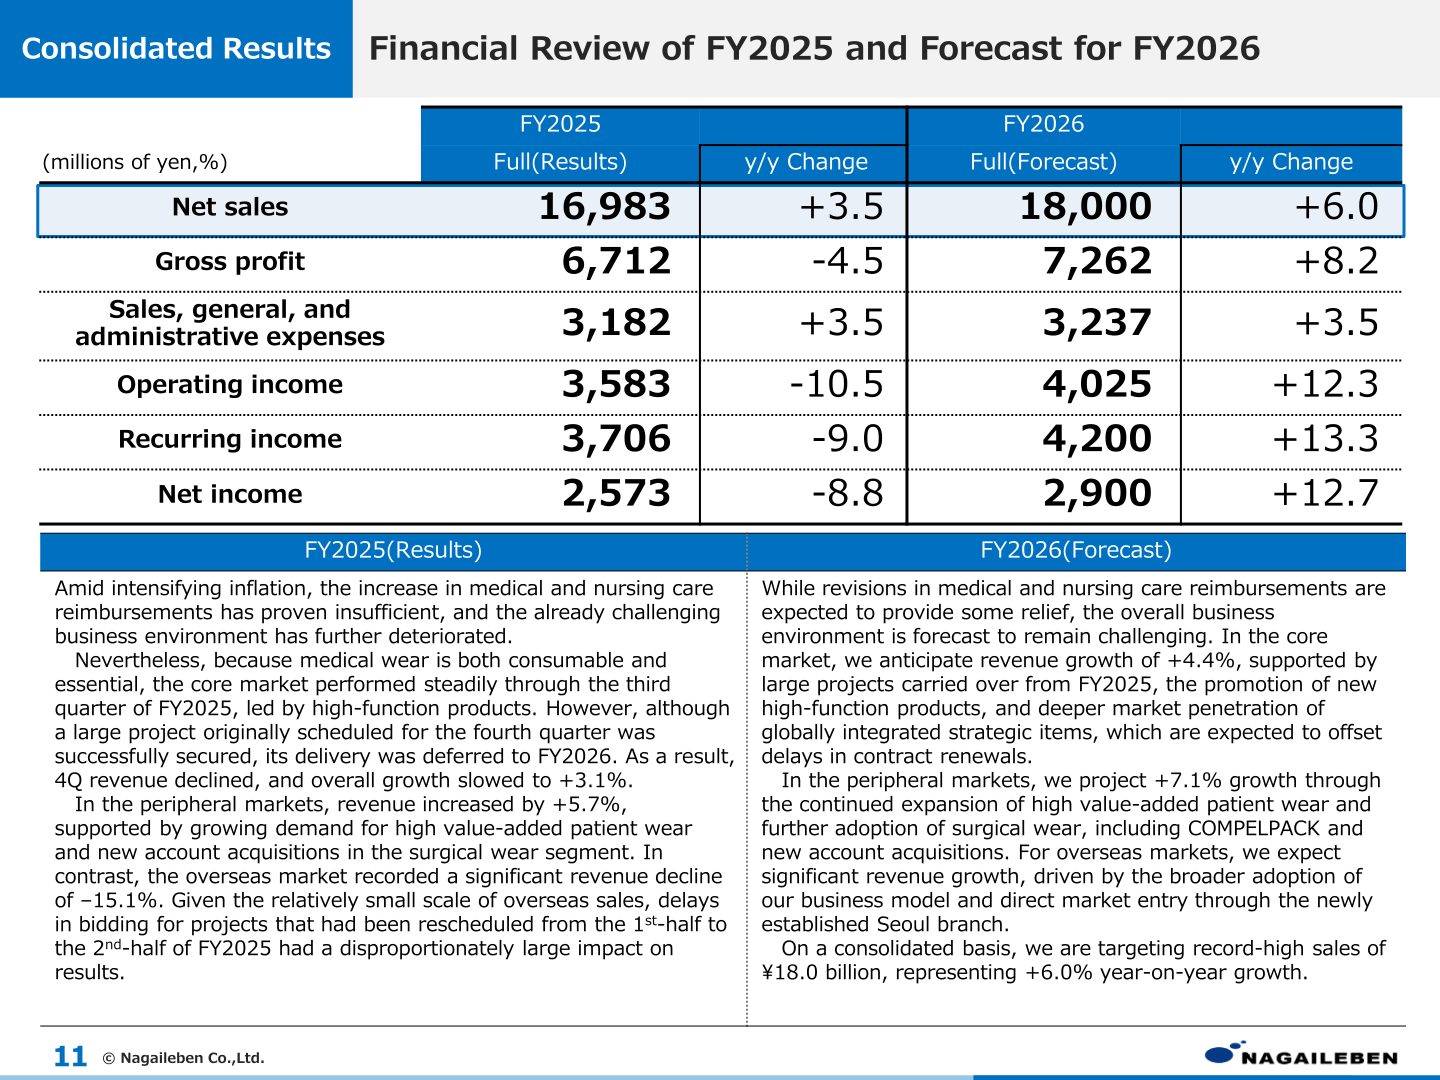
The materials state that amid intensifying inflation, the increase in medical and nursing care reimbursements has proven insufficient, and the already challenging business environment has further deteriorated. Nevertheless, because medical wear is both consumable and essential, the core market performed steadily through the third quarter of FY2025, led by high-function products. However, although a large project originally scheduled for the fourth quarter was successfully secured, its delivery was deferred to FY2026; as a result, 4Q revenue declined and overall core-market growth slowed to +3.1%. For FY2026 the company says that while revisions in medical and nursing care reimbursements are expected to provide some relief, the overall business environment is forecast to remain challenging, and on a consolidated basis it is targeting record-high sales of ¥18.0 billion, representing +6.0% year-on-year growth.
| Item (millions of yen, %) | FY2025 Full (Results) | y/y Change | FY2026 Full (Forecast) | y/y Change |
|---|---|---|---|---|
| Net sales | 16,983 | +3.5 | 18,000 | +6.0 |
| Gross profit | 6,712 | -4.5 | 7,262 | +8.2 |
| Sales, general, and administrative expenses | 3,182 | +3.5 | 3,237 | +3.5 |
| Operating income | 3,583 | -10.5 | 4,025 | +12.3 |
| Recurring income | 3,706 | -9.0 | 4,200 | +13.3 |
| Net income | 2,573 | -8.8 | 2,900 | +12.7 |
On gross margin, the materials show gross profit to sales of 42.8% in FY2024 falling to 39.5% in FY2025 and recovering to a planned 40.3% in FY2026. The assumed exchange rate moved from 146.0 yen/dollar in FY2024 to 152.0 yen/dollar in FY2025, with 147 assumed for FY2026, while the overseas production ratio rose from 54.0% in FY2024 to 55.5% in FY2025 and is planned at 57.5% in FY2026. Capital expenditure (depreciable assets) was ¥315m in FY2025 with depreciation of ¥279m; for FY2026 the company plans capital expenditure of ¥844m (buildings ¥272m, IT system ¥447m, distribution equipment ¥34m, manufacturing equipment ¥90m) and depreciation of ¥302m. Total planned system investment is ¥878m, comprising development of core systems ¥506m, overhaul of other systems ¥103m, and overhaul of system infrastructure ¥268m.
Results by Market
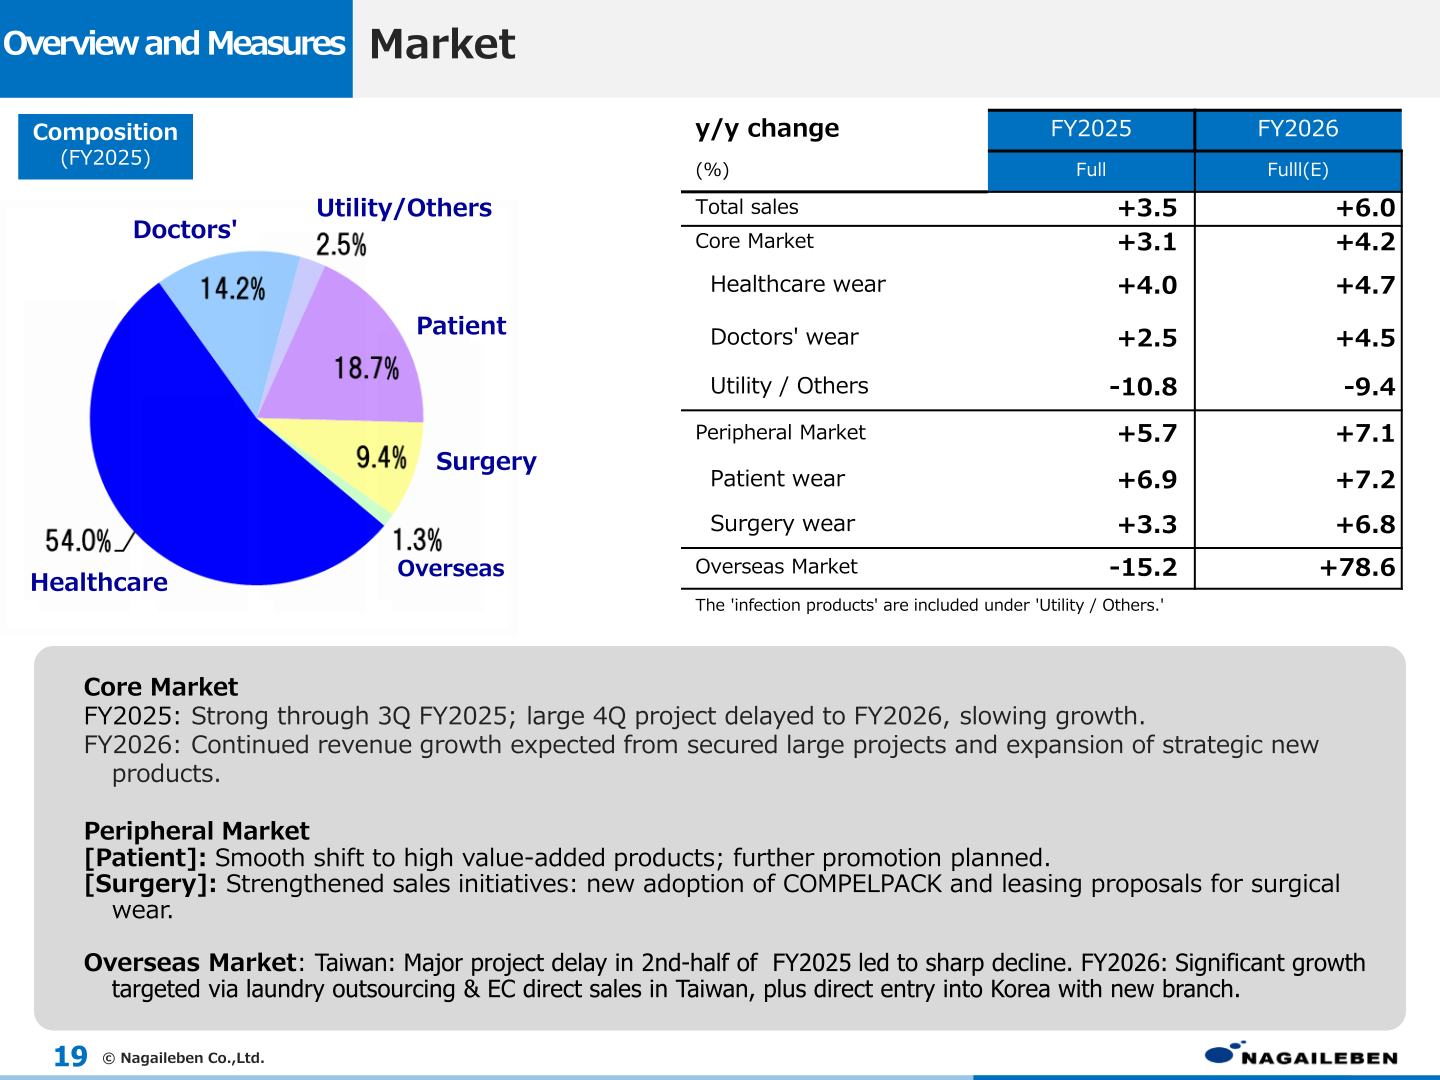
Nagaileben divides sales into the Core Market (healthcare wear, doctors’ wear, utility wear, shoes/other, infection prevention wear in Japan), the Peripheral Market (patient wear, surgery wear in Japan), and the Overseas Market. In FY2025 the Core Market grew +3.1% and the Peripheral Market +5.7%, supported by growing demand for high value-added patient wear and new account acquisitions in the surgical wear segment, while the Overseas Market declined. The materials note that in Taiwan a major project delay in the second half of FY2025 led to a sharp decline. For FY2026 the company plans significant overseas growth via laundry outsourcing and EC direct sales in Taiwan, plus direct entry into Korea with a newly established Seoul branch.
| Market (¥ million) | FY 24/8 | FY 25/8 | FY 26/8E | y/y FY2025 (%) | y/y FY2026E (%) |
|---|---|---|---|---|---|
| Sales | 16,412 | 16,983 | 18,000 | 3.5 | 6.0 |
| Core Market | 11,640 | 11,996 | 12,500 | 3.1 | 4.2 |
| Peripheral Market | 4,508 | 4,763 | 5,100 | 5.7 | 7.1 |
| Overseas Market | 263 | 223 | 400 | -15.1 | 78.6 |
By composition, the Core Market accounted for 70.6% of FY2025 sales, the Peripheral Market 28.0% and the Overseas Market 1.3%; for FY2026 the plan is 69.4%, 28.3% and 2.2% respectively. Within the FY2025 sales mix shown on the market slide, healthcare wear was 54.0%, patient wear 18.7%, doctors’ wear 14.2%, surgery wear 9.4%, utility/others 2.5% and overseas 1.3%.
Results by Product
By product tier, the materials report that High-End products saw strong sales of MACKINTOSH PHILOSOPHY in FY2025 and are expected to continue contributing to revenue growth in FY2026, while High Value-Added products secured renewal orders centered on premium “Safeel” materials, with large projects already secured for FY2026 plus the launch of new strategic items. Value-Added products are expected to recover through market penetration of low-cost strategic products utilizing integrated overseas production.
| Product (¥ million) | FY 24/8 | FY 25/8 | FY 26/8E | y/y FY2025 (%) | y/y FY2026E (%) |
|---|---|---|---|---|---|
| Sales | 16,412 | 16,983 | 18,000 | 3.5 | 6.0 |
| High-End products | 1,269 | 1,324 | 1,400 | 4.3 | 5.7 |
| High Value-Added products | 9,840 | 10,543 | 11,200 | 7.1 | 6.2 |
| Value-Added products | 4,675 | 4,483 | 4,800 | -4.1 | 7.1 |
| Mass products | 627 | 632 | 600 | 0.8 | -5.1 |
On the production side (non-consolidated), domestic production was ¥4,653m in FY2025 against overseas production of ¥5,883m and purchased products of ¥65m; the FY2026 plan is ¥4,636m, ¥6,360m and ¥65m respectively. The company states that the shift to overseas production and the increase in product manufacturing using overseas materials will continue to raise the ratio of overseas production.
Shareholder Returns
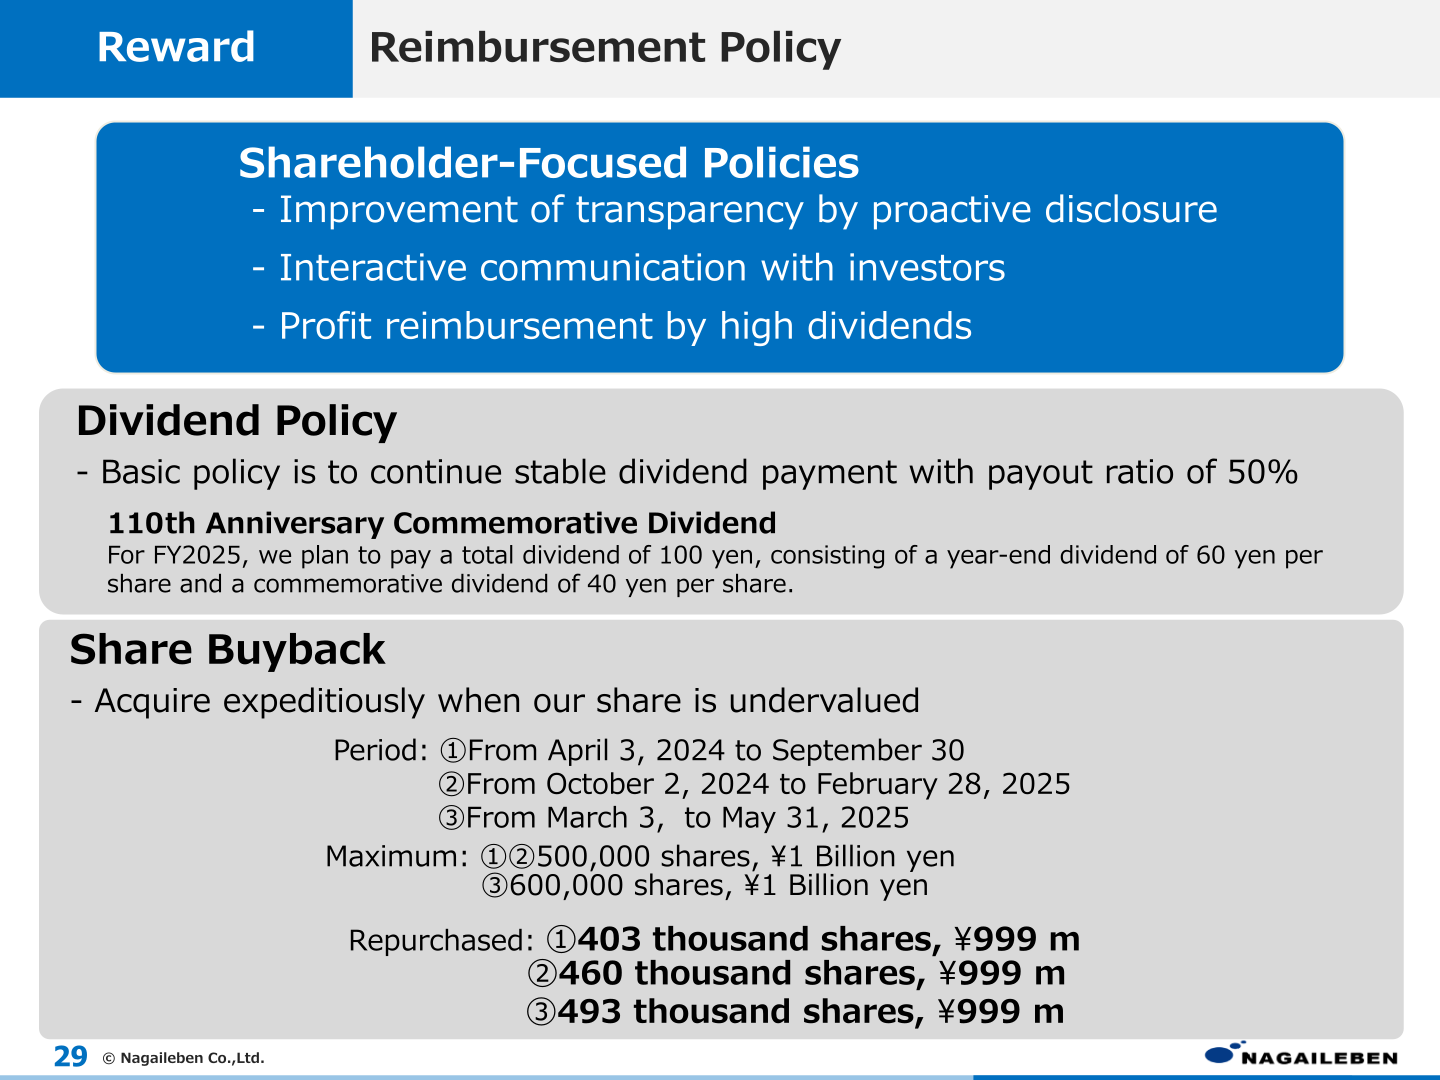
Nagaileben’s basic policy is to continue stable dividend payment with a payout ratio of 50%, alongside improvement of transparency by proactive disclosure, interactive communication with investors, and profit reimbursement by high dividends. For FY2025 the company plans a total dividend of ¥100 per share, consisting of a year-end dividend of ¥60 per share and a 110th anniversary commemorative dividend of ¥40 per share. On buybacks, the policy is to acquire expeditiously when the share is undervalued; three programs were executed — ①403 thousand shares for ¥999m, ②460 thousand shares for ¥999m and ③493 thousand shares for ¥999m — with maximums of 500,000 shares / ¥1 billion for programs ① and ②, and 600,000 shares / ¥1 billion for program ③.
| Item (non-consolidated) | FY2024 | FY2025E |
|---|---|---|
| Total dividend (million yen) | 1,889 | 3,047 |
| Share buyback (million yen) | 1,449 | 2,177 |
| Payout ratio (%) | 68.1 | 120.9 |
| Total return ratio (%) | 119.1 | 204.3 |
| DPS (yen) | 60.0 | 100.0 |
The materials also present cumulative returns over the 20 years from FY2006 to FY2025: net income of ¥58.5 B, total dividends of ¥34.8 B and share buybacks of ¥10.5 B, giving shareholder returns of ¥45.3 B and a return rate of 77.4% ((total dividend + share buyback) ÷ net income). The same slide shows total assets rising from ¥31.2 B in FY2006 to ¥44.6 B, with a capital-to-asset ratio of 92.5% as of FY2025.
Management Goals
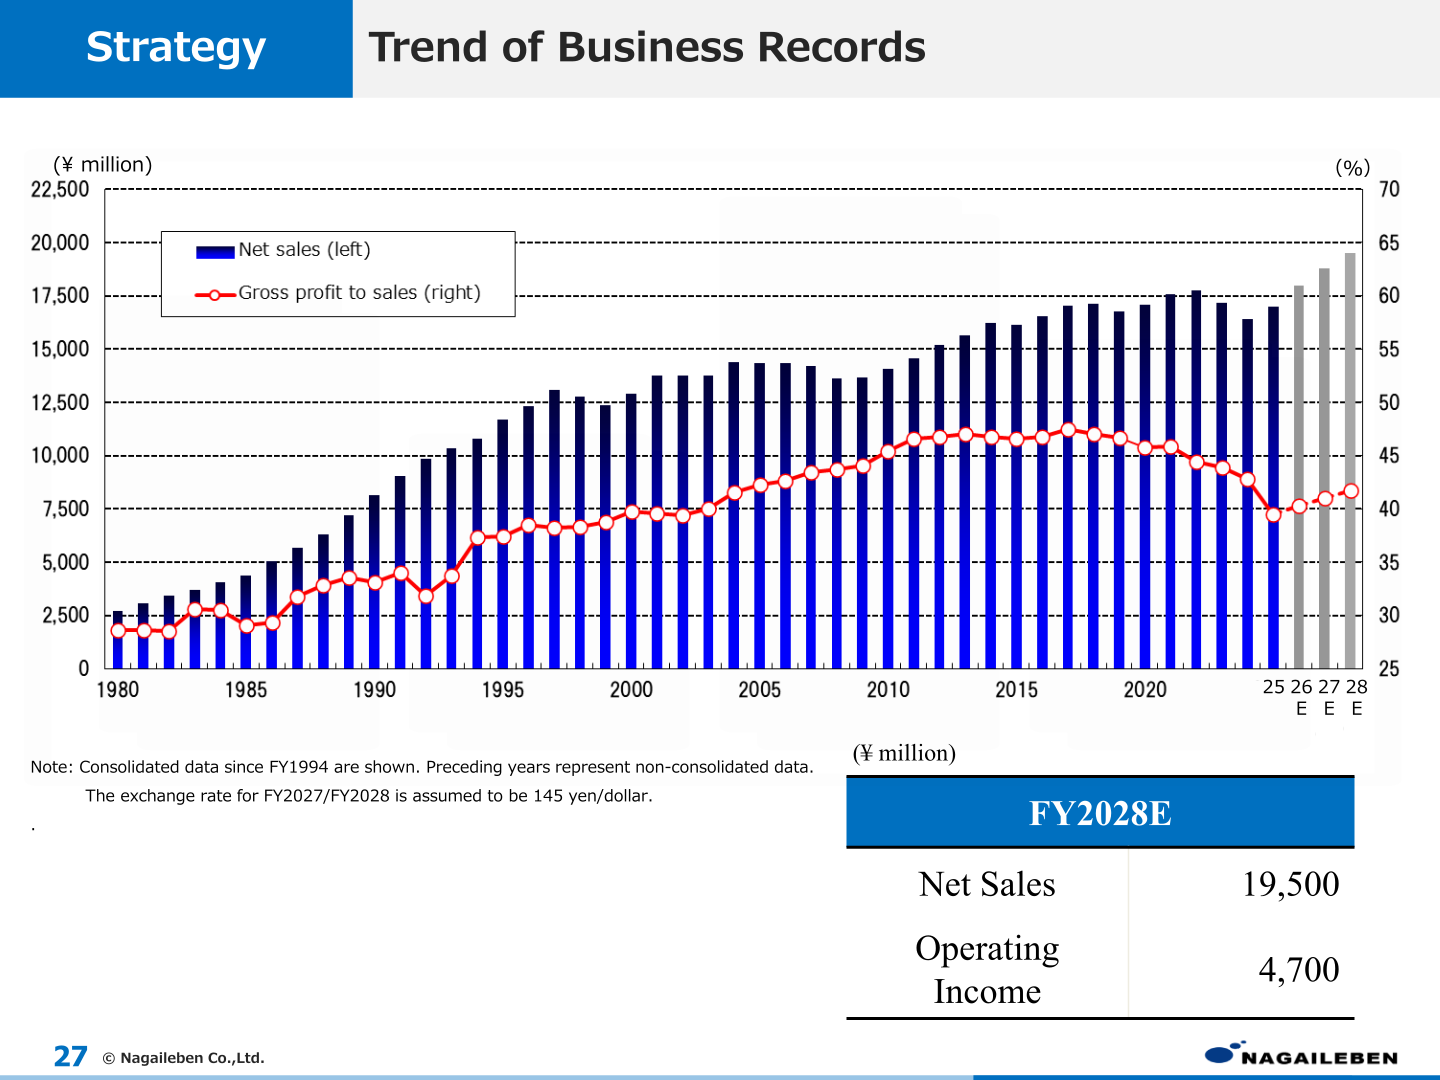
The company’s stated business direction covers the market (capture needs in the core market, increase share of the peripheral market, cultivate the overseas market), products (develop and sell high-end and high value-added products, develop low-cost strategic products utilizing overseas materials) and production (shift to overseas production, strengthen the ability to respond with quick response and small-lot multi-production). The trend chart in the materials sets FY2028E net sales of ¥19,500 million and operating income of ¥4,700 million, with an assumed exchange rate of 145 yen/dollar for FY2027 and FY2028. The marketing-strategy slide shows an FY2028E composition of sales totalling ¥19.5 B, split between the Core Market at 68%, the Peripheral Market at 29% and the Overseas Market at 3%.
Key per-share and profitability indicators disclosed for FY2025 are ROE of 6.1%, ROA of 8.1%, BPS of ¥1,355.6, EPS of ¥83.2, gross profit to sales of 39.5% and a capital-to-asset ratio of 92.5%. Consolidated capital expenditure was ¥315 million and depreciation ¥279 million, with 501 employees and a proportion of female employees of 65.2%.
This article is an analysis based on publicly available information and is not a recommendation to buy or sell any specific securities. Investment decisions are your own responsibility.
















