
This article is based on publicly available IR materials and is not a recommendation to buy or sell any specific securities.
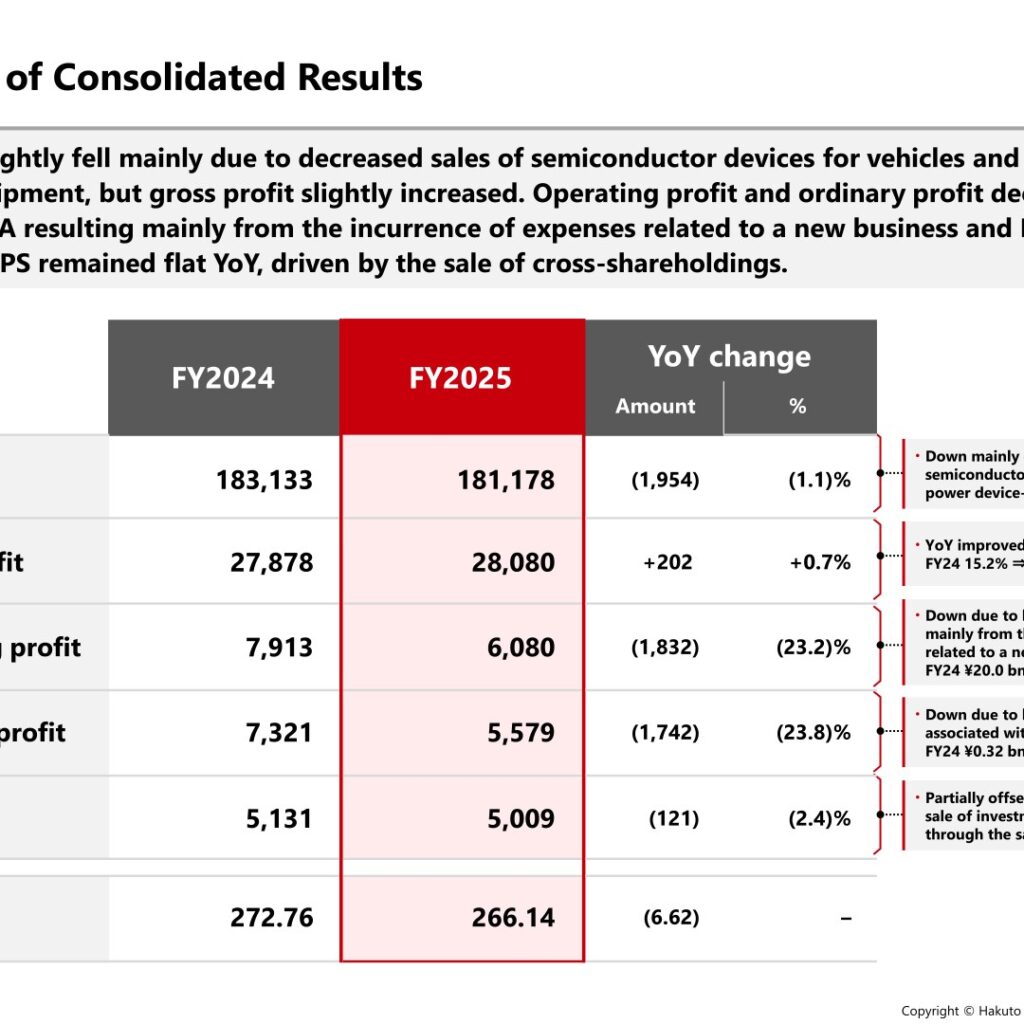
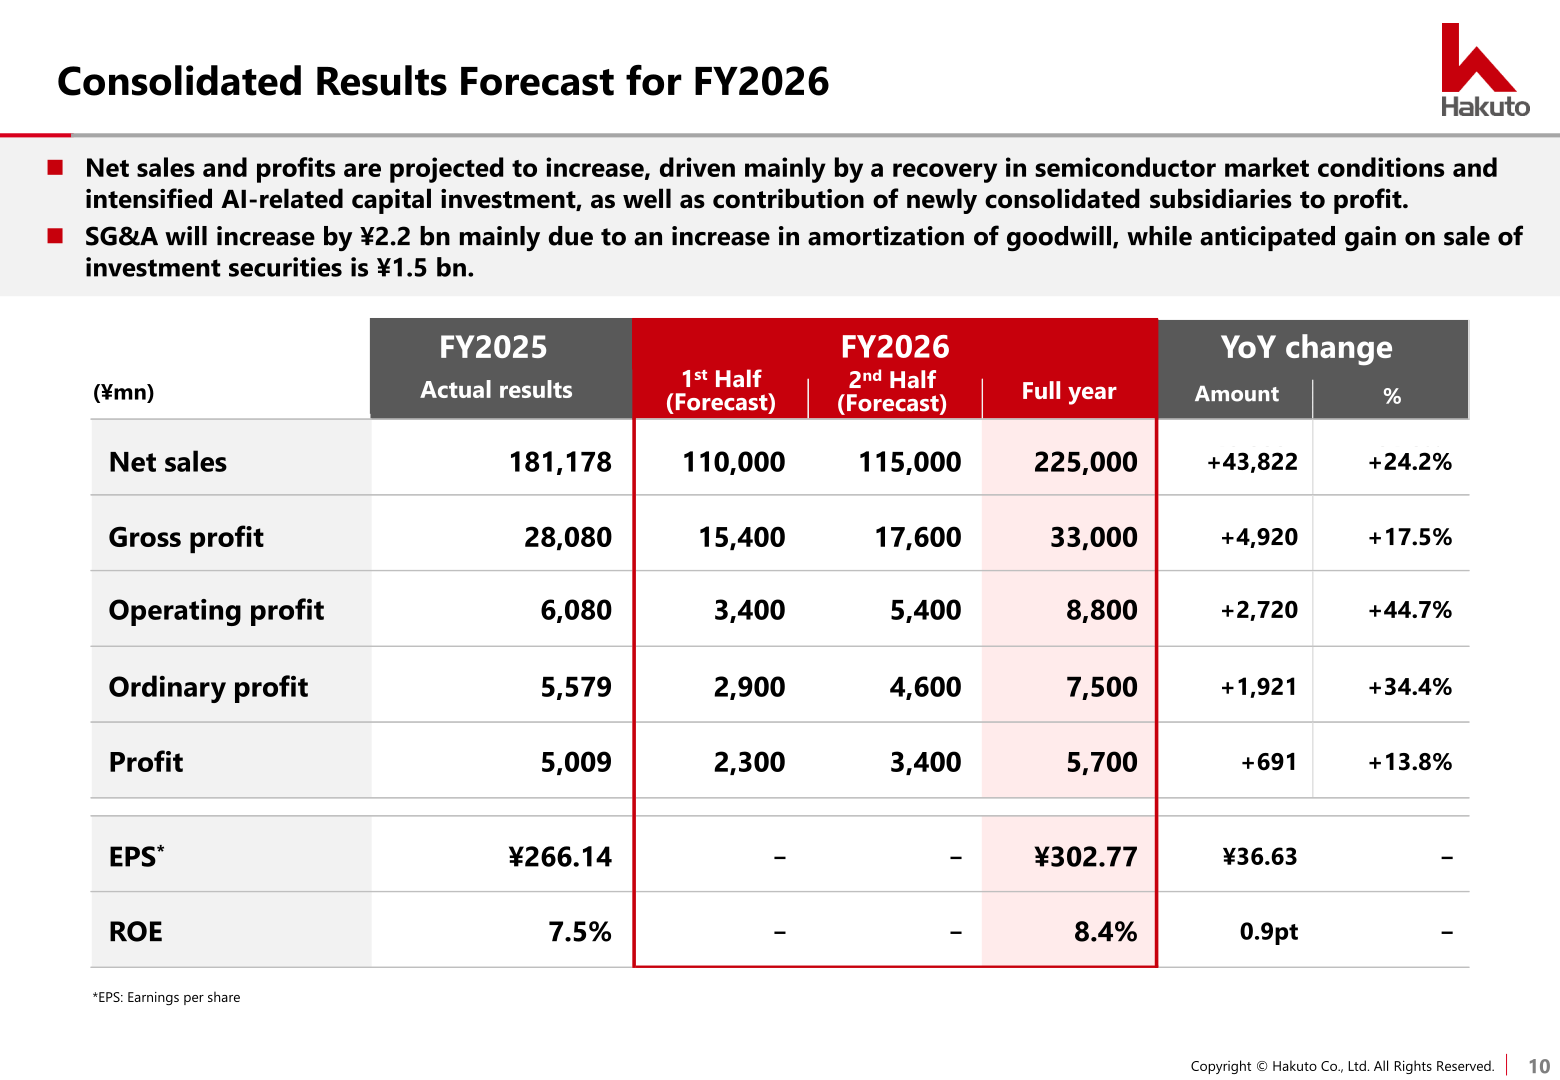
Hakuto Co., Ltd. posted net sales of ¥181,178 mn for the fiscal year ended March 31, 2026, which the company labels FY2025, down (1,954) mn or (1.1)% year on year, while gross profit rose +202 mn to ¥28,080 mn. Operating profit fell (23.2)% to ¥6,080 mn and ordinary profit fell (23.8)% to ¥5,579 mn on higher SG&A stemming mainly from expenses related to a new business and M&A. Profit of ¥5,009 mn and EPS of ¥266.14 were broadly flat year on year, helped by a gain on sale of investment securities of ¥2.2 bn through the sale of cross-shareholdings. For FY2026 the company forecasts net sales of ¥225,000 mn (+24.2%) and operating profit of ¥8,800 mn (+44.7%).
Consolidated Results (Full-Year Actual)
The materials label the year ended March 31, 2026 as FY2025 and the preceding year as FY2024. Net sales fell mainly due to decreased sales of semiconductor devices for vehicles and power device-related equipment, but the gross profit margin improved from 15.2% in FY24 to 15.5% in FY25. Operating profit declined as SG&A rose from ¥20.0 bn in FY24 to ¥22.0 bn in FY25, mainly on expenses related to a new business and M&A, while ordinary profit was additionally pressured by higher interest expenses associated with higher borrowings (FY24 ¥0.32 bn ⇒ FY25 ¥0.43 bn). Within the operating profit bridge, foreign exchange fluctuation (weaker yen) boosted profits by ¥0.97 bn for FY2024 and ¥0.7 bn for FY2025, and ¥0.65 bn was recorded as M&A-related expenses.
| Item (¥mn) | FY2024 | FY2025 | YoY change (Amount) | YoY change (%) |
|---|---|---|---|---|
| Net sales | 183,133 | 181,178 | (1,954) | (1.1)% |
| Gross profit | 27,878 | 28,080 | +202 | +0.7% |
| Operating profit | 7,913 | 6,080 | (1,832) | (23.2)% |
| Ordinary profit | 7,321 | 5,579 | (1,742) | (23.8)% |
| Profit | 5,131 | 5,009 | (121) | (2.4)% |
| EPS | 272.76 | 266.14 | (6.62) | – |
Segment Results
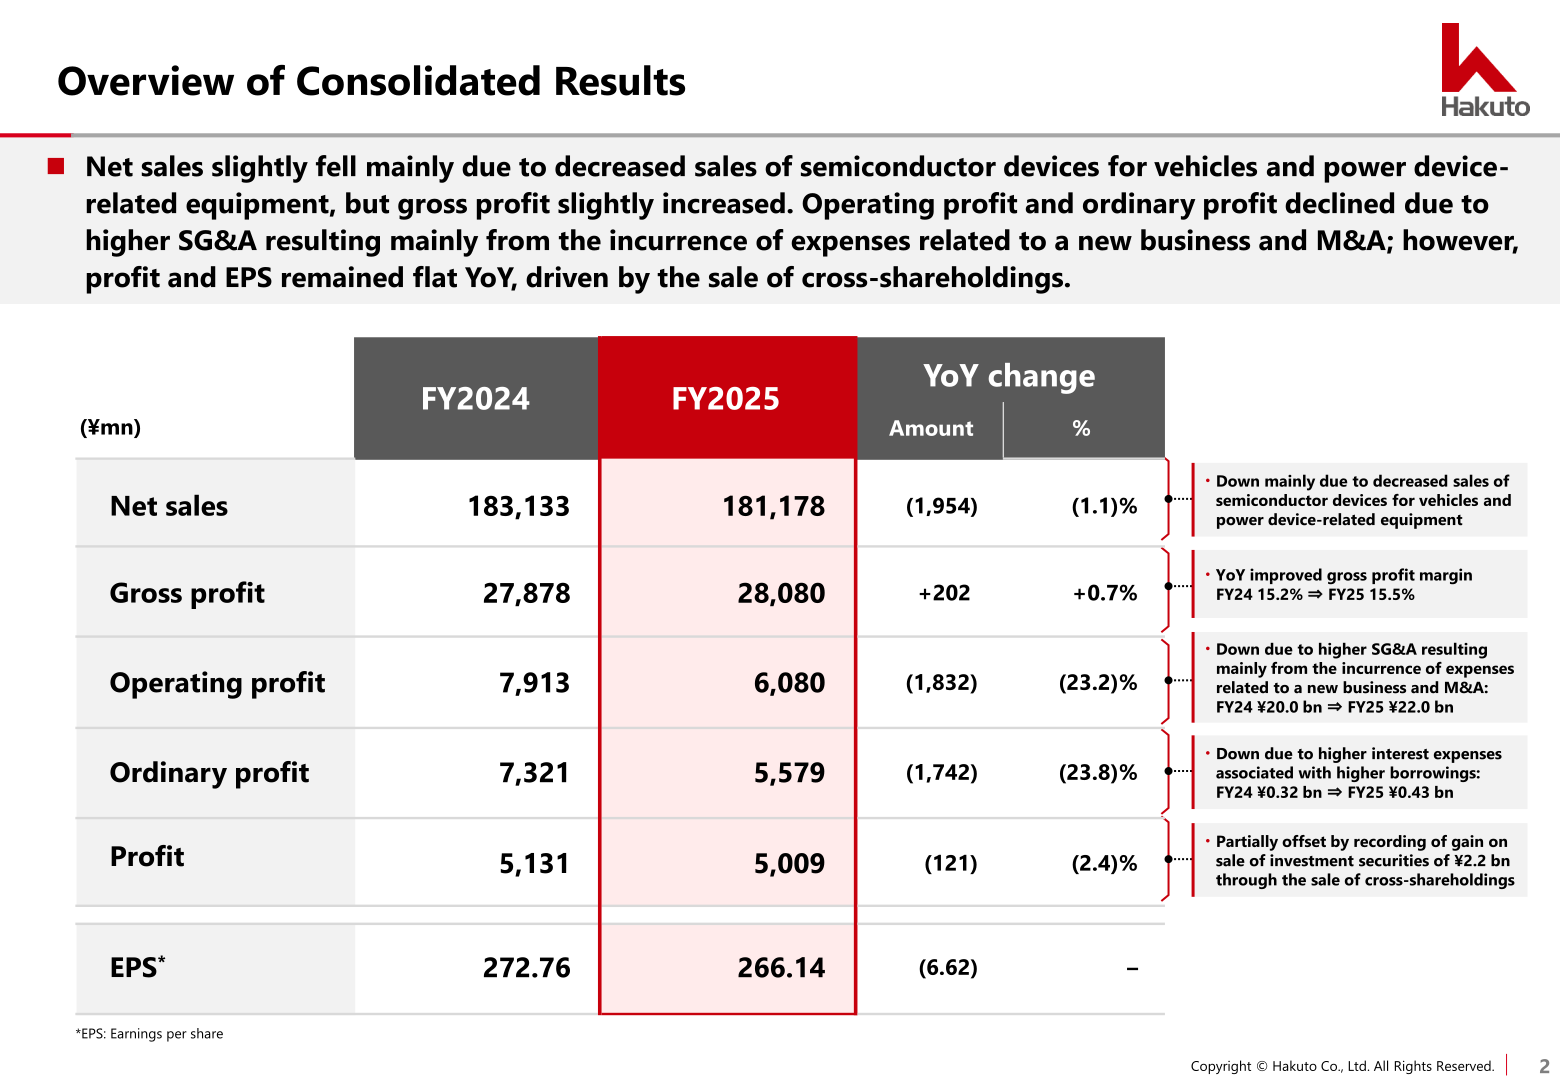
Electronic Components recorded decreases in sales and profit due to inventory adjustments, foreign exchange effects, and M&A-related expenses, while Electronic and Electric Equipment saw decreases in sales and profit as a result of curtailed capital investment, reflecting lower sales of PCB-related and power device-related equipment. Chemicals recorded increases in sales and profit on strong performance in the petroleum refining and petrochemical sector for the domestic market and a recovery in overseas sales of cosmetic base materials. The Other segment recorded increased revenue following the addition of a newly consolidated subsidiary; however, it posted a loss due to goodwill amortization and expenses related to a new business. The Industrial Chemicals Business was renamed the Chemicals Business starting from FY2025, and net sales in the table represent amounts before elimination of intersegment transactions.
| Segment | Metric (¥mn) | FY2024 | FY2025 | YoY change (Amount) | YoY change (%) |
|---|---|---|---|---|---|
| Electronic Components | Net sales | 142,961 | 140,274 | (2,686) | (1.9)% |
| Electronic Components | Segment profit | 5,239 | 3,933 | (1,306) | (24.9)% |
| Electronic and Electric Equipment | Net sales | 27,241 | 25,300 | (1,941) | (7.1)% |
| Electronic and Electric Equipment | Segment profit | 2,498 | 2,083 | (414) | (16.6)% |
| Chemicals | Net sales | 10,789 | 11,156 | +367 | +3.4% |
| Chemicals | Segment profit | (9) | 625 | +634 | – |
| Other | Net sales | 2,560 | 4,853 | +2,292 | +89.5% |
| Other | Segment profit | 131 | (705) | (836) | – |
| Total | Net sales | 183,553 | 181,585 | (1,968) | (1.1)% |
| Total | Segment profit | 7,859 | 5,936 | (1,922) | (24.5)% |
Orders, Group Breakdown and Financial Position
Orders received totalled ¥191,146 mn in FY2025, against ¥168,618 mn in FY2024 and ¥154,935 mn in FY2023, and the order backlog stood at ¥76,899 mn versus ¥71,322 mn and ¥90,793 mn respectively. The Electronic Components Business showed an uptrend, backed by memory shortage stemming from heightened AI demand and investments in next-generation high-speed communication, and the Electronic and Electric Equipment Business experienced a significant increase in orders received, driven by expanded demand of advanced packaging equipment for AI semiconductors. These figures do not include the orders received and order backlog of newly consolidated subsidiaries in FY2025. On a simple-sum basis, Japan (Hakuto and 3 consolidated subsidiaries) recorded net sales of ¥152.7 bn and operating profit of ¥4.96 bn in FY2025, while Overseas (9 consolidated subsidiaries) recorded net sales of ¥62.6 bn and operating profit of ¥1.88 bn.
Total assets increased by ¥34.1 bn to ¥164,484 mn as a result of the acquisition of two consolidated subsidiaries (deemed acquisition date: March 31, 2026), with goodwill rising to ¥16,063 mn from ¥3,028 mn. Total liabilities increased by ¥29.8 bn to ¥94,651 mn mainly due to increases in trade payables and interest-bearing debt, the latter rising to ¥58,031 mn from ¥35,282 mn. Net assets increased by ¥4.3 bn to ¥69,833 mn and the equity ratio was 41.6%, against 50.3% a year earlier. Net cash provided by operating activities amounted to ¥10.2 bn (¥10,273 mn), net cash used in investing activities amounted to ¥17.5 bn (¥(17,533) mn) mainly due to purchase of shares of subsidiaries, and net cash provided by financing activities amounted to ¥10.0 bn (¥10,017 mn); cash and cash equivalents at end of period were ¥18,749 mn.
FY2026 Forecast
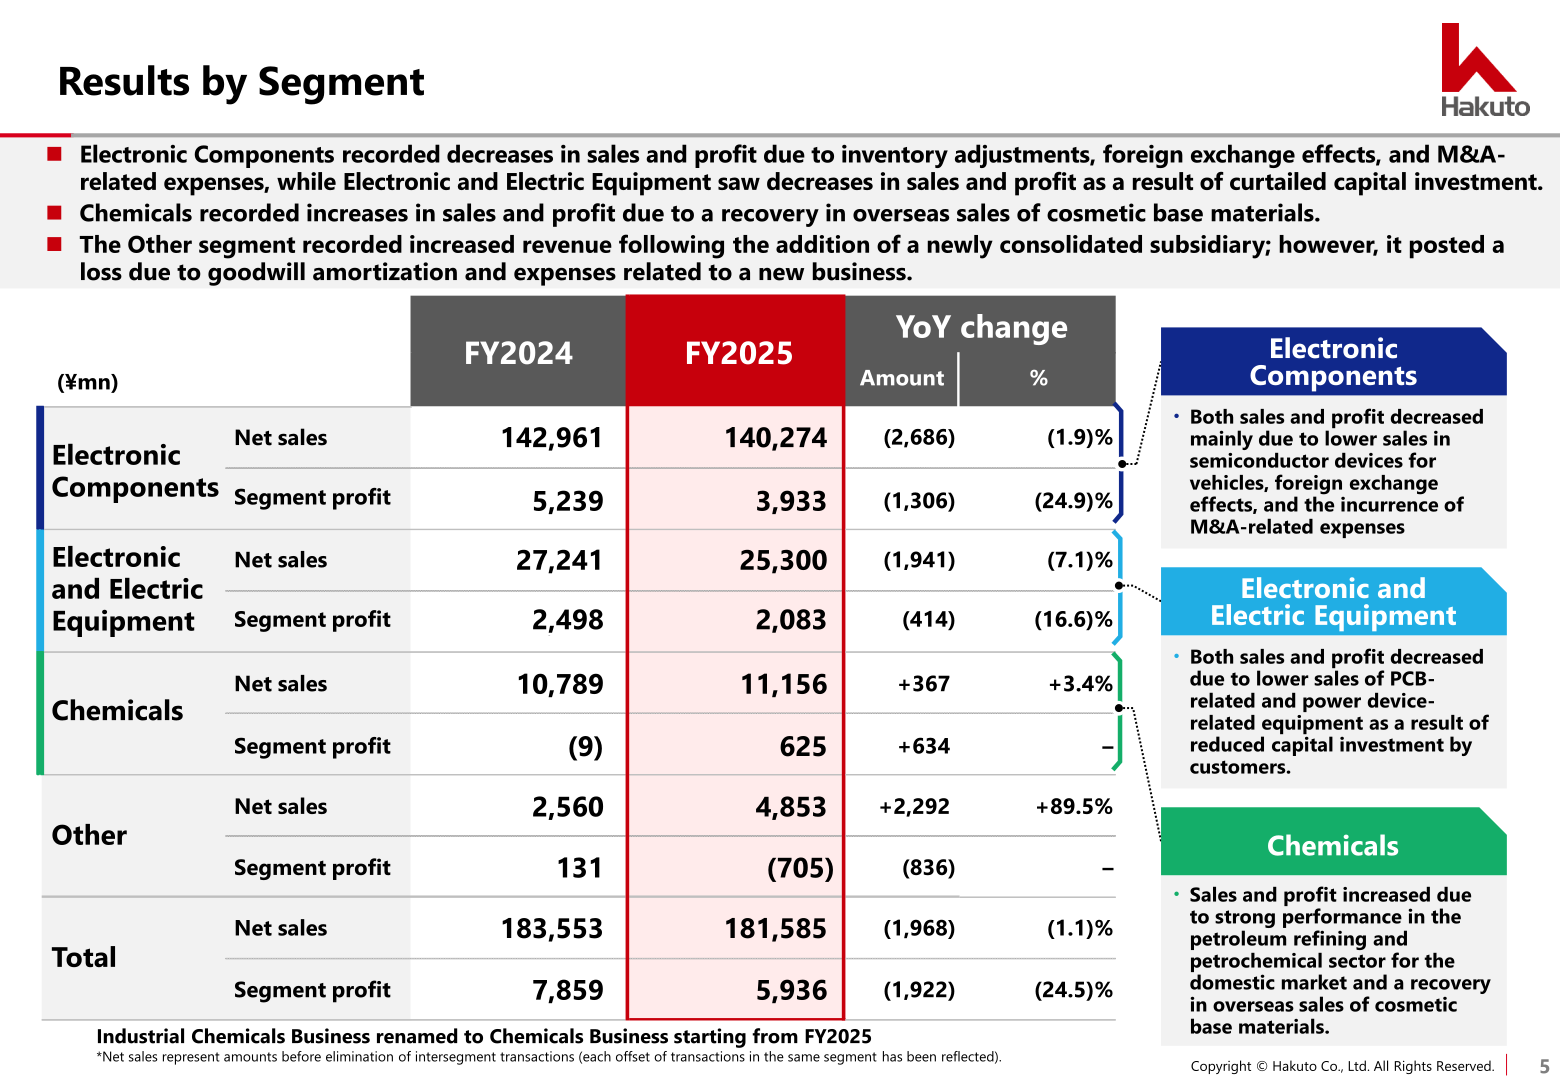
Net sales and profits are projected to increase, driven mainly by a recovery in semiconductor market conditions and intensified AI-related capital investment, as well as contribution of newly consolidated subsidiaries to profit. SG&A will increase by ¥2.2 bn mainly due to an increase in amortization of goodwill, while anticipated gain on sale of investment securities is ¥1.5 bn. In the operating profit bridge to FY2026, Electronic Components contributes +2,086 mn and Chemicals +359 mn, while the FY2025 foreign exchange benefit of ¥0.7 bn does not recur ((698) mn) and the ¥0.65 bn of M&A-related expenses recorded in FY2025 reverses (+652 mn).
| Item (¥mn) | FY2025 (Actual results) | FY2026 1st Half (Forecast) | FY2026 2nd Half (Forecast) | FY2026 Full year | YoY change (Amount) | YoY change (%) |
|---|---|---|---|---|---|---|
| Net sales | 181,178 | 110,000 | 115,000 | 225,000 | +43,822 | +24.2% |
| Gross profit | 28,080 | 15,400 | 17,600 | 33,000 | +4,920 | +17.5% |
| Operating profit | 6,080 | 3,400 | 5,400 | 8,800 | +2,720 | +44.7% |
| Ordinary profit | 5,579 | 2,900 | 4,600 | 7,500 | +1,921 | +34.4% |
| Profit | 5,009 | 2,300 | 3,400 | 5,700 | +691 | +13.8% |
| EPS | ¥266.14 | – | – | ¥302.77 | ¥36.63 | – |
| ROE | 7.5% | – | – | 8.4% | 0.9pt | – |
Shareholder Returns
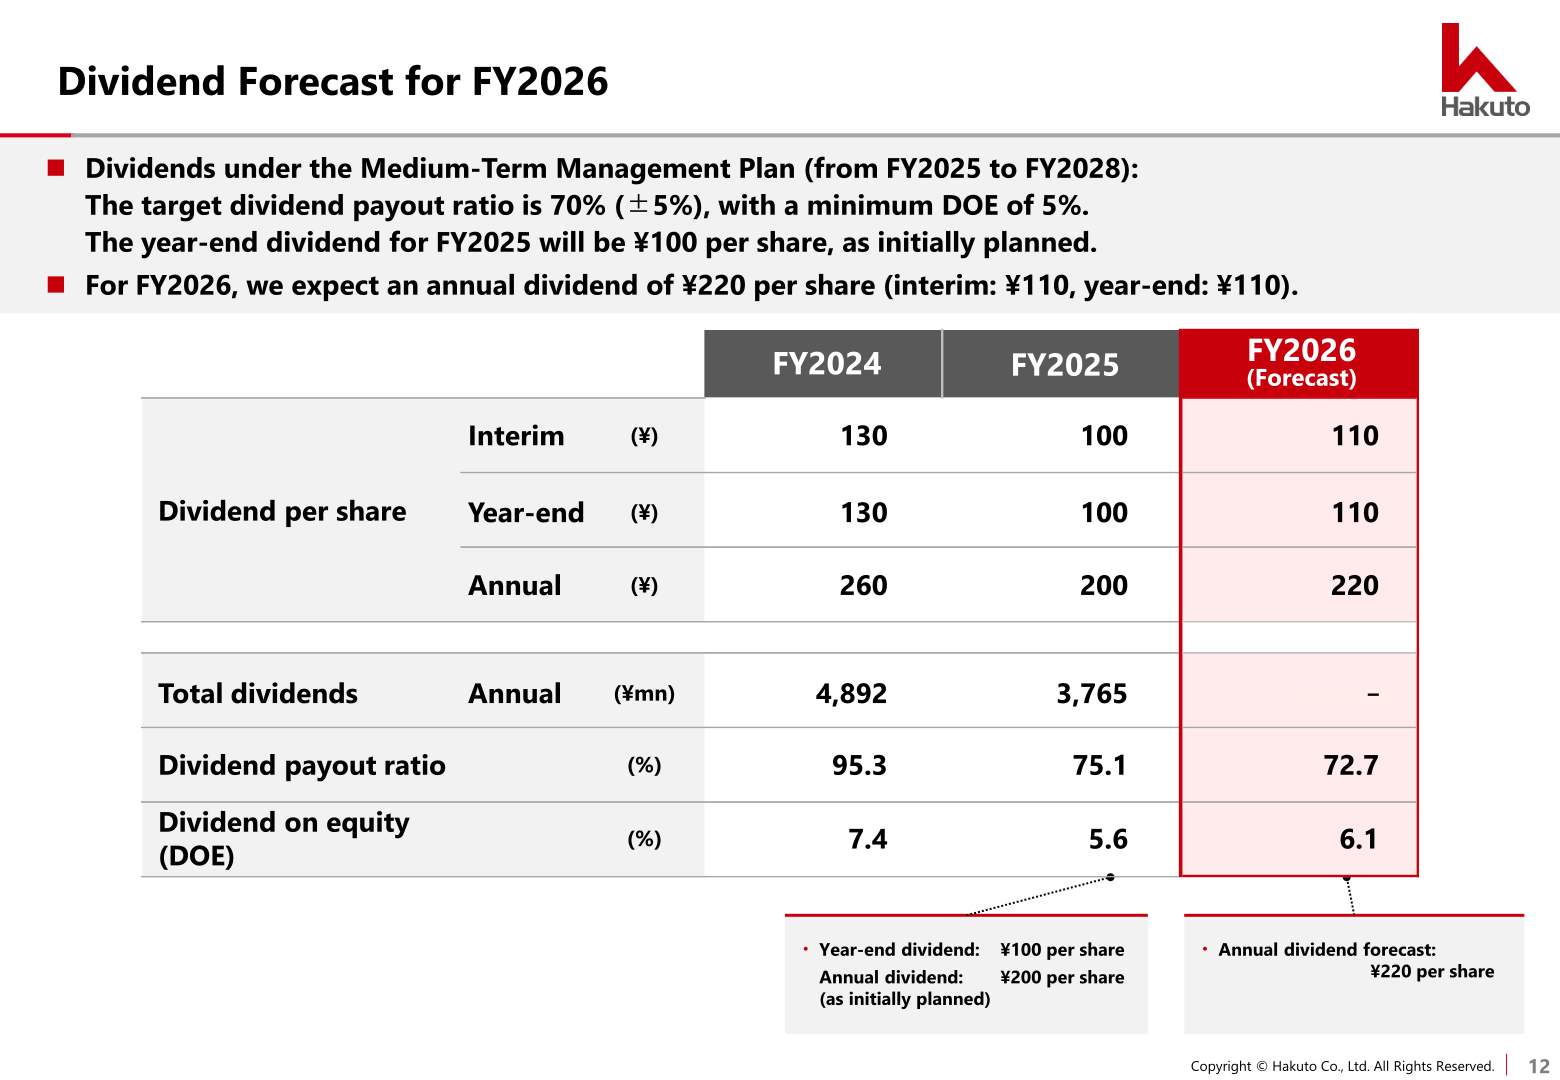
Under the Medium-Term Management Plan (from FY2025 to FY2028), the target dividend payout ratio is 70% (±5%), with a minimum DOE of 5%. The year-end dividend for FY2025 will be ¥100 per share, as initially planned, giving an annual dividend of ¥200 per share. For FY2026, the company expects an annual dividend of ¥220 per share (interim: ¥110, year-end: ¥110).
| Item | FY2024 | FY2025 | FY2026 (Forecast) |
|---|---|---|---|
| Dividend per share — Interim (¥) | 130 | 100 | 110 |
| Dividend per share — Year-end (¥) | 130 | 100 | 110 |
| Dividend per share — Annual (¥) | 260 | 200 | 220 |
| Total dividends — Annual (¥mn) | 4,892 | 3,765 | – |
| Dividend payout ratio (%) | 95.3 | 75.1 | 72.7 |
| Dividend on equity (DOE) (%) | 7.4 | 5.6 | 6.1 |
This article is an analysis based on publicly available information and is not a recommendation to buy or sell any specific securities. Investment decisions are your own responsibility.
















