
This article is based on publicly available IR materials and is not a recommendation to buy or sell any specific securities.
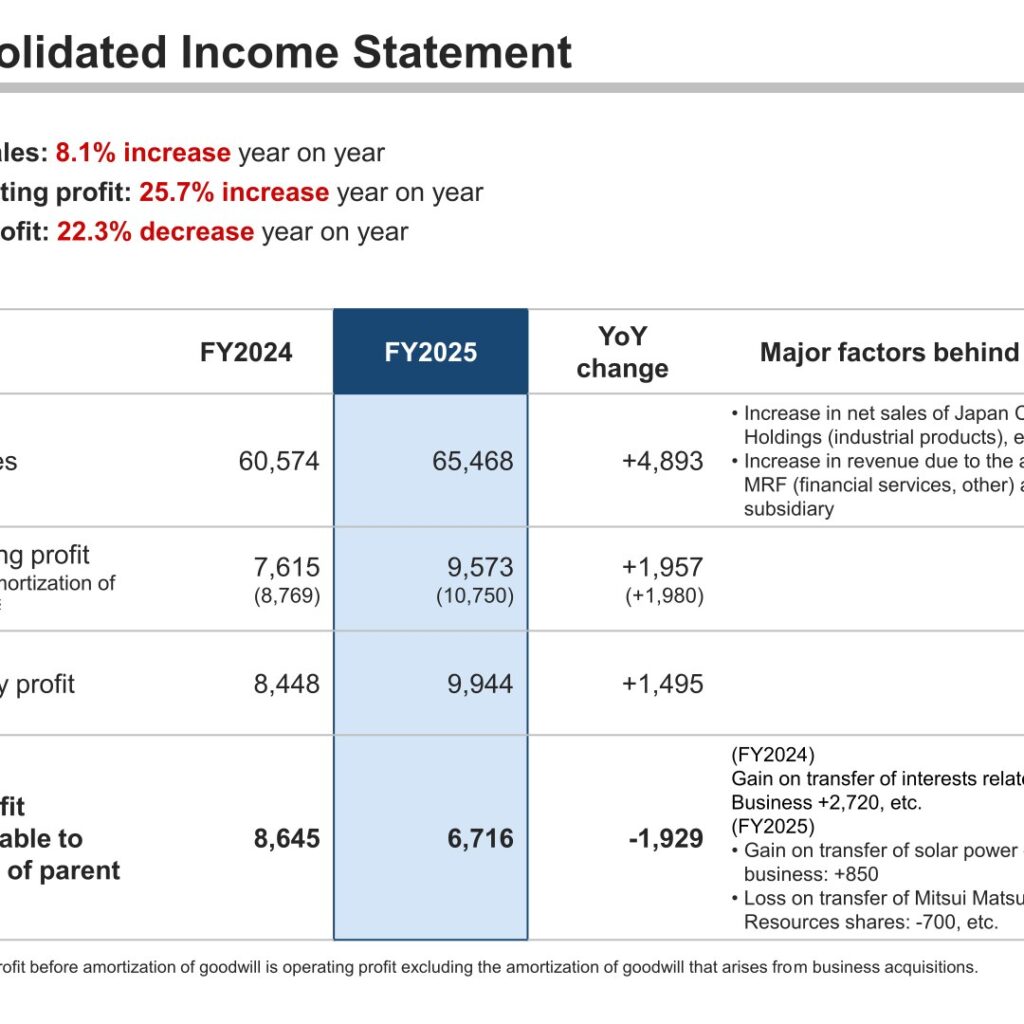
Mitsui Matsushima Holdings Co., Ltd. reported FY2025 (the fiscal year ended March 2026) net sales of 65,468 million yen, an 8.1% increase year on year, and operating profit of 9,573 million yen, a 25.7% increase year on year. Ordinary profit rose to 9,944 million yen, while net profit attributable to owners of parent decreased 22.3% to 6,716 million yen, reflecting the gain on transfer of interests related to the Coal Business recorded in the previous fiscal year. For FY2026 the Company forecasts net sales of 68,000 million yen, net profit attributable to owners of parent of 7,100 million yen and a dividend per share of 74 yen. Alongside the results, the Company presented “Medium-Term Management Plan 2030,” targeting consolidated net profit of 10 billion yen or more in the fiscal year ending March 2030.
Consolidated Results (Full-Year Actual)
Net sales increased on higher net sales at Japan Chain Holdings (industrial products) and on revenue from the acquisition of MRF (financial services, other) as a subsidiary. Operating profit before amortization of goodwill — operating profit excluding the amortization of goodwill arising from business acquisitions — reached 10,750 million yen. Net profit attributable to owners of parent declined year on year: FY2024 included a gain on transfer of interests related to the Coal Business of +2,720, while FY2025 included a gain on transfer of the solar power generation business of +850 and a loss on transfer of Mitsui Matsushima Resources shares of -700.
| Item (Million yen) | FY2024 | FY2025 | YoY change |
|---|---|---|---|
| Net sales | 60,574 | 65,468 | +4,893 |
| Operating profit | 7,615 | 9,573 | +1,957 |
| Operating profit (before amortization of goodwill) | (8,769) | (10,750) | (+1,980) |
| Ordinary profit | 8,448 | 9,944 | +1,495 |
| Net profit attributable to owners of parent | 8,645 | 6,716 | -1,929 |
Segment Results
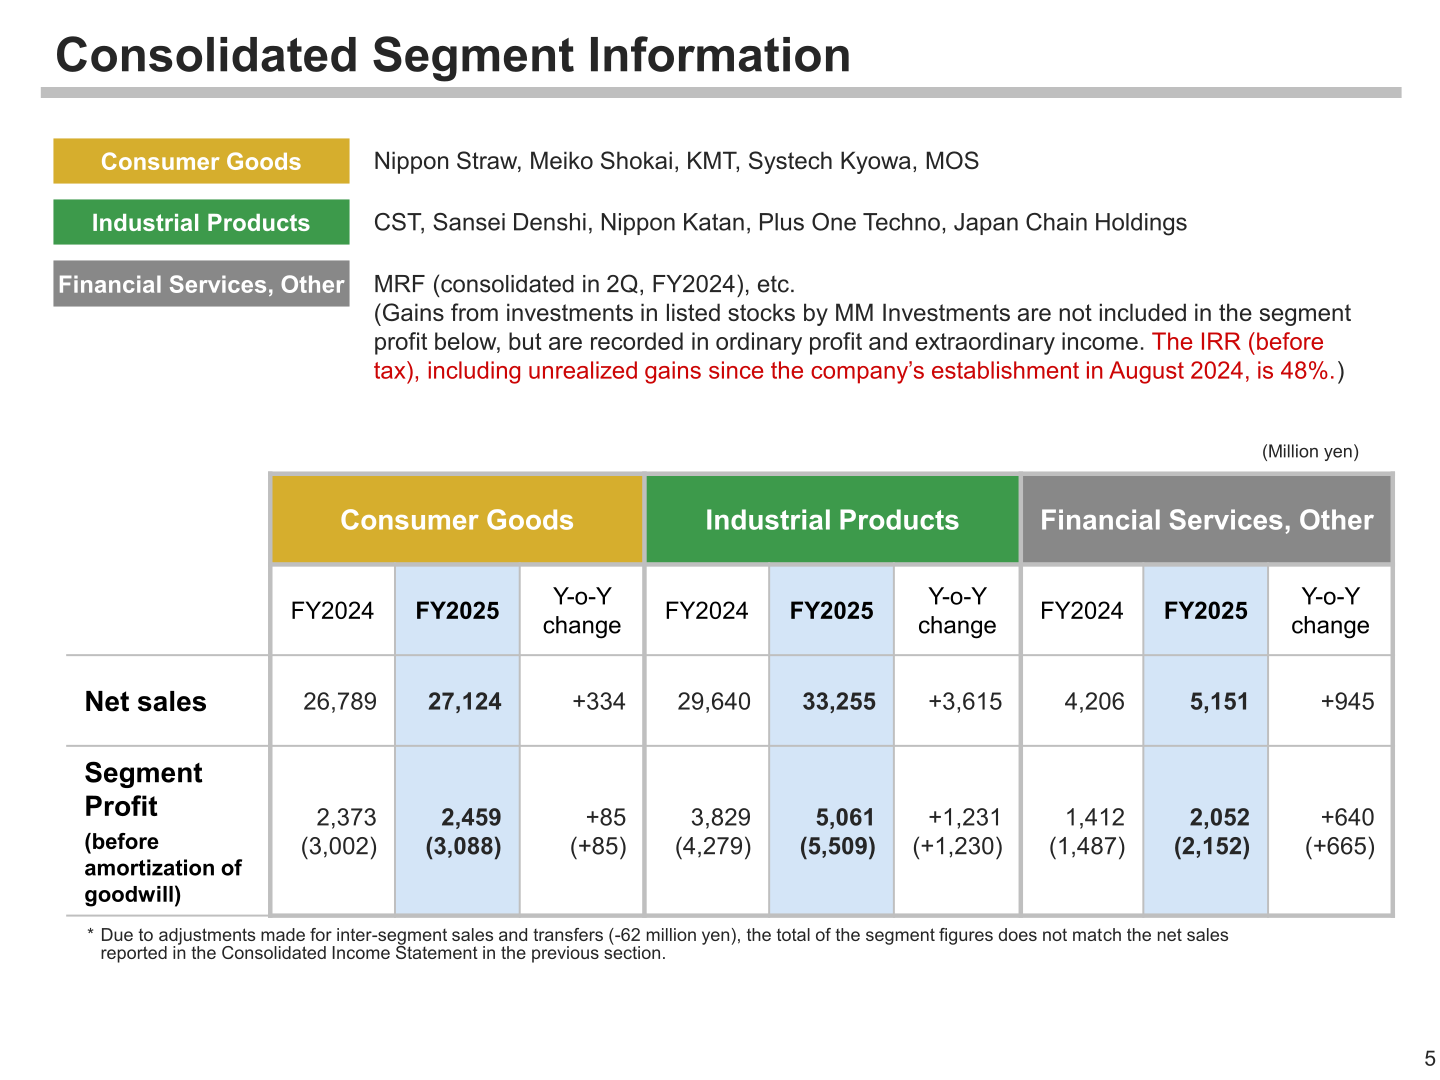
The Group reports three segments. Consumer Goods comprises Nippon Straw, Meiko Shokai, KMT, Systech Kyowa and MOS; Industrial Products comprises CST, Sansei Denshi, Nippon Katan, Plus One Techno and Japan Chain Holdings; Financial Services, Other includes MRF (consolidated in 2Q, FY2024). Industrial Products led the increase in both sales and profit. Gains from investments in listed stocks by MM Investments are not included in segment profit but are recorded in ordinary profit and extraordinary income; the pre-tax IRR, including unrealized gains since the company’s establishment in August 2024, is 48%. Due to adjustments made for inter-segment sales and transfers (-62 million yen), the total of the segment figures does not match the net sales reported in the consolidated income statement.
| Segment (Million yen) | Metric | FY2024 | FY2025 | Y-o-Y change |
|---|---|---|---|---|
| Consumer Goods | Net sales | 26,789 | 27,124 | +334 |
| Consumer Goods | Segment profit | 2,373 | 2,459 | +85 |
| Consumer Goods | Segment profit (before amortization of goodwill) | (3,002) | (3,088) | (+85) |
| Industrial Products | Net sales | 29,640 | 33,255 | +3,615 |
| Industrial Products | Segment profit | 3,829 | 5,061 | +1,231 |
| Industrial Products | Segment profit (before amortization of goodwill) | (4,279) | (5,509) | (+1,230) |
| Financial Services, Other | Net sales | 4,206 | 5,151 | +945 |
| Financial Services, Other | Segment profit | 1,412 | 2,052 | +640 |
| Financial Services, Other | Segment profit (before amortization of goodwill) | (1,487) | (2,152) | (+665) |
Balance Sheet
Total assets grew to 127,921 million yen, with fixed assets up 7,076 million yen on an increase in investment securities of MM Investments of +10,451. Fixed liabilities rose 14,333 million yen on an increase in long-term borrowings due to acquisition of own shares of +15,368. Total net assets decreased 9,680 million yen, reflecting a decrease due to acquisition of own shares of -18,050 and net profit attributable to owners of parent of +6,716. The equity ratio fell 12.0 points to 43.5%.
| Item (Million yen) | March 31, 2025 | March 31, 2026 | Change |
|---|---|---|---|
| Total assets | 117,627 | 127,921 | +10,293 |
| Current assets | 71,175 | 74,393 | +3,217 |
| Fixed assets | 46,451 | 53,528 | +7,076 |
| Total liabilities | 52,146 | 72,120 | +19,974 |
| Total net assets | 65,481 | 55,800 | – 9,680 |
| Cash and deposits | 8,973 | 5,701 | -3,271 |
| Interest-bearing liabilities | 31,763 | 50,237 | +18,474 |
| Net interest-bearing liabilities | 22,790 | 44,536 | +21,746 |
| Equity ratio (%) | 55.5 | 43.5 | -12.0 |
FY2026 Forecast
Both net sales and operating profit are expected to increase from FY2025 due to increased sales in each segment. Ordinary profit and net profit are expected to increase due to higher dividend income from MM Investments and the recording of a loss on share transfer in the previous period. Effective October 1, 2025, the Company conducted a 5-for-1 stock split of its common stock; the dividend per share shown is calculated based on the number of shares after the stock split. The forecast is based on information available as of the date of publication, and the Company notes that amid ongoing instability in the Middle East, uncertainty continues regarding the supply and price trends of energy and raw materials.
| Item (Million yen) | FY2025 Results | FY2026 forecast | YoY change |
|---|---|---|---|
| Net sales | 65,468 | 68,000 | +2,532 |
| Operating profit | 9,573 | 9,700 | +127 |
| Operating profit (before amortization of goodwill) | (10,750) | (10,800) | (+51) |
| Ordinary profit | 9,944 | 10,000 | +56 |
| Net profit attributable to owners of parent | 6,716 | 7,100 | +384 |
| Dividend per share | 64 yen | 74 yen | +10 yen |
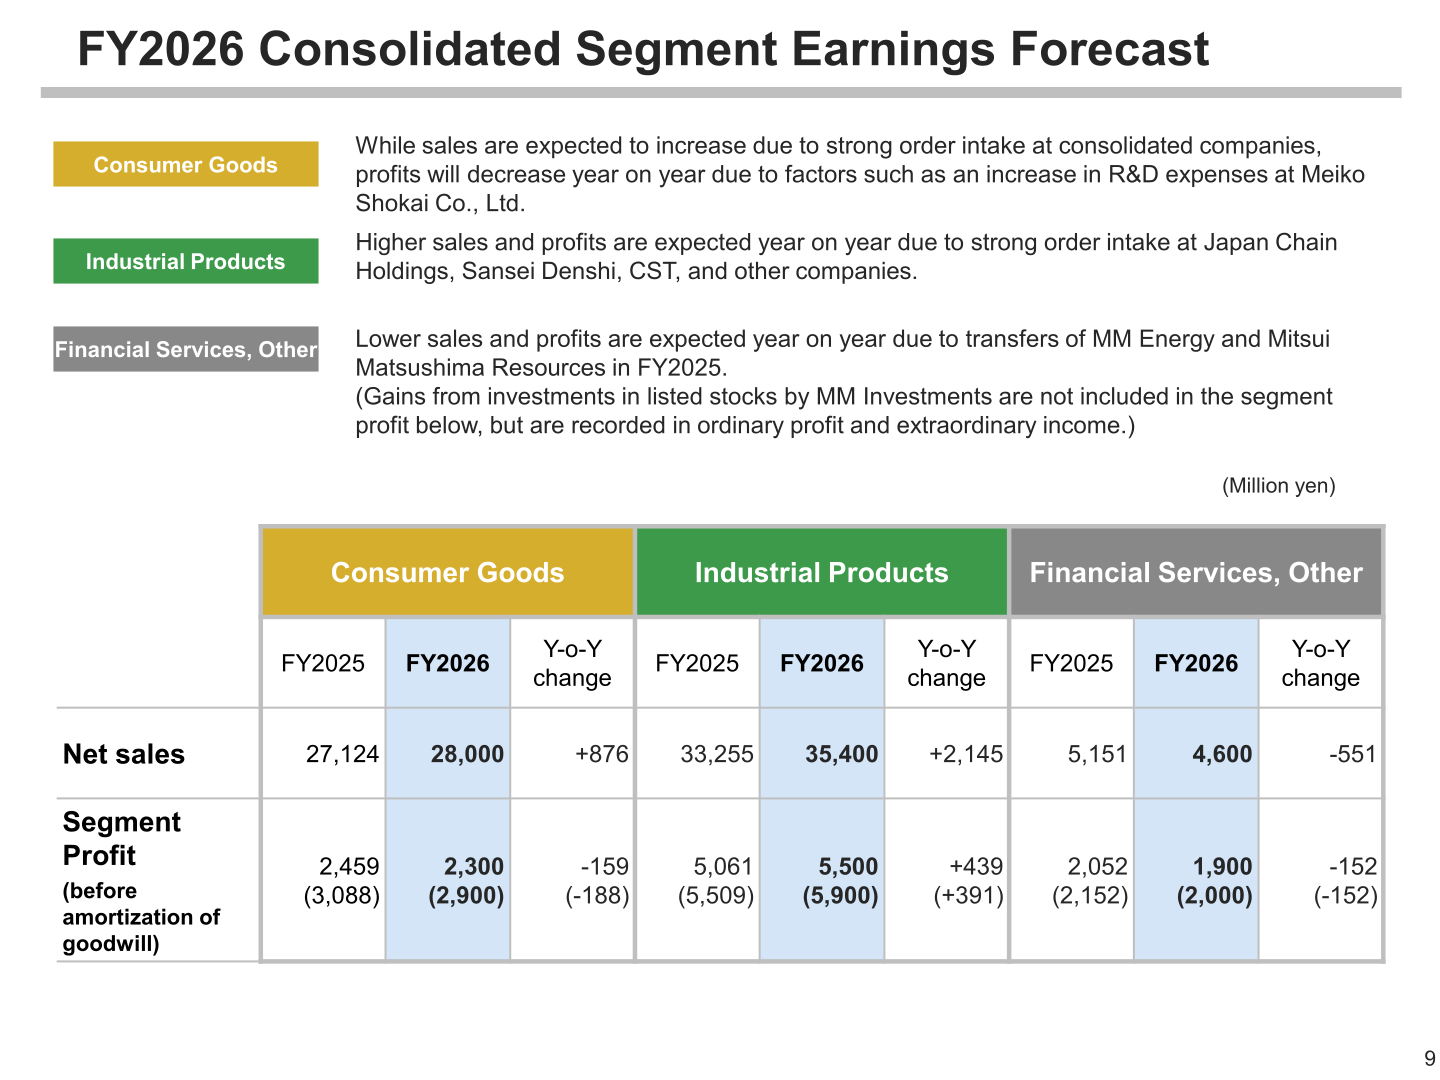
By segment, Consumer Goods sales are expected to increase due to strong order intake at consolidated companies, while profits will decrease year on year due to factors such as an increase in R&D expenses at Meiko Shokai Co., Ltd. Industrial Products is expected to post higher sales and profits on strong order intake at Japan Chain Holdings, Sansei Denshi, CST and other companies. Financial Services, Other is expected to post lower sales and profits year on year due to transfers of MM Energy and Mitsui Matsushima Resources in FY2025.
| Segment (Million yen) | Metric | FY2025 | FY2026 | Y-o-Y change |
|---|---|---|---|---|
| Consumer Goods | Net sales | 27,124 | 28,000 | +876 |
| Consumer Goods | Segment profit | 2,459 | 2,300 | -159 |
| Consumer Goods | Segment profit (before amortization of goodwill) | (3,088) | (2,900) | (-188) |
| Industrial Products | Net sales | 33,255 | 35,400 | +2,145 |
| Industrial Products | Segment profit | 5,061 | 5,500 | +439 |
| Industrial Products | Segment profit (before amortization of goodwill) | (5,509) | (5,900) | (+391) |
| Financial Services, Other | Net sales | 5,151 | 4,600 | -551 |
| Financial Services, Other | Segment profit | 2,052 | 1,900 | -152 |
| Financial Services, Other | Segment profit (before amortization of goodwill) | (2,152) | (2,000) | (-152) |
Shareholder Returns
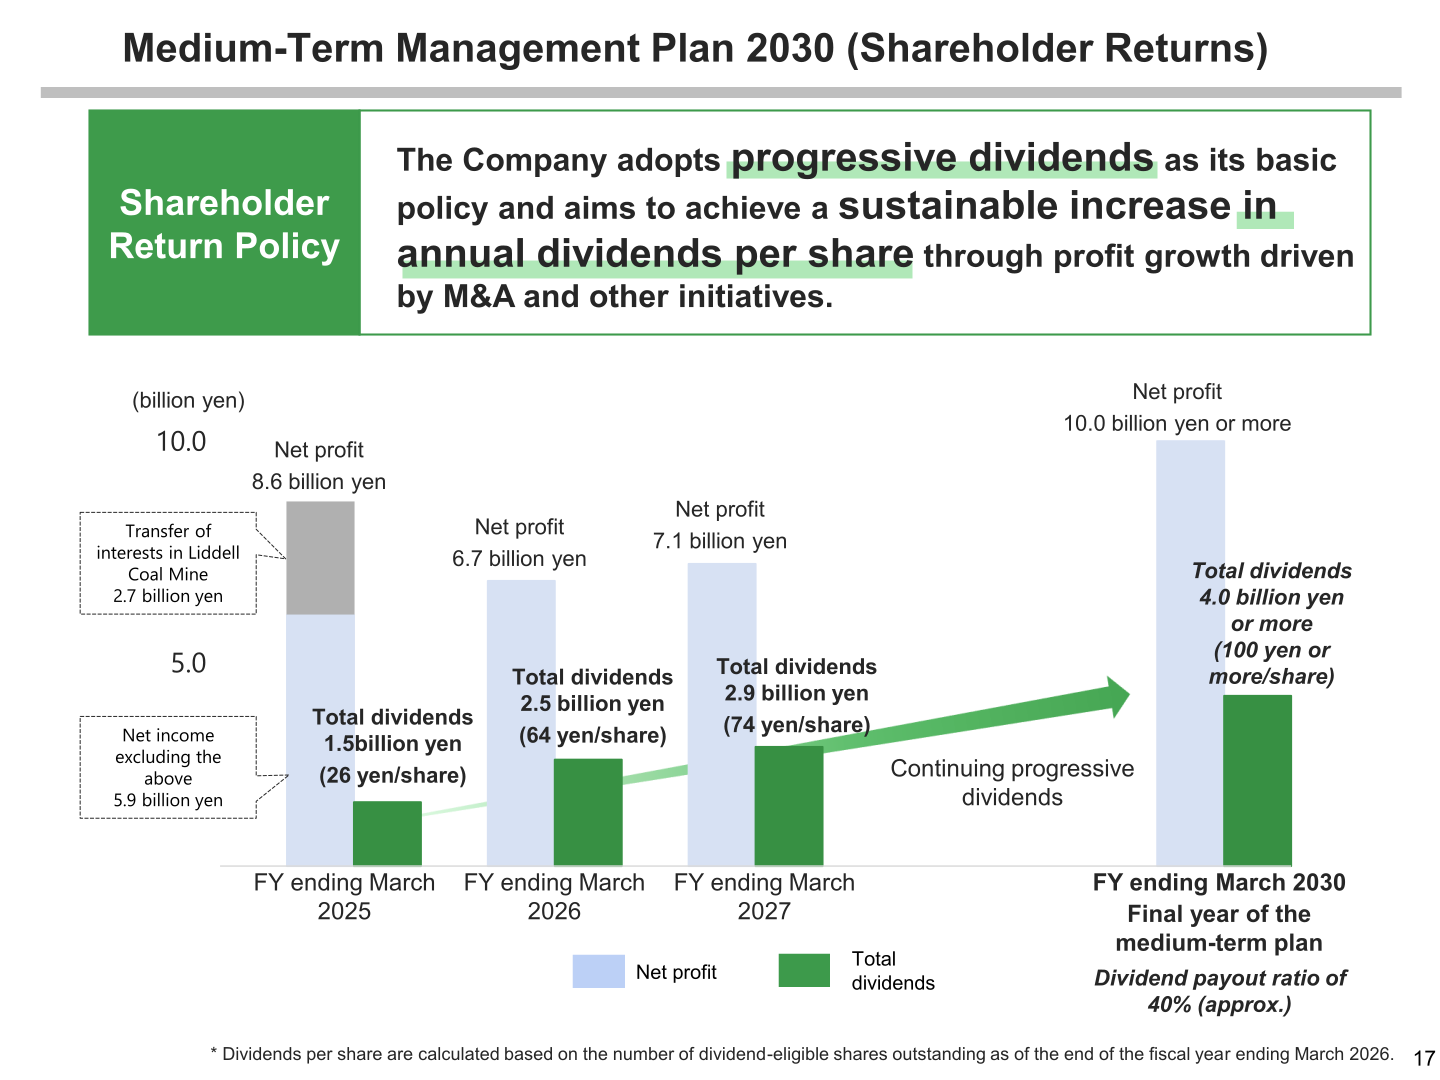
The Company adopts progressive dividends as its basic policy and aims to achieve a sustainable increase in annual dividends per share through profit growth driven by M&A and other initiatives. For the fiscal year ending March 2030, the final year of the medium-term plan, the Company indicates total dividends of 4.0 billion yen or more (100 yen or more per share) with a dividend payout ratio of approximately 40%. Dividends per share on the slide are calculated based on the number of dividend-eligible shares outstanding as of the end of the fiscal year ending March 2026.
| Fiscal year | Net profit | Total dividends | Dividend per share |
|---|---|---|---|
| FY ending March 2025 | 8.6 billion yen | 1.5 billion yen | 26 yen/share |
| FY ending March 2026 | 6.7 billion yen | 2.5 billion yen | 64 yen/share |
| FY ending March 2027 | 7.1 billion yen | 2.9 billion yen | 74 yen/share |
| FY ending March 2030 | 10.0 billion yen or more | 4.0 billion yen or more | 100 yen or more/share |
For the fiscal year ending March 2025, net profit of 8.6 billion yen comprised the transfer of interests in the Liddell Coal Mine of 2.7 billion yen and net income excluding the above of 5.9 billion yen. Separately, the Company also implemented a Shareholder Benefit Program for shareholders listed on the shareholders’ register as of March 31, 2026, offering KMT premium pet food tickets, restaurant complimentary tickets (3,000 yen per ticket) and HANABISHI product complimentary tickets.
Review of “Management Strategy 2024”
The Company states that “Management Strategy 2024,” announced in May 2024, was achieved one year ahead of schedule through steady implementation of M&A investments and capital policies. The plan called for actively allocating net cash and deposits (21.6 billion yen as of the end of FY2023) to M&A or shareholder returns (acquisition of own shares and dividends) over the following three years to maximize equity value per share; by March 2026, M&A investments of 14 billion yen and shareholder returns of 24.7 billion yen had been implemented. It also called for building an earnings structure through M&A capable of continuously posting net income of 5 billion yen or more by the fiscal year ending March 2027; net profit exceeded 5 billion yen in both the fiscal years ended March 2025 and March 2026. The Company set its sights toward PBR of 1x or above and ROE of 8% or above. During the previous medium-term management plan period, active M&A investments in market-leading niche companies primarily in the manufacturing sector established a stable business portfolio to replace the coal business, which concluded in the fiscal year ended March 2024.
Medium-Term Management Plan 2030
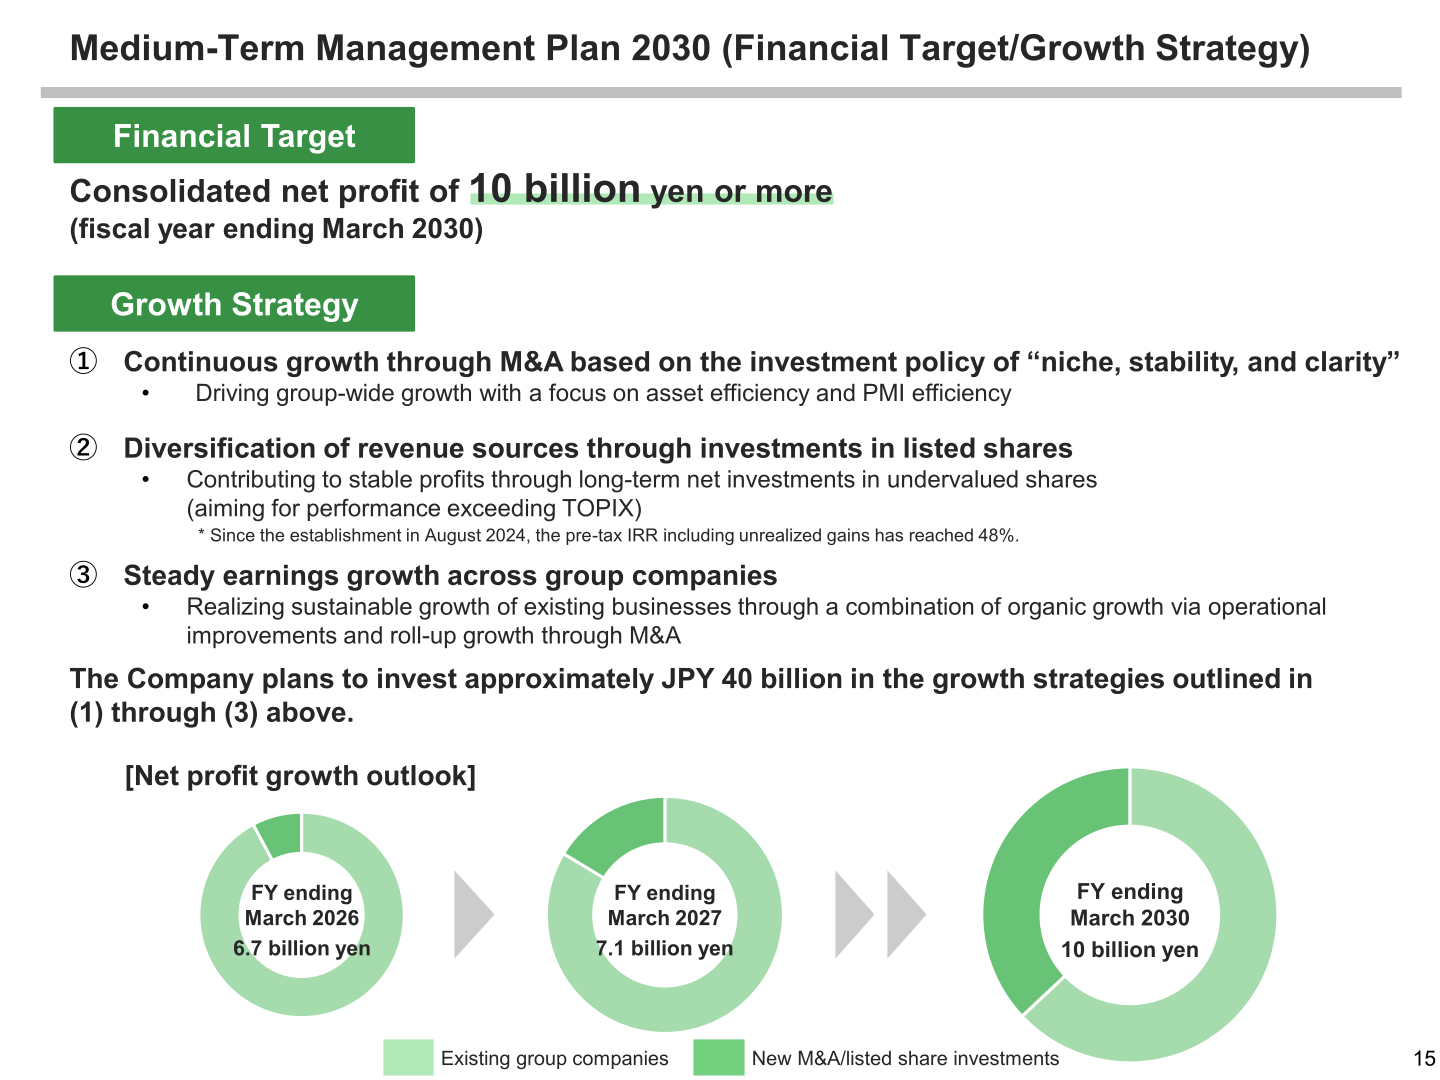
Under the new medium-term plan (2026–2030), the Company aims to become “a corporate group that protects and nurtures Japanese manufacturing for the next 100 years” by promoting M&A of market-leading niche companies with distinctive and reliable technological capabilities. The financial target is consolidated net profit of 10 billion yen or more in the fiscal year ending March 2030, against 6.7 billion yen in the fiscal year ended March 2026 and 7.1 billion yen planned for the fiscal year ending March 2027. The growth strategy has three pillars: continuous growth through M&A based on the investment policy of “niche, stability, and clarity”; diversification of revenue sources through investments in listed shares via long-term net investments in undervalued shares, aiming for performance exceeding TOPIX; and steady earnings growth across group companies combining organic growth via operational improvements with roll-up growth through M&A. The Company plans to invest approximately JPY 40 billion in these growth strategies, supported by an in-house M&A professional team that receives more than 150 deal opportunities annually and has a track record of more than 10 M&A transactions.
This article is an analysis based on publicly available information and is not a recommendation to buy or sell any specific securities. Investment decisions are your own responsibility.
![[Obayashi] Investors’ Guide 2026 — The Complete 24-Article Breakdown](https://japan-equity.com/wp-content/uploads/2026/07/hub_cover-1024x1024.png)
![[Obayashi] IR & SR Policy — Feeding Dialogue Back into Management](https://japan-equity.com/wp-content/uploads/2026/07/p32_sq-1024x1024.jpg)
![[Obayashi] Domestic Civil Engineering — Resilience Spending Supports 9.6% Margin](https://japan-equity.com/wp-content/uploads/2026/07/p11_sq-1024x1024.jpg)
![[Obayashi] Overseas Construction — Orders Reach ¥1.2tn](https://japan-equity.com/wp-content/uploads/2026/07/p15_sq-1024x1024.jpg)
![[Obayashi] Share Price & External Ratings — vs TOPIX, ESG Index Inclusion](https://japan-equity.com/wp-content/uploads/2026/07/p40_sq-1024x1024.jpg)
![[Construction] ¥75.5tn Investment, Shrinking Workforce — Big-5 Market Share](https://japan-equity.com/wp-content/uploads/2026/07/p12_sq-1024x1024.jpg)



![[Obayashi] Capital Policy & Shareholder Returns — ROE 10%+, DOE ~5%, ¥100bn Buyback](https://japan-equity.com/wp-content/uploads/2026/07/p27_sq-1024x1024.jpg)
![[Obayashi] Reducing Cross-Shareholdings — ¥285.2bn Sold in Five Years](https://japan-equity.com/wp-content/uploads/2026/07/p29_sq-1024x1024.jpg)
![[Obayashi] ¥750bn Investment Plan — ¥300bn to Development, ¥190bn to Tech/DX](https://japan-equity.com/wp-content/uploads/2026/07/p30_sq-1024x1024.jpg)
![[Obayashi] MTP2022 KPIs — Operating Profit ~2x Target, ROE 14.4%](https://japan-equity.com/wp-content/uploads/2026/07/p25_sq-1024x1024.jpg)
![[Obayashi] Cash Allocation — ¥420bn Investment CF Over Five Years](https://japan-equity.com/wp-content/uploads/2026/07/p26_sq-1024x1024.jpg)
![[Obayashi] Green Energy — 44 Plants, 344MW, and the Green Hydrogen Challenge](https://japan-equity.com/wp-content/uploads/2026/07/p21_sq-1024x1024.jpg)
![[Obayashi] Tackling the Labor Shortage — Robotics Construction®](https://japan-equity.com/wp-content/uploads/2026/07/p14_sq-1024x1024.jpg)
