
This article is based on publicly available IR materials and is not a recommendation to buy or sell any specific securities.
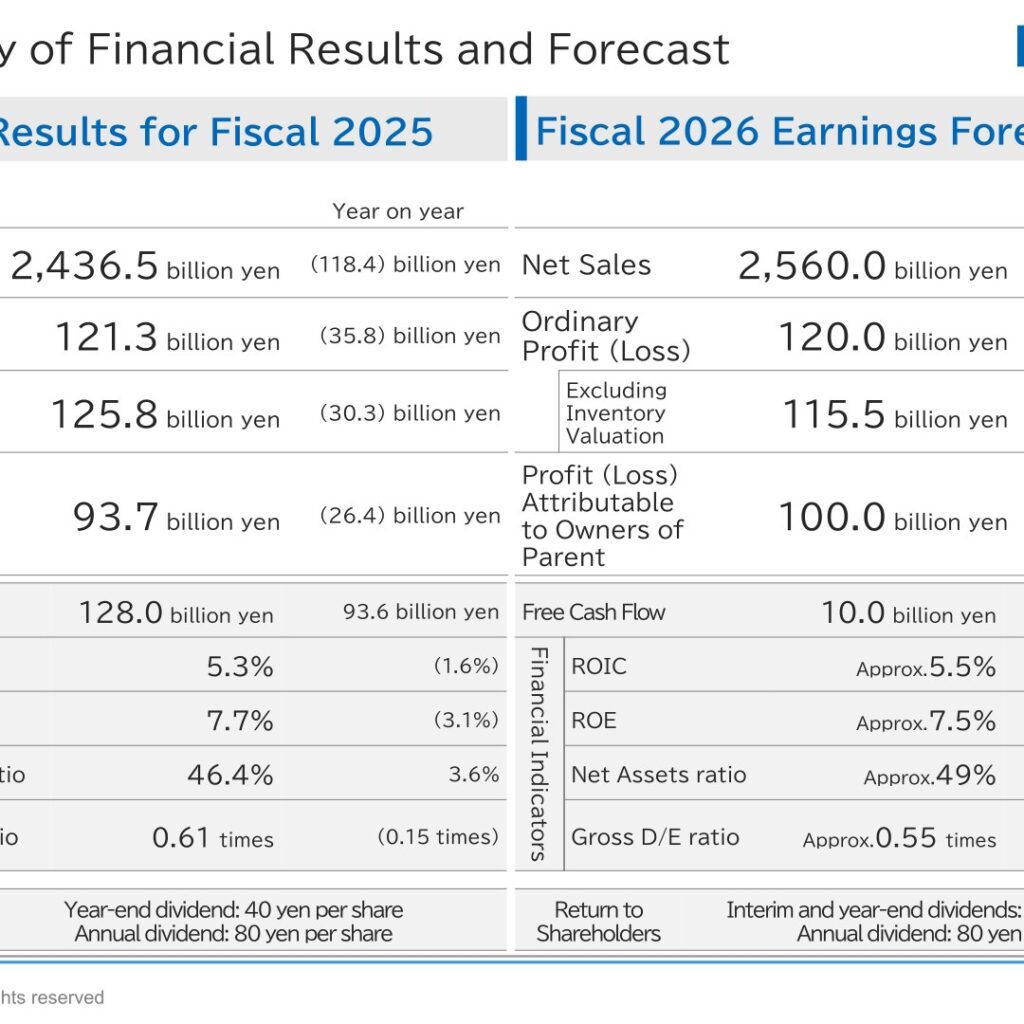
Kobe Steel, Ltd. reported net sales of 2,436.5 billion yen and an ordinary profit of 121.3 billion yen for fiscal 2025 (the fiscal year ended March 31, 2026). Despite the prolonged challenging demand environment, particularly in the materials businesses, the Company secured its ordinary profit supported by the machinery businesses, which delivered record-high profits. Profit attributable to owners of parent amounted to 93.7 billion yen, reflecting gains from the sale of strategic shareholdings and other assets, along with an impairment loss of 20.9 billion yen related to assets for manufacturing aluminum rolled products. ROIC was 5.3%.
Consolidated Results (Full-Year Actual)
Net sales decreased year on year due to a decline in unit selling prices in the steel and electric power segments, affected by lower prices of primary raw materials for steel production and thermal coal for power generation, as well as the extended statutory inspection period for the Kobe Power Plant No. 3 unit, among other factors. Ordinary profit decreased year on year due to several factors, including cost increases centered on fixed costs, the elimination of compensation income in the construction machinery segment, the extended statutory inspection period for the Kobe Power Plant No. 3 unit in the electric power segment, and a deterioration in inventory valuation. Profit attributable to owners of parent decreased year on year from the record-high level of the previous fiscal year, due to a decline in ordinary profit, despite improvements in extraordinary income (losses).
| Item (Billions of yen unless noted) | FY2025 Actual | FY2024 Actual | Change |
|---|---|---|---|
| Net Sales | 2,436.5 | 2,555.0 | (118.4) |
| Operating Profit (Loss) | 129.8 | 158.7 | (28.8) |
| Ordinary Profit (Loss) | 121.3 | 157.1 | (35.8) |
| Ordinary Profit Excluding Inventory Valuation | 125.8 | 156.1 | (30.3) |
| Extraordinary Income (Losses) | (0.4) | (16.1) | 15.6 |
| Profit (Loss) Attributable to Owners of Parent | 93.7 | 120.1 | (26.4) |
| Free Cash Flow | 128.0 | 34.3 | 93.6 |
| ROIC | 5.3% | 6.9% | (1.6%) |
| ROE | 7.7% | 10.8% | (3.1%) |
| Net Assets ratio | 46.4% | 42.8% | 3.6% |
| Gross D/E ratio | 0.61 times | 0.76 times | (0.15 times) |
Extraordinary losses amounted to a loss of 0.4 billion yen due to the recording of impairment losses on non-current assets, despite gains on the sale of strategic shareholdings and land. Gain on sale of investment securities was 21.8 billion yen, including shares of Nippon Steel Corporation, and gain on sale of non-current assets was 7.0 billion yen from the sale of overseas land, while impairment loss on non-current assets was 24.1 billion yen and loss on sale of shares of subsidiaries and associates was 5.2 billion yen arising from the transfer of the special steel business of Nippon Koshuha Steel Co., Ltd. The impairment loss of 20.9 billion yen on assets used in manufacturing aluminum rolled products reflected a decline in profitability resulting from sluggish sales volumes of materials for automotive panels, as well as delays in passing on increased procurement costs.
Segment Results
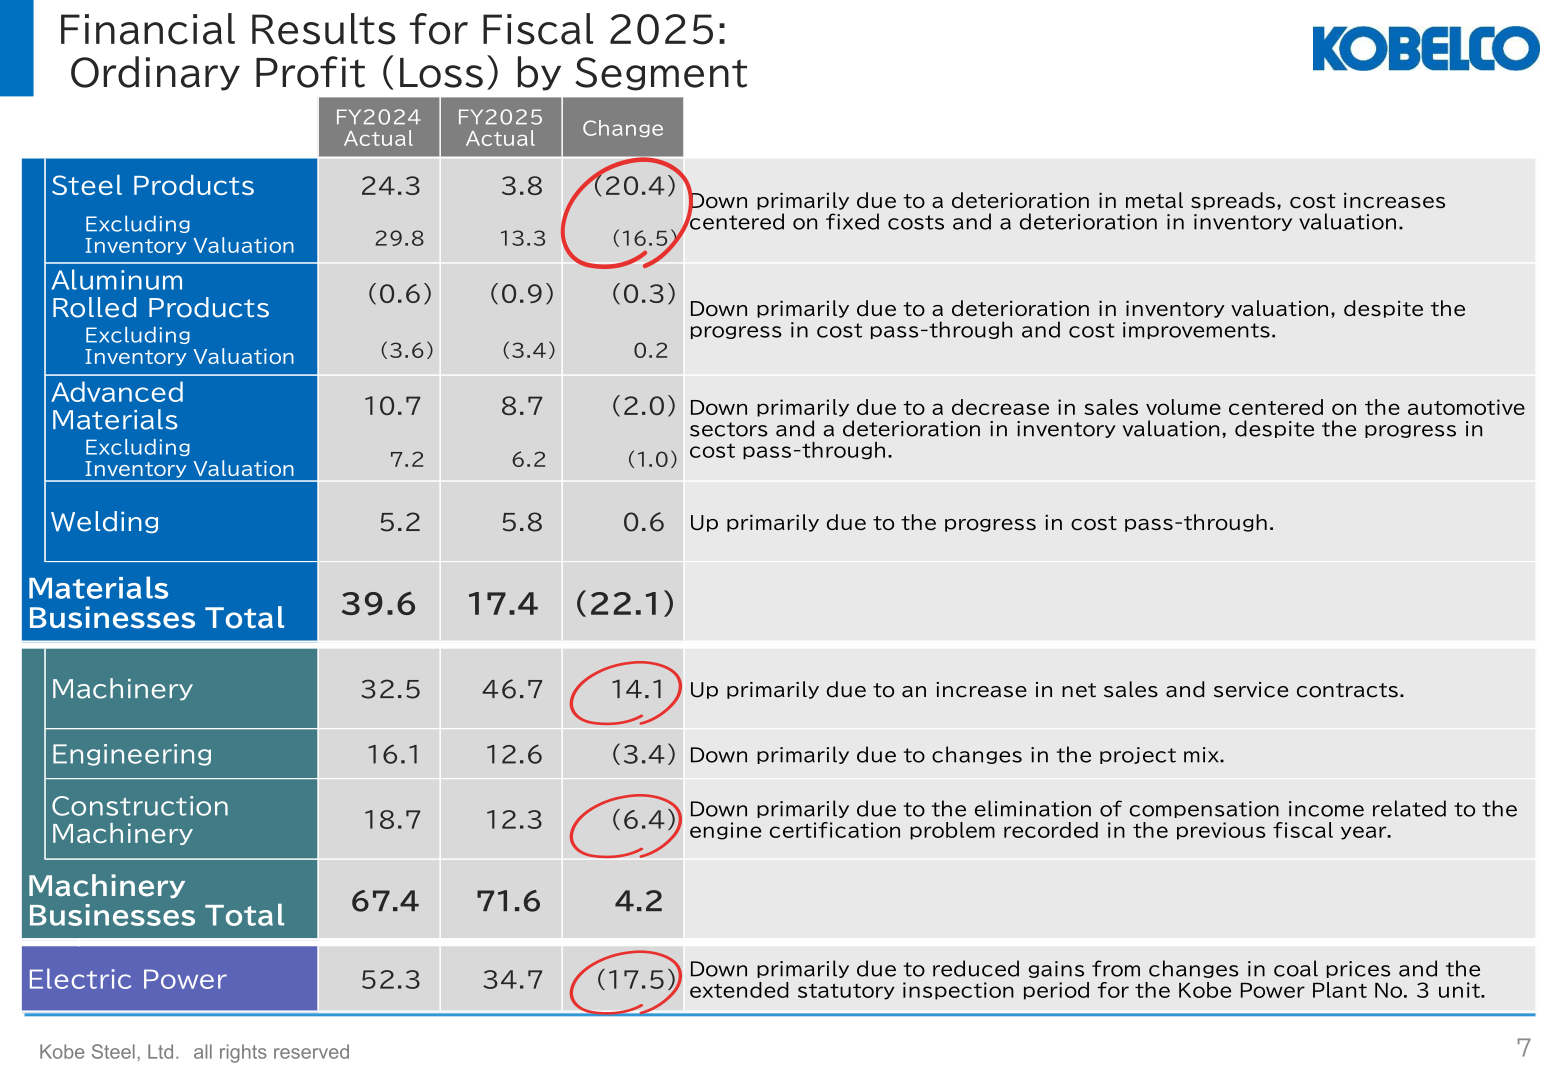
Ordinary profit in the materials businesses totaled 17.4 billion yen, down 22.1 billion yen year on year, while the machinery businesses totaled 71.6 billion yen, up 4.2 billion yen. Steel products fell primarily due to a deterioration in metal spreads, cost increases centered on fixed costs and a deterioration in inventory valuation. Machinery rose primarily due to an increase in net sales and service contracts. Electric power declined primarily due to reduced gains from changes in coal prices and the extended statutory inspection period for the Kobe Power Plant No. 3 unit.
| Business (Ordinary Profit, Billions of yen) | FY2025 Actual | FY2024 Actual | Change |
|---|---|---|---|
| Steel Products | 3.8 | 24.3 | (20.4) |
| Steel Products (Excluding Inventory Valuation) | 13.3 | 29.8 | (16.5) |
| Aluminum Rolled Products | (0.9) | (0.6) | (0.3) |
| Aluminum Rolled Products (Excluding Inventory Valuation) | (3.4) | (3.6) | 0.2 |
| Advanced Materials | 8.7 | 10.7 | (2.0) |
| Advanced Materials (Excluding Inventory Valuation) | 6.2 | 7.2 | (1.0) |
| Welding | 5.8 | 5.2 | 0.6 |
| Materials Businesses Total | 17.4 | 39.6 | (22.1) |
| Machinery | 46.7 | 32.5 | 14.1 |
| Engineering | 12.6 | 16.1 | (3.4) |
| Construction Machinery | 12.3 | 18.7 | (6.4) |
| Machinery Businesses Total | 71.6 | 67.4 | 4.2 |
| Electric Power | 34.7 | 52.3 | (17.5) |
On a reportable segment basis, net sales were 996.9 billion yen in Steel & Aluminum, 332.8 billion yen in Advanced Materials, 96.4 billion yen in Welding, 282.7 billion yen in Machinery, 193.8 billion yen in Engineering, 389.5 billion yen in Construction Machinery and 203.2 billion yen in Electric Power. In the steel products business, crude steel production was 5.81 million tons and the sales volume of steel products was 4.63 million tons, with an average steel selling price of 133 thousand yen per ton. Sales volume of aluminum rolled products was 263 thousand tons, and unit sales of hydraulic excavators were 21.0 thousand units.
Forecast for Fiscal 2026
The demand environment, excluding the impact of the Middle East situation, is expected to remain generally at a level similar to fiscal 2025. Based on the assumption that current conditions in the Middle East persist through the end of the first half, the Company factors in an earnings risk of approximately 10.0 billion yen, reflecting anticipated lower regional sales and cost increases resulting from higher crude oil prices; the potential risks identified carry an annual impact of negative 20.0 billion yen. Sales to the Middle East account for only about 1% of consolidated net sales (fiscal 2025 actual). Ordinary profit, profit attributable to owners of parent, and ROIC are all expected to remain similar to fiscal 2025 levels at 120.0 billion yen, 100.0 billion yen, and approximately 5.5%, respectively.
| Item (Billions of yen unless noted) | FY2026 Forecast | FY2025 Actual | Change |
|---|---|---|---|
| Net Sales | 2,560.0 | 2,436.5 | 123.4 |
| Operating Profit (Loss) | 150.0 | 129.8 | 20.1 |
| Ordinary Profit (Loss) | 120.0 | 121.3 | (1.3) |
| Ordinary Profit Excluding Inventory Valuation | 115.5 | 125.8 | (10.3) |
| Extraordinary Income (Losses) | 10.0 | (0.4) | 10.4 |
| Profit (Loss) Attributable to Owners of Parent | 100.0 | 93.7 | 6.2 |
| Free Cash Flow | 10.0 | 128.0 | (118.0) |
| ROIC | Approx.5.5% | 5.3% | 0.2% |
| ROE | Approx.7.5% | 7.7% | (0.2%) |
| Net Assets ratio | Approx.49% | 46.4% | 2.6% |
| Gross D/E ratio | Approx.0.55 times | 0.61 times | (0.06 times) |
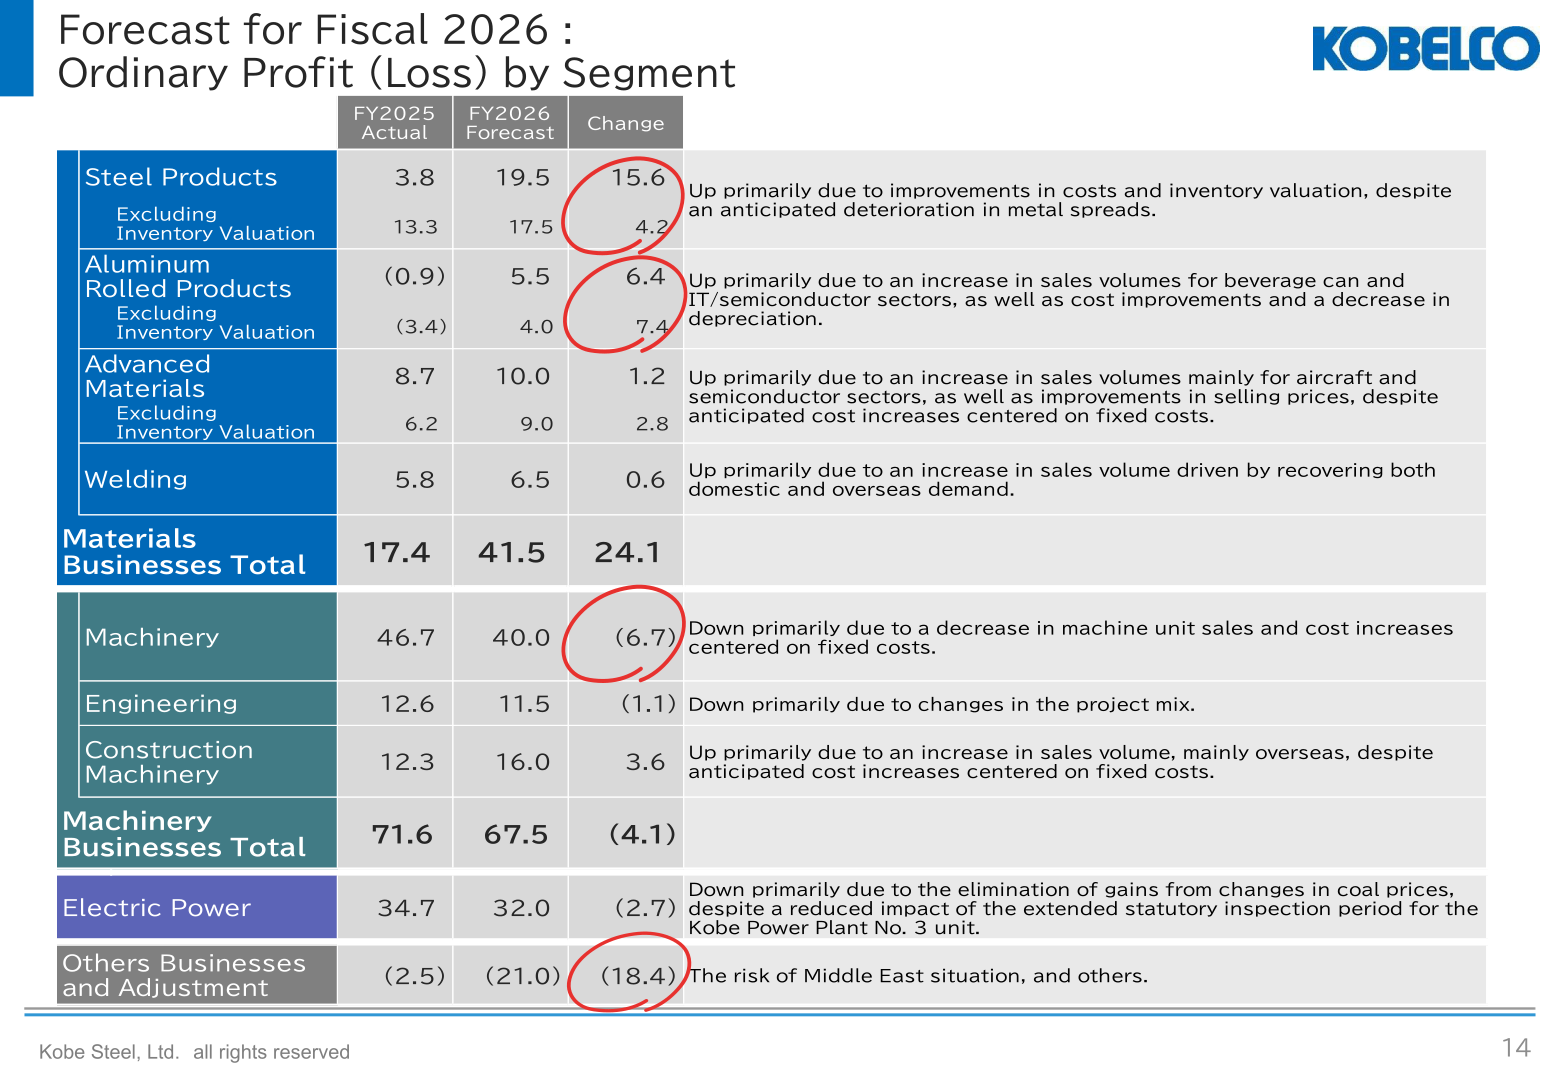
By business, ordinary profit in the materials businesses is forecast to rise to 41.5 billion yen, an increase of 24.1 billion yen, led by steel products at 19.5 billion yen and aluminum rolled products at 5.5 billion yen. The machinery businesses are forecast at 67.5 billion yen, down 4.1 billion yen, as machinery declines to 40.0 billion yen on a decrease in machine unit sales and cost increases centered on fixed costs, while construction machinery rises to 16.0 billion yen on an increase in sales volume, mainly overseas. Electric power is forecast at 32.0 billion yen, and other businesses and adjustment at negative 21.0 billion yen, reflecting the risk of the Middle East situation and others.
Financial Position and Cash Flow
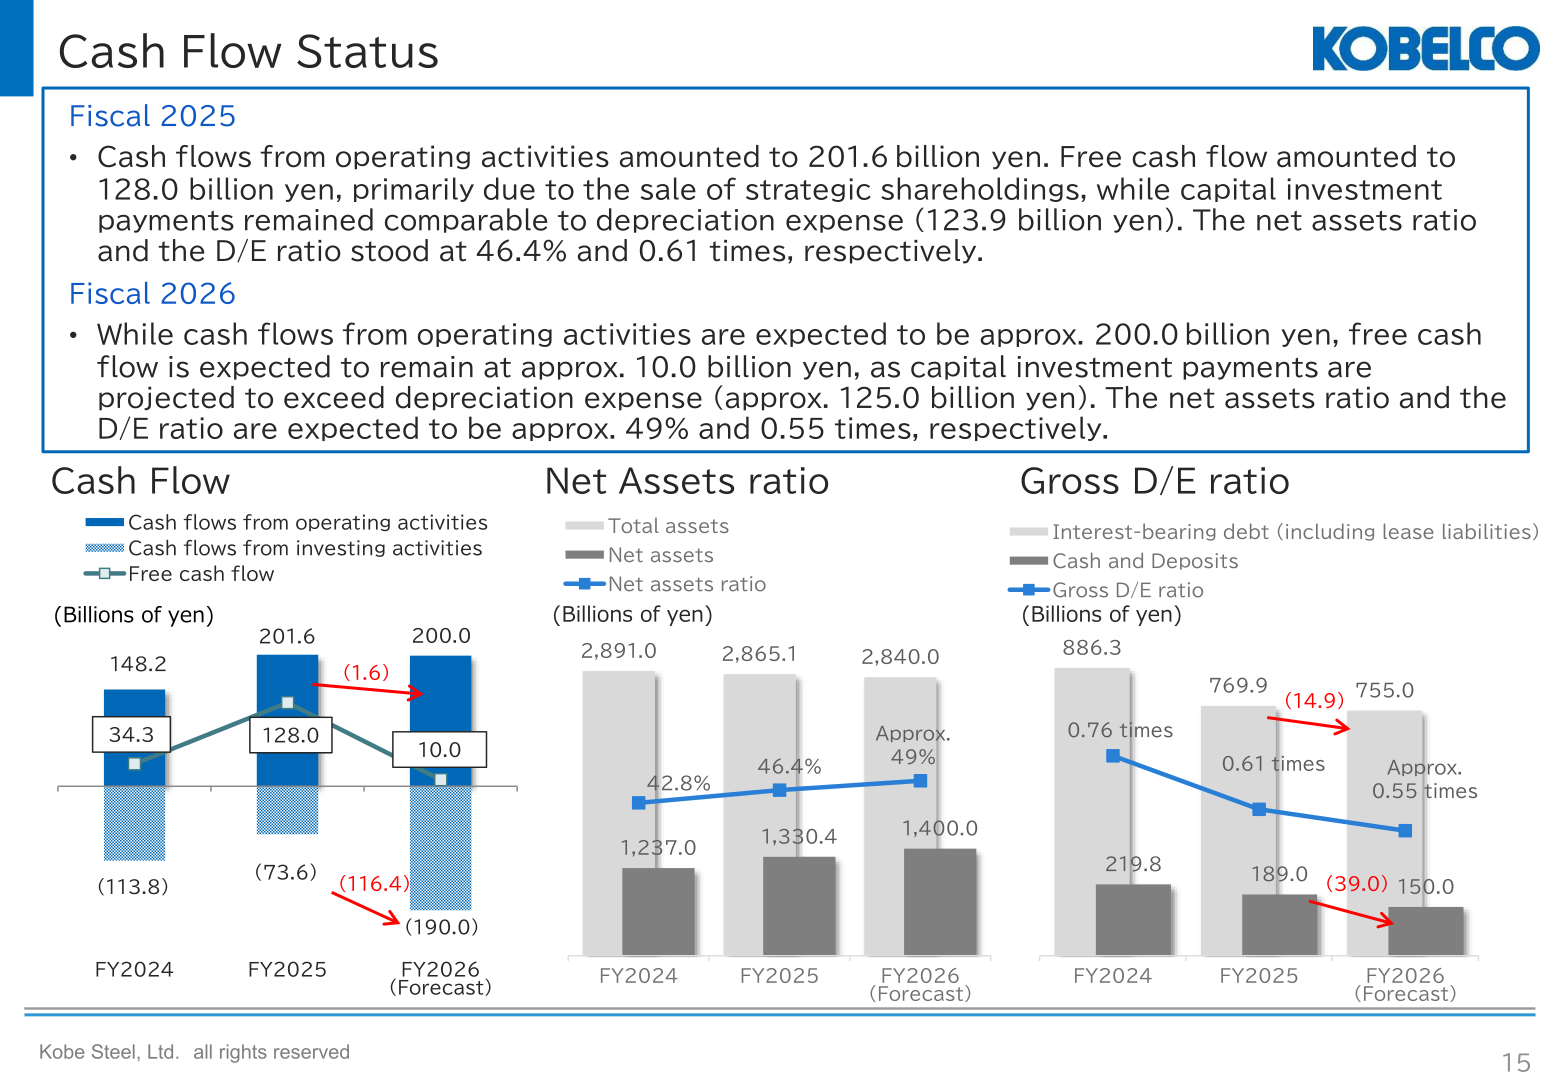
Cash flows from operating activities amounted to 201.6 billion yen in fiscal 2025. Free cash flow amounted to 128.0 billion yen, primarily due to the sale of strategic shareholdings, while capital investment payments remained comparable to depreciation expense (123.9 billion yen). Interest-bearing debt (including lease liabilities) declined to 769.9 billion yen and cash and deposits stood at 189.0 billion yen. Profit (loss) per share was 237.80 yen in fiscal 2025 and is forecast at 251.80 yen for fiscal 2026. For fiscal 2026, while cash flows from operating activities are expected to be approx. 200.0 billion yen, free cash flow is expected to remain at approx. 10.0 billion yen, as capital investment payments are projected to exceed depreciation expense (approx. 125.0 billion yen). The Company will continue to maintain financial discipline and prepare for future investments focused on growth and achieving carbon neutrality.
Shareholder Returns
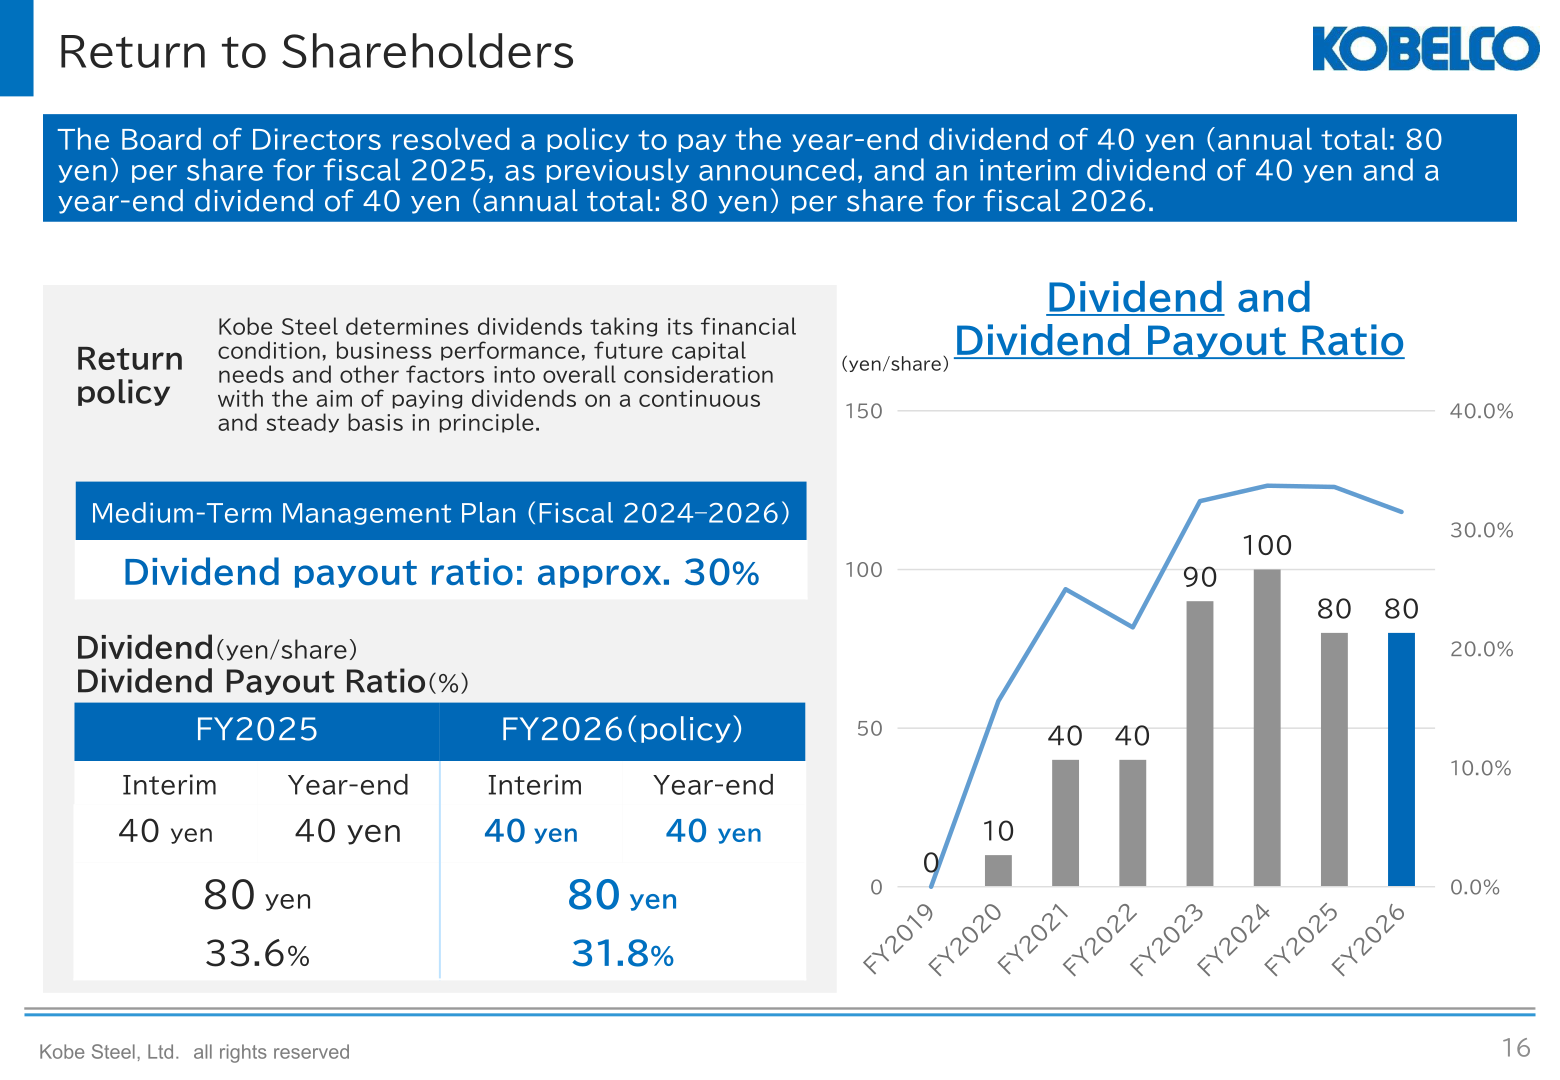
The Board of Directors resolved a policy to pay the year-end dividend of 40 yen (annual total: 80 yen) per share for fiscal 2025, as previously announced, and an interim dividend of 40 yen and a year-end dividend of 40 yen (annual total: 80 yen) per share for fiscal 2026. Kobe Steel determines dividends taking its financial condition, business performance, future capital needs and other factors into overall consideration with the aim of paying dividends on a continuous and steady basis in principle.
| Item | FY2025 | FY2026 (policy) |
|---|---|---|
| Interim dividend | 40 yen | 40 yen |
| Year-end dividend | 40 yen | 40 yen |
| Annual dividend | 80 yen | 80 yen |
| Dividend payout ratio | 33.6% | 31.8% |
Medium-Term Plan and Topics
Under the Medium-Term Management Plan (Fiscal 2024-2026), the Company targets a dividend payout ratio of approx. 30%. The fiscal 2026 net assets ratio of approximately 49% and D/E ratio of approximately 0.55 times are both in line with the targets set under the current Medium-Term Management Plan. Exchange rate assumptions for fiscal 2026 are 150.0 yen to the U.S. dollar, 21.0 yen to the Chinese yuan and 175.0 yen to the euro. On raw materials, the iron ore price for fiscal 2026 1Q has been settled at $96, with the level for 2Q onward assumed to be similar; coking coal and thermal coal price levels for fiscal 2026 are assumed to slightly decline from the current level. In external evaluations, the Company received an ‘A’ rating in the CDP climate change category and received the ‘Excellence Award’ for the first time in the NIKKEI Integrated Report Award.
This article is an analysis based on publicly available information and is not a recommendation to buy or sell any specific securities. Investment decisions are your own responsibility.
![[Obayashi] Investors’ Guide 2026 — The Complete 24-Article Breakdown](https://japan-equity.com/wp-content/uploads/2026/07/hub_cover-1024x1024.png)
![[Obayashi] IR & SR Policy — Feeding Dialogue Back into Management](https://japan-equity.com/wp-content/uploads/2026/07/p32_sq-1024x1024.jpg)
![[Obayashi] Domestic Civil Engineering — Resilience Spending Supports 9.6% Margin](https://japan-equity.com/wp-content/uploads/2026/07/p11_sq-1024x1024.jpg)
![[Obayashi] Overseas Construction — Orders Reach ¥1.2tn](https://japan-equity.com/wp-content/uploads/2026/07/p15_sq-1024x1024.jpg)
![[Obayashi] Share Price & External Ratings — vs TOPIX, ESG Index Inclusion](https://japan-equity.com/wp-content/uploads/2026/07/p40_sq-1024x1024.jpg)
![[Construction] ¥75.5tn Investment, Shrinking Workforce — Big-5 Market Share](https://japan-equity.com/wp-content/uploads/2026/07/p12_sq-1024x1024.jpg)



![[Obayashi] Capital Policy & Shareholder Returns — ROE 10%+, DOE ~5%, ¥100bn Buyback](https://japan-equity.com/wp-content/uploads/2026/07/p27_sq-1024x1024.jpg)
![[Obayashi] Reducing Cross-Shareholdings — ¥285.2bn Sold in Five Years](https://japan-equity.com/wp-content/uploads/2026/07/p29_sq-1024x1024.jpg)
![[Obayashi] ¥750bn Investment Plan — ¥300bn to Development, ¥190bn to Tech/DX](https://japan-equity.com/wp-content/uploads/2026/07/p30_sq-1024x1024.jpg)
![[Obayashi] MTP2022 KPIs — Operating Profit ~2x Target, ROE 14.4%](https://japan-equity.com/wp-content/uploads/2026/07/p25_sq-1024x1024.jpg)
![[Obayashi] Cash Allocation — ¥420bn Investment CF Over Five Years](https://japan-equity.com/wp-content/uploads/2026/07/p26_sq-1024x1024.jpg)
![[Obayashi] Green Energy — 44 Plants, 344MW, and the Green Hydrogen Challenge](https://japan-equity.com/wp-content/uploads/2026/07/p21_sq-1024x1024.jpg)
![[Obayashi] Tackling the Labor Shortage — Robotics Construction®](https://japan-equity.com/wp-content/uploads/2026/07/p14_sq-1024x1024.jpg)
