
This article is based on publicly available IR materials and is not a recommendation to buy or sell any specific securities.
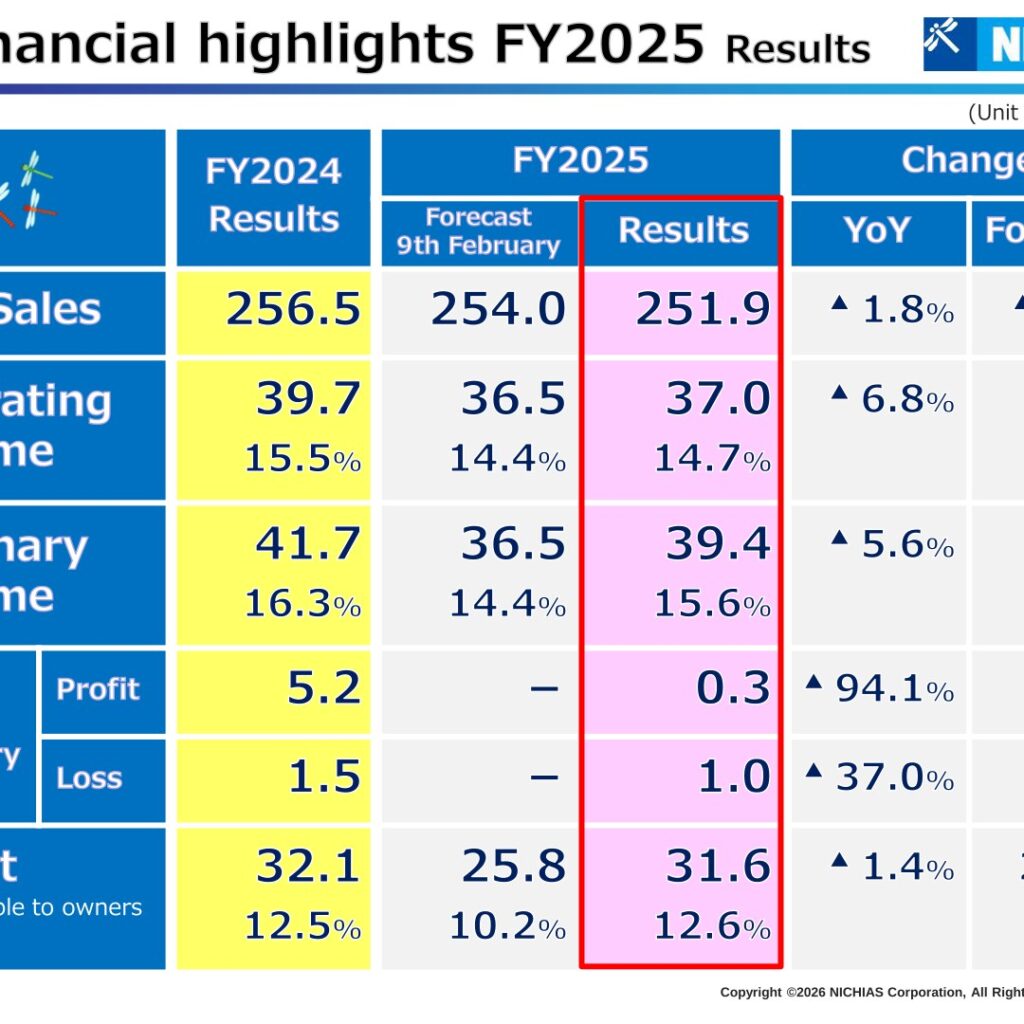
NICHIAS Corporation reported FY2025 (1st April, 2025 to 31st March, 2026) net sales of 251.9 billion JPY, down 1.8% year on year, with operating income of 37.0 billion JPY (▲6.8%), ordinary income of 39.4 billion JPY (▲5.6%) and profit attributable to owners of parent of 31.6 billion JPY (▲1.4%). Net sales and operating income came in below the prior year as the Advanced products segment was hit by semiconductor-related weakness, while the Auto parts and Building materials segments improved. The company describes the year as “largely solid landing” amid growing opacity and uncertainty, and results for operating income, ordinary income and net profit all exceeded the 9th February forecast. For FY2026 the company forecasts record-high results, guiding to net sales of 270.0 billion JPY and operating income of 45.0 billion JPY.
Consolidated Results (Full-Year Actual)
Against the 9th February forecast, net sales fell short by 0.8% while operating income beat by 1.4%, ordinary income by 7.9% and profit attributable to owners of parent by 22.6%. Extraordinary profit dropped to 0.3 billion JPY from 5.2 billion JPY, and extraordinary loss narrowed to 1.0 billion JPY from 1.5 billion JPY. Percentages shown in parentheses are margins on net sales as presented in the materials.
| Item (Unit: billion JPY) | FY2024 Results | FY2025 Forecast (9th February) | FY2025 Results | Change YoY | Change vs Forecast |
|---|---|---|---|---|---|
| Net Sales | 256.5 | 254.0 | 251.9 | ▲ 1.8% | ▲ 0.8% |
| Operating income | 39.7 (15.5%) | 36.5 (14.4%) | 37.0 (14.7%) | ▲ 6.8% | 1.4% |
| Ordinary income | 41.7 (16.3%) | 36.5 (14.4%) | 39.4 (15.6%) | ▲ 5.6% | 7.9% |
| Extraordinary Profit | 5.2 | - | 0.3 | ▲ 94.1% | - |
| Extraordinary Loss | 1.5 | - | 1.0 | ▲ 37.0% | - |
| Profit attributable to owners of parent | 32.1 (12.5%) | 25.8 (10.2%) | 31.6 (12.6%) | ▲ 1.4% | 22.6% |
On the change analysis for net sales, Advanced products (semiconductor-related) subtracted 5.5 billion JPY and Building materials 0.6 billion JPY, while Energy & Industrial plants added 1.0 billion JPY, Industrial products 0.1 billion JPY and Auto parts 0.3 billion JPY, for a total change of ▲4.6 billion JPY. On the operating income bridge, gross profit accounted for a decrease of 0.9 billion JPY and selling, general and administrative expenses for a decrease of 1.8 billion JPY, for a total change of ▲2.7 billion JPY.
The materials note that although the effective corporate tax rate would normally be around 30.6%, the FY2025 tax burden was reduced by subsidiary-related items totalling ¥3.5 billion in income tax reduction (Q3 ¥2.7 billion, Q4 ¥0.8 billion), bringing the effective tax rate for FY2025 to 18.0%. These items were a reduction in corporate tax due to the confirmed waiver of receivables from Kimitsu RW (domestic) and the recognition of deferred tax assets at NRI / Indonesia (overseas). Alongside foreign-exchange gains, the increase in net profit was largely driven by a reduction in corporate and other taxes.
Segment Results
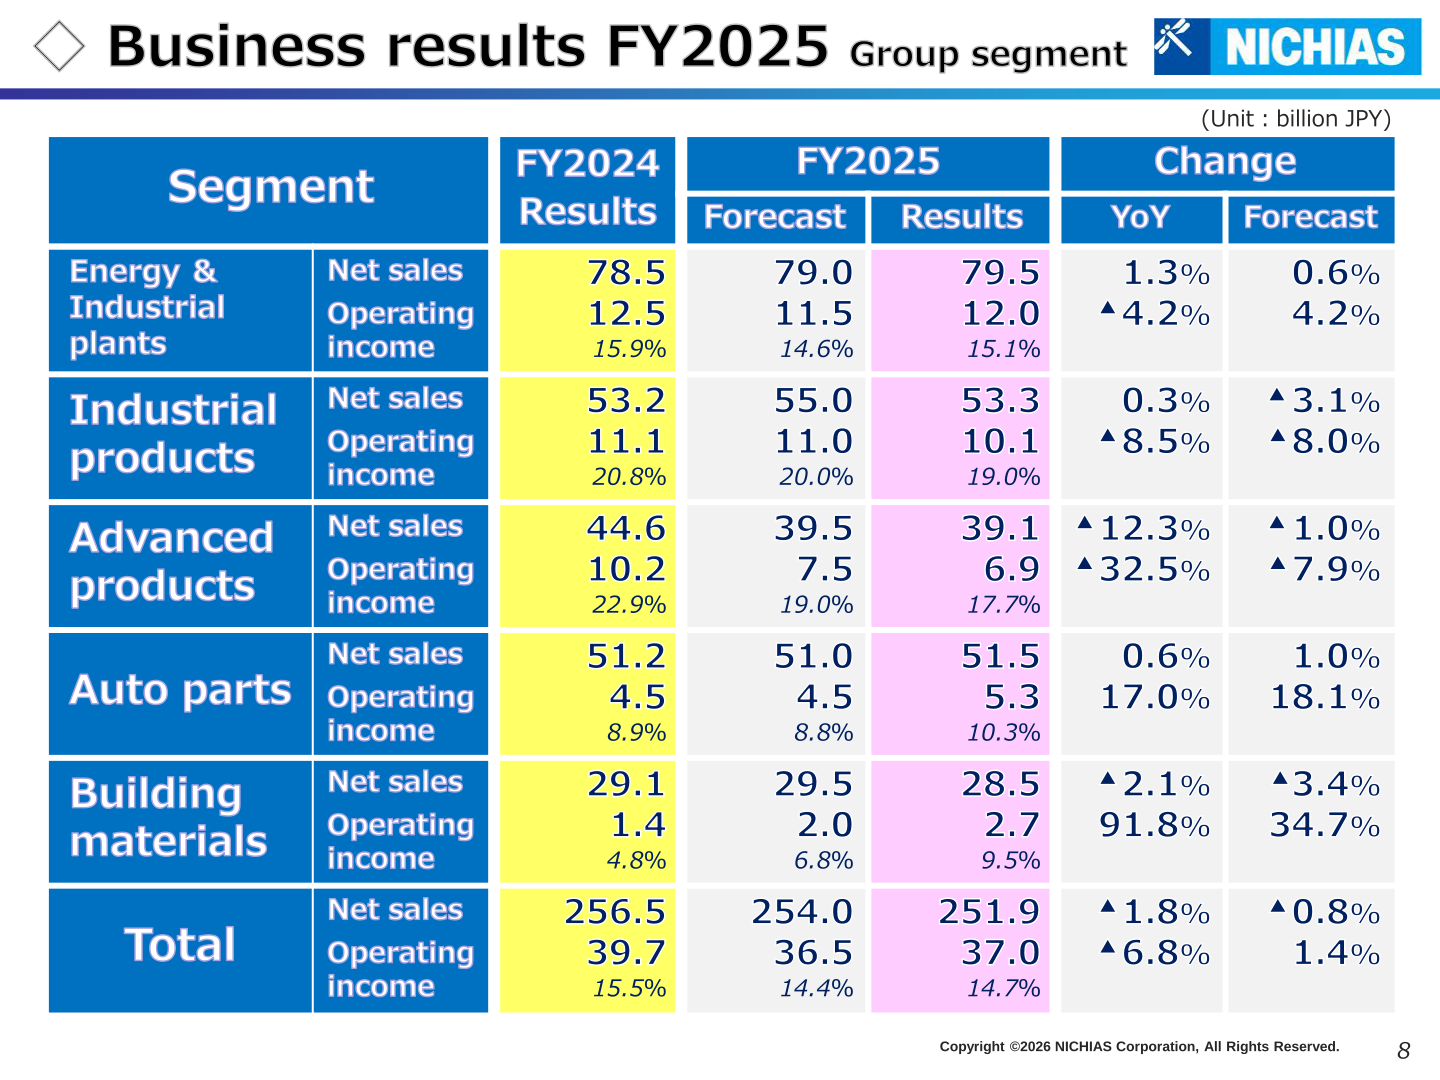
Advanced products was the weakest segment, with net sales down 12.3% and operating income down 32.5%. Building materials operating income nearly doubled (+91.8%) and Auto parts rose 17.0%, with both segments lifting their operating margins materially. Energy & Industrial plants and Industrial products grew sales slightly but saw operating income decline.
| Segment (Unit: billion JPY) | Metric | FY2024 Results | FY2025 Results | Change YoY |
|---|---|---|---|---|
| Energy & Industrial plants | Net sales | 78.5 | 79.5 | 1.3% |
| Energy & Industrial plants | Operating income | 12.5 (15.9%) | 12.0 (15.1%) | ▲ 4.2% |
| Industrial products | Net sales | 53.2 | 53.3 | 0.3% |
| Industrial products | Operating income | 11.1 (20.8%) | 10.1 (19.0%) | ▲ 8.5% |
| Advanced products | Net sales | 44.6 | 39.1 | ▲ 12.3% |
| Advanced products | Operating income | 10.2 (22.9%) | 6.9 (17.7%) | ▲ 32.5% |
| Auto parts | Net sales | 51.2 | 51.5 | 0.6% |
| Auto parts | Operating income | 4.5 (8.9%) | 5.3 (10.3%) | 17.0% |
| Building materials | Net sales | 29.1 | 28.5 | ▲ 2.1% |
| Building materials | Operating income | 1.4 (4.8%) | 2.7 (9.5%) | 91.8% |
| Total | Net sales | 256.5 | 251.9 | ▲ 1.8% |
| Total | Operating income | 39.7 (15.5%) | 37.0 (14.7%) | ▲ 6.8% |
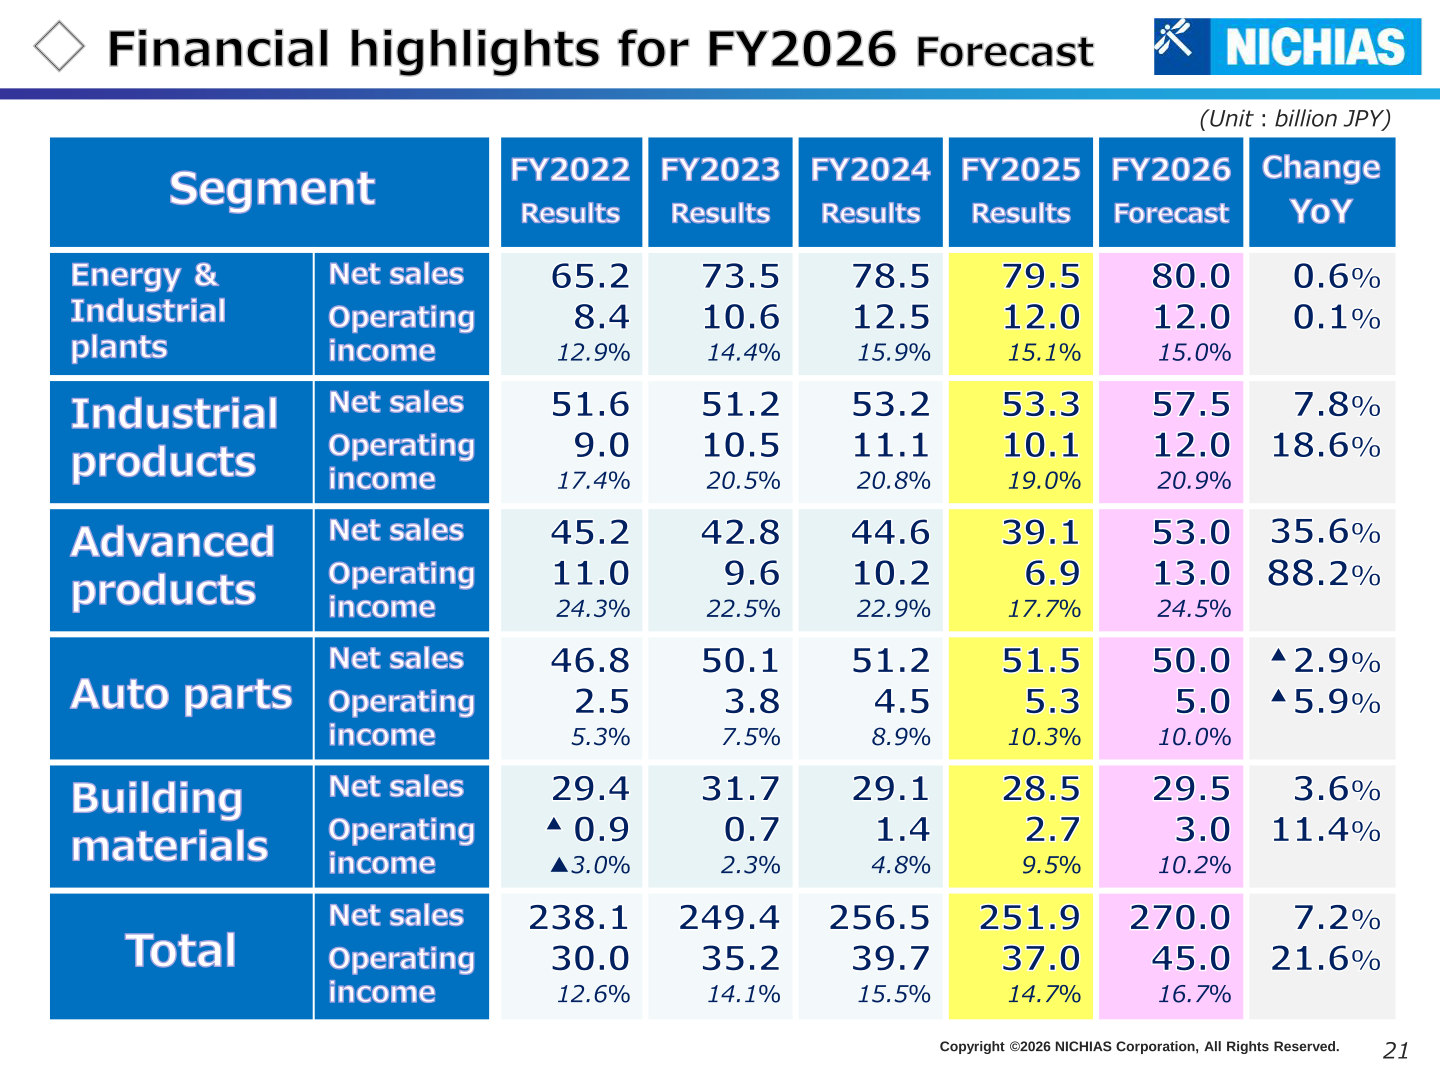
The materials highlight profitability improvement in the Auto parts and Building materials segments. In Auto parts, net sales moved 46.8 → 50.1 → 51.2 → 51.5 billion JPY over FY2022–FY2025 and operating income 2.5 (5.3%) → 3.8 (7.5%) → 4.5 (8.9%) → 5.3 (10.3%), with the FY2025 operating margin improving into the 10% range on consolidation and streamlining of production and sales bases. In Building materials, net sales moved 29.4 → 31.7 → 29.1 → 28.5 billion JPY and operating profit ▲0.9 (▲3.0%) → 0.7 (2.3%) → 1.4 (4.8%) → 2.7 (9.5%) on structural reform including withdrawal from, scaling back and consolidation of unprofitable products; the company states the 10% range is now within reach for the FY2026 operating margin.
Financial Position
Total assets rose to 307.1 billion JPY from 289.0 billion JPY, an increase of 18.1 billion JPY. The equity ratio improved from 74.5% to 77.7%. Equity stood at 238.5 billion JPY with interest-bearing liabilities of 12.8 billion JPY, an interest-bearing liability ratio of 4.2%. NICHIAS holds a JCR rating of A+ with a Stable outlook as of March 2026, an MSCI ESG Rating of A as of April 2026 (evaluated in the “Building Products” category), and CDP scores of B for Climate Change and B for Water Security in FY2025.
FY2026 Forecast
For FY2026 (1st April, 2026 to 31st March, 2027) the company forecasts record-high results, stating that despite prevailing opacity and uncertainty it is supported by the recovery in the semiconductor market. The profit plan includes ¥2.5 billion for new core system development costs.
| Item (Unit: billion JPY) | FY2025 Results | FY2026 H1 Forecast | FY2026 H2 Forecast | FY2026 Full year Forecast | Change YoY |
|---|---|---|---|---|---|
| Net Sales | 251.9 | 130.0 | 140.0 | 270.0 | 7.2% |
| Operating income | 37.0 (14.7%) | 20.5 (15.8%) | 24.5 (17.5%) | 45.0 (16.7%) | 21.6% |
| Ordinary income | 39.4 (15.6%) | 20.5 (15.8%) | 24.5 (17.5%) | 45.0 (16.7%) | 14.3% |
| Profit attributable to owners of parent | 31.6 (12.6%) | 14.5 (11.2%) | 17.5 (12.5%) | 32.0 (11.9%) | 1.2% |
| Segment (Unit: billion JPY) | Metric | FY2025 Results | FY2026 Forecast | Change YoY |
|---|---|---|---|---|
| Energy & Industrial plants | Net sales | 79.5 | 80.0 | 0.6% |
| Energy & Industrial plants | Operating income | 12.0 (15.1%) | 12.0 (15.0%) | 0.1% |
| Industrial products | Net sales | 53.3 | 57.5 | 7.8% |
| Industrial products | Operating income | 10.1 (19.0%) | 12.0 (20.9%) | 18.6% |
| Advanced products | Net sales | 39.1 | 53.0 | 35.6% |
| Advanced products | Operating income | 6.9 (17.7%) | 13.0 (24.5%) | 88.2% |
| Auto parts | Net sales | 51.5 | 50.0 | ▲ 2.9% |
| Auto parts | Operating income | 5.3 (10.3%) | 5.0 (10.0%) | ▲ 5.9% |
| Building materials | Net sales | 28.5 | 29.5 | 3.6% |
| Building materials | Operating income | 2.7 (9.5%) | 3.0 (10.2%) | 11.4% |
| Total | Net sales | 251.9 | 270.0 | 7.2% |
| Total | Operating income | 37.0 (14.7%) | 45.0 (16.7%) | 21.6% |
In the FY2026 net sales bridge, Advanced products (semiconductor-related) adds 13.9 billion JPY, Industrial products 4.2 billion JPY, Energy & Industrial plants 0.5 billion JPY and Building materials 1.0 billion JPY, while Auto parts subtracts 1.5 billion JPY, for a total increase of 18.1 billion JPY. In the operating income bridge, gross profit contributes 9.5 billion JPY and selling, general and administrative expenses reduce income by 1.5 billion JPY, for a net increase of 8.0 billion JPY. The materials note a labor cost increase of approximately 1.5 billion yen and a ±0 billion yen effect from the new core system.
Shareholder Returns
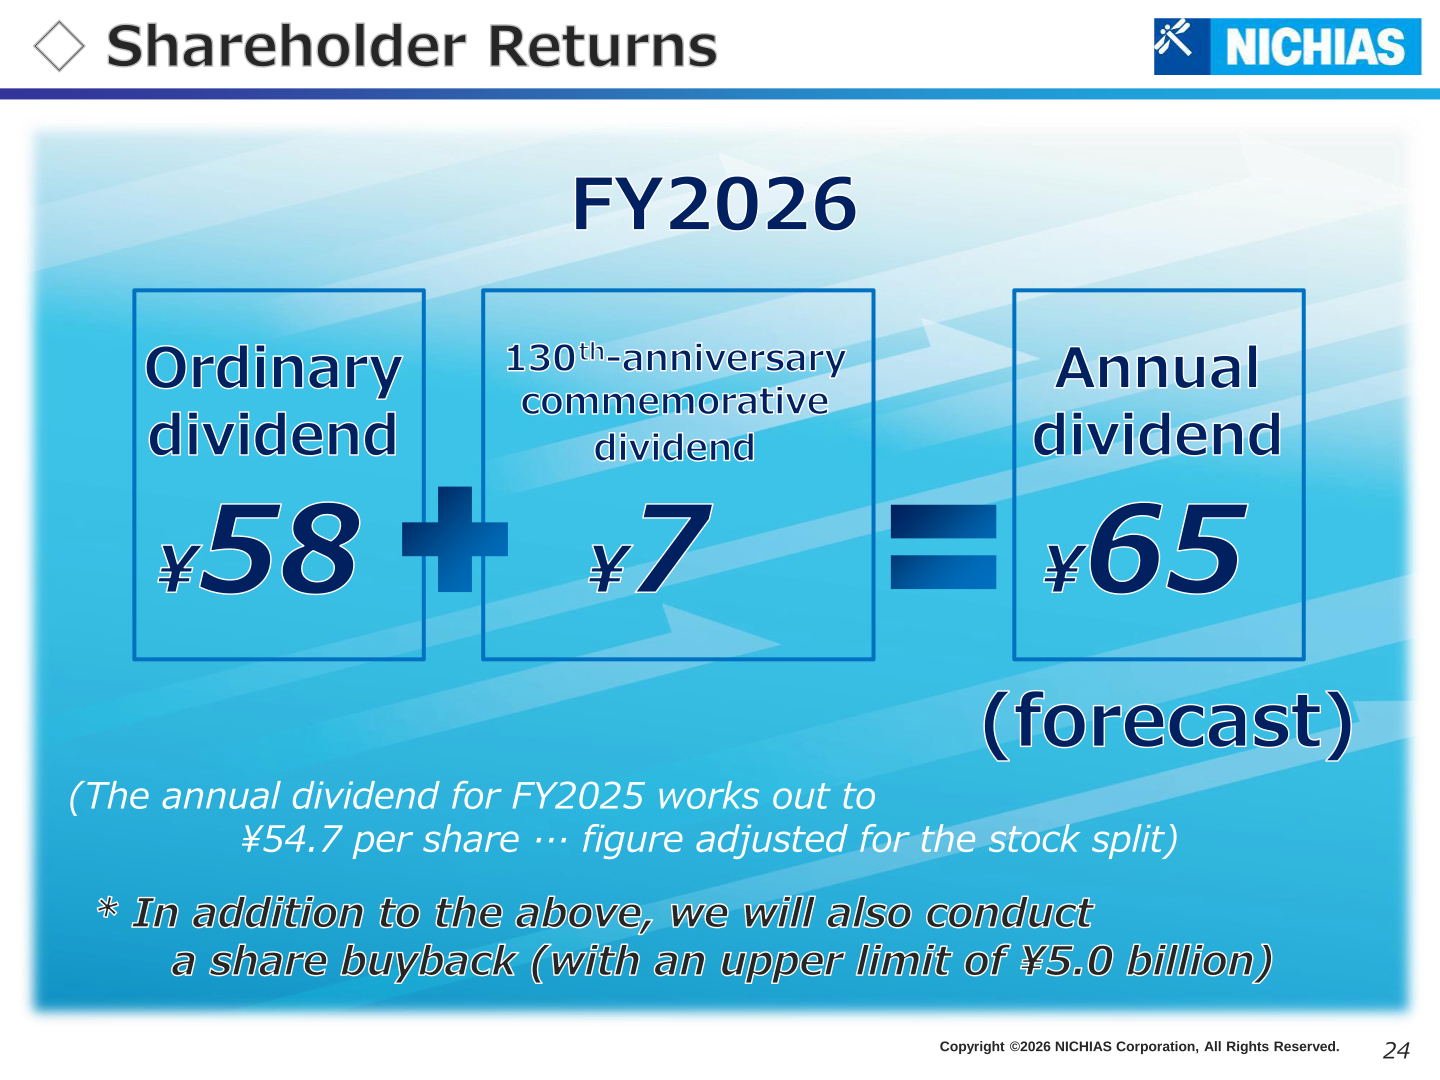
For FY2025 NICHIAS paid an annual dividend of ¥164 per share, up from ¥108 in FY2024, marking 17 consecutive years of dividend increases, with DOE of 5.1% and a total return ratio of 58.1%. A share buyback of 8.0bn yen was also carried out in FY2025. For FY2026 the company forecasts an annual dividend of ¥65 per share, consisting of an ordinary dividend of ¥58 and a 130th-anniversary commemorative dividend of ¥7; the materials note that the annual dividend for FY2025 works out to ¥54.7 per share on a stock-split-adjusted basis. In addition, the company will conduct a share buyback with an upper limit of ¥5.0 billion.
On capital policy, NICHIAS will implement a three-for-one split of common shares effective April 1, 2026; the year-end dividend for FY2025 will be paid on the basis of the pre-split number of shares. The company will also retire treasury shares so that 1% of the total issued shares remains, with the pre-split number of shares to be retired at 4,150 thousand shares.
Medium-Term Business Plan (FY2022 – FY2026)
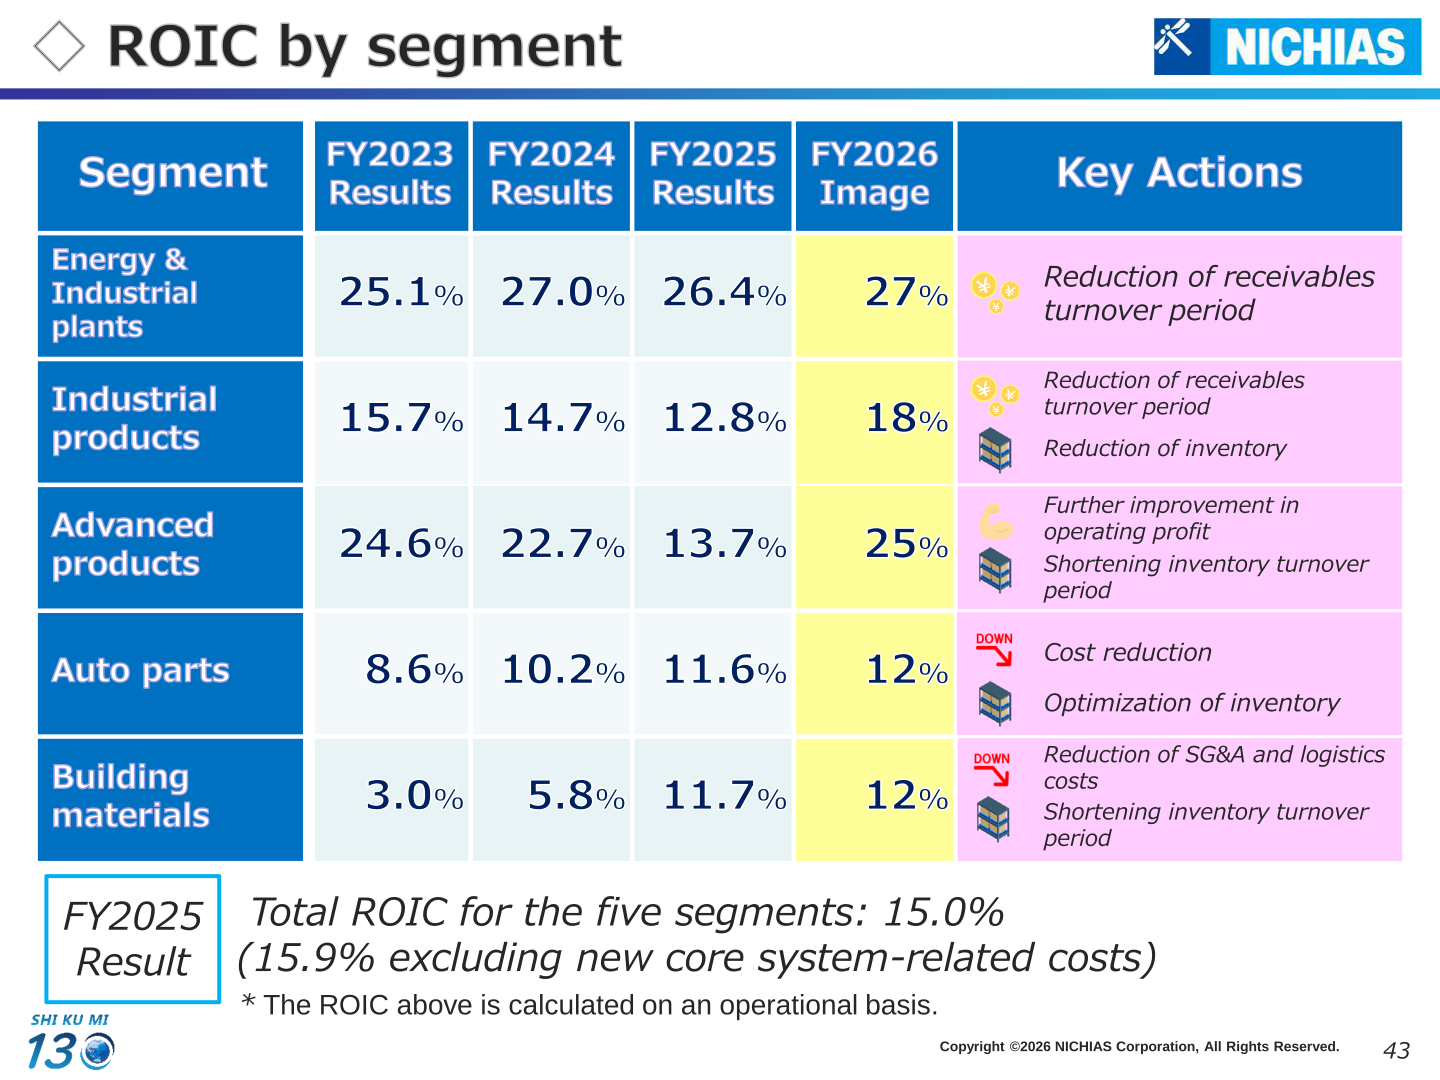
The medium-term plan is now in its 2nd Stage (the final 2 years). Quantitative targets show net sales of 251.9 billion JPY in FY2025 against a FY2026 forecast of 270.0 billion JPY, overseas sales of 51.8 billion JPY against 57.0 billion JPY, an operating profit margin of 14.7% against 16.7%, and capital expenditure of 11.0 billion JPY against 13.0 billion JPY. ROE was 13.9% in FY2025 with a FY2026 forecast of 15.0%, ROIC 10.7% against 14.0%, and EBITDA 44.3 billion JPY against 55.0 billion JPY. Liquidity on hand was 2.7 months against a 2nd Stage range of 1.5 to 2.0 months, the equity ratio 77.7%, and policy stock 7.5%.
| Segment | FY2023 Results | FY2024 Results | FY2025 Results | FY2026 Image |
|---|---|---|---|---|
| Energy & Industrial plants | 25.1% | 27.0% | 26.4% | 27% |
| Industrial products | 15.7% | 14.7% | 12.8% | 18% |
| Advanced products | 24.6% | 22.7% | 13.7% | 25% |
| Auto parts | 8.6% | 10.2% | 11.6% | 12% |
| Building materials | 3.0% | 5.8% | 11.7% | 12% |
Total ROIC for the five segments in FY2025 was 15.0% (15.9% excluding new core system-related costs); the ROIC above is calculated on an operational basis. Company-wide challenges under “Tree-ring management” include an operating profit margin target of 18% (profit margin excluding expenses for the new core system), expanded disclosure of ROIC by segment, and a strategic investment allocation of ¥29 billion over two years. The NICHIAS happiness value index (NGI) was 75.9 points in FY2024 against an FY2026 target of 80 points or more.
On capital allocation for the 2nd Stage (cumulative 2-year period from FY2025 to FY2026), sources of funds total 66 billion JPY from operating cash flow plus 17 billion JPY of surplus cash on hand and non-recurring cash, against outflows of 30 billion JPY for shareholder returns, 29 billion JPY of recurring capital investment and 24 billion JPY of strategic investment allocation. Progress up to FY2025 comprised shareholder returns of 18.4 billion JPY (dividends 10.4, share buybacks 8.0), capital investment of 7.4 billion JPY and strategic investment of 4.1 billion JPY. Additional shareholder returns using unused funds are to be considered.
Topics
The launch of the new core system construction has been postponed from the original plan of October, FY2026 to a revised May, FY2027, to allow enhanced business scenario testing and validation and sufficient end-user training time; as a result of the schedule extension, system development costs for the current fiscal year are expected to remain at approximately ¥2.5 billion, in line with FY2025. NICHIAS reached its 130th anniversary, opened the NICHIAS DISCOVERY GATE on the 5th floor of its headquarters in April 2026, and completed the Tsurumi Factory (Welfare & Warehouse Building) and the Hamamatsu Research Laboratory (Hydrogen Testing Facility) in March 2026. The company is also participating in the “Helix Program” of Helical Fusion Co., Ltd., which is developing a helical-type nuclear fusion power plant. On sustainability, FY2025 GHG emissions were 169,000 tons t-CO2eq against 180,000 tons in FY2024, and the renewable energy adoption rate was 18% against 13% in FY2024, with a 2030 target of 25%.
This article is an analysis based on publicly available information and is not a recommendation to buy or sell any specific securities. Investment decisions are your own responsibility.
![[Obayashi] Investors’ Guide 2026 — The Complete 24-Article Breakdown](https://japan-equity.com/wp-content/uploads/2026/07/hub_cover-1024x1024.png)
![[Obayashi] IR & SR Policy — Feeding Dialogue Back into Management](https://japan-equity.com/wp-content/uploads/2026/07/p32_sq-1024x1024.jpg)
![[Obayashi] Real Estate Development — 18.7% Margin, ¥287.7bn Unrealized Gains](https://japan-equity.com/wp-content/uploads/2026/07/p20_sq-1024x1024.jpg)
![[Obayashi] Domestic Civil Engineering — Resilience Spending Supports 9.6% Margin](https://japan-equity.com/wp-content/uploads/2026/07/p11_sq-1024x1024.jpg)
![[Obayashi] Share Price & External Ratings — vs TOPIX, ESG Index Inclusion](https://japan-equity.com/wp-content/uploads/2026/07/p40_sq-1024x1024.jpg)
![[Construction] ¥75.5tn Investment, Shrinking Workforce — Big-5 Market Share](https://japan-equity.com/wp-content/uploads/2026/07/p12_sq-1024x1024.jpg)



![[Obayashi] Capital Policy & Shareholder Returns — ROE 10%+, DOE ~5%, ¥100bn Buyback](https://japan-equity.com/wp-content/uploads/2026/07/p27_sq-1024x1024.jpg)
![[Obayashi] Reducing Cross-Shareholdings — ¥285.2bn Sold in Five Years](https://japan-equity.com/wp-content/uploads/2026/07/p29_sq-1024x1024.jpg)
![[Obayashi] ¥750bn Investment Plan — ¥300bn to Development, ¥190bn to Tech/DX](https://japan-equity.com/wp-content/uploads/2026/07/p30_sq-1024x1024.jpg)
![[Obayashi] MTP2022 KPIs — Operating Profit ~2x Target, ROE 14.4%](https://japan-equity.com/wp-content/uploads/2026/07/p25_sq-1024x1024.jpg)
![[Obayashi] Cash Allocation — ¥420bn Investment CF Over Five Years](https://japan-equity.com/wp-content/uploads/2026/07/p26_sq-1024x1024.jpg)
![[Obayashi] Green Energy — 44 Plants, 344MW, and the Green Hydrogen Challenge](https://japan-equity.com/wp-content/uploads/2026/07/p21_sq-1024x1024.jpg)
![[Obayashi] Tackling the Labor Shortage — Robotics Construction®](https://japan-equity.com/wp-content/uploads/2026/07/p14_sq-1024x1024.jpg)
