
This article is based on publicly available IR materials and is not a recommendation to buy or sell any specific securities.
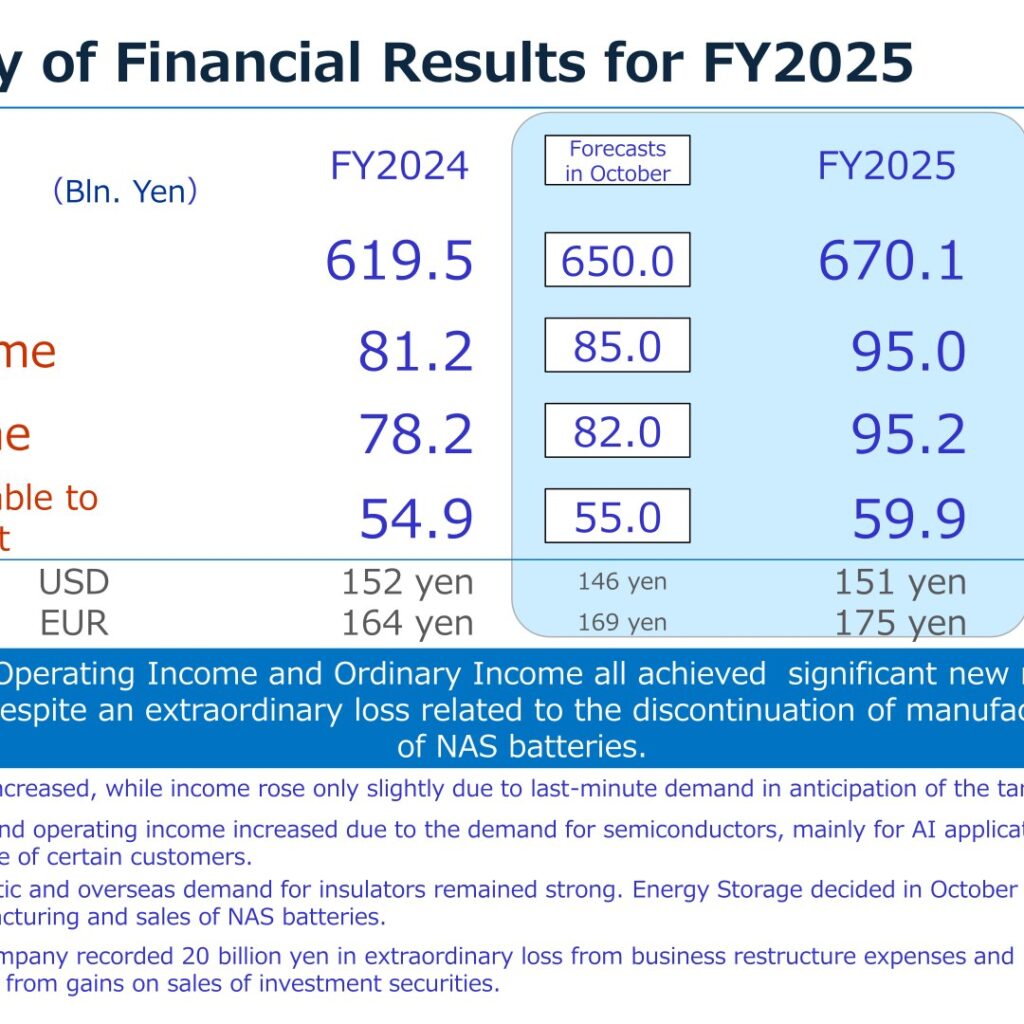
NGK Corporation (formerly NGK INSULATORS, LTD.; the company name was changed effective April 1, 2026) reported FY2025 results for the year from April 1, 2025 to March 31, 2026. Net sales came to 670.1 billion yen (+8% year on year), operating income to 95.0 billion yen (+17%) and ordinary income to 95.2 billion yen (+22%), with the presentation stating that net sales, operating income and ordinary income all achieved significant new record highs. Net income attributable to owners of the parent rose 9% to 59.9 billion yen, increasing despite an extraordinary loss related to the discontinuation of manufacturing and sales activities of NAS batteries. All four headline items came in above the forecasts announced in October 2025.
Consolidated Results (Full-Year Actual)
Amounts stated in the presentation are rounded to the nearest hundred million yen, so totals may not necessarily correspond to the sum of the individual figures. By segment, Environment saw sales increase while income rose only slightly due to last-minute demand in anticipation of the tariff hike; Digital Society posted higher sales and operating income on demand for semiconductors, mainly for AI applications, and concentrated inventory increase of certain customers; and in Energy & Industry, domestic and overseas demand for insulators remained strong, while Energy Storage decided in October 2025 to discontinue the manufacturing and sales of NAS batteries. On extraordinary items, the company recorded 20 billion yen in extraordinary loss from business restructure expenses and 13.2 billion yen in extraordinary income from gains on sales of investment securities.
| Item (Bln. Yen) | FY2024 | Forecasts in October | FY2025 | FX Impact | Growth ratio |
|---|---|---|---|---|---|
| Net sales | 619.5 | 650.0 | 670.1 | +5.3 | +8% |
| Operating Income | 81.2 | 85.0 | 95.0 | +0.1 | +17% |
| Ordinary Income | 78.2 | 82.0 | 95.2 | +22% | |
| Net income Attributable to Owners of the Parent | 54.9 | 55.0 | 59.9 | +9% | |
| Exchange Rate USD | 152 yen | 146 yen | 151 yen | (2 yen) | |
| Exchange Rate EUR | 164 yen | 169 yen | 175 yen | +11 yen |
The change analysis for FY2025 breaks the increase in net sales from 619.5 billion yen to 670.1 billion yen into Environment +2.6, Digital Society +34.9, Energy & Industry +7.8 and Forex +5.3. For operating income, the move from 81.2 billion yen to 95.0 billion yen comprises Environment (0.8), Digital Society +11.6, Energy & Industry +2.9 and Forex +0.1. The underlying breakdown of the operating income change is shipment volume change +12.5, product mix and price changes +9.1, cost savings +6.4, raw material and labor cost (10.4), head office expenses and indirect costs (4.2) and others +0.2.
Segment Results
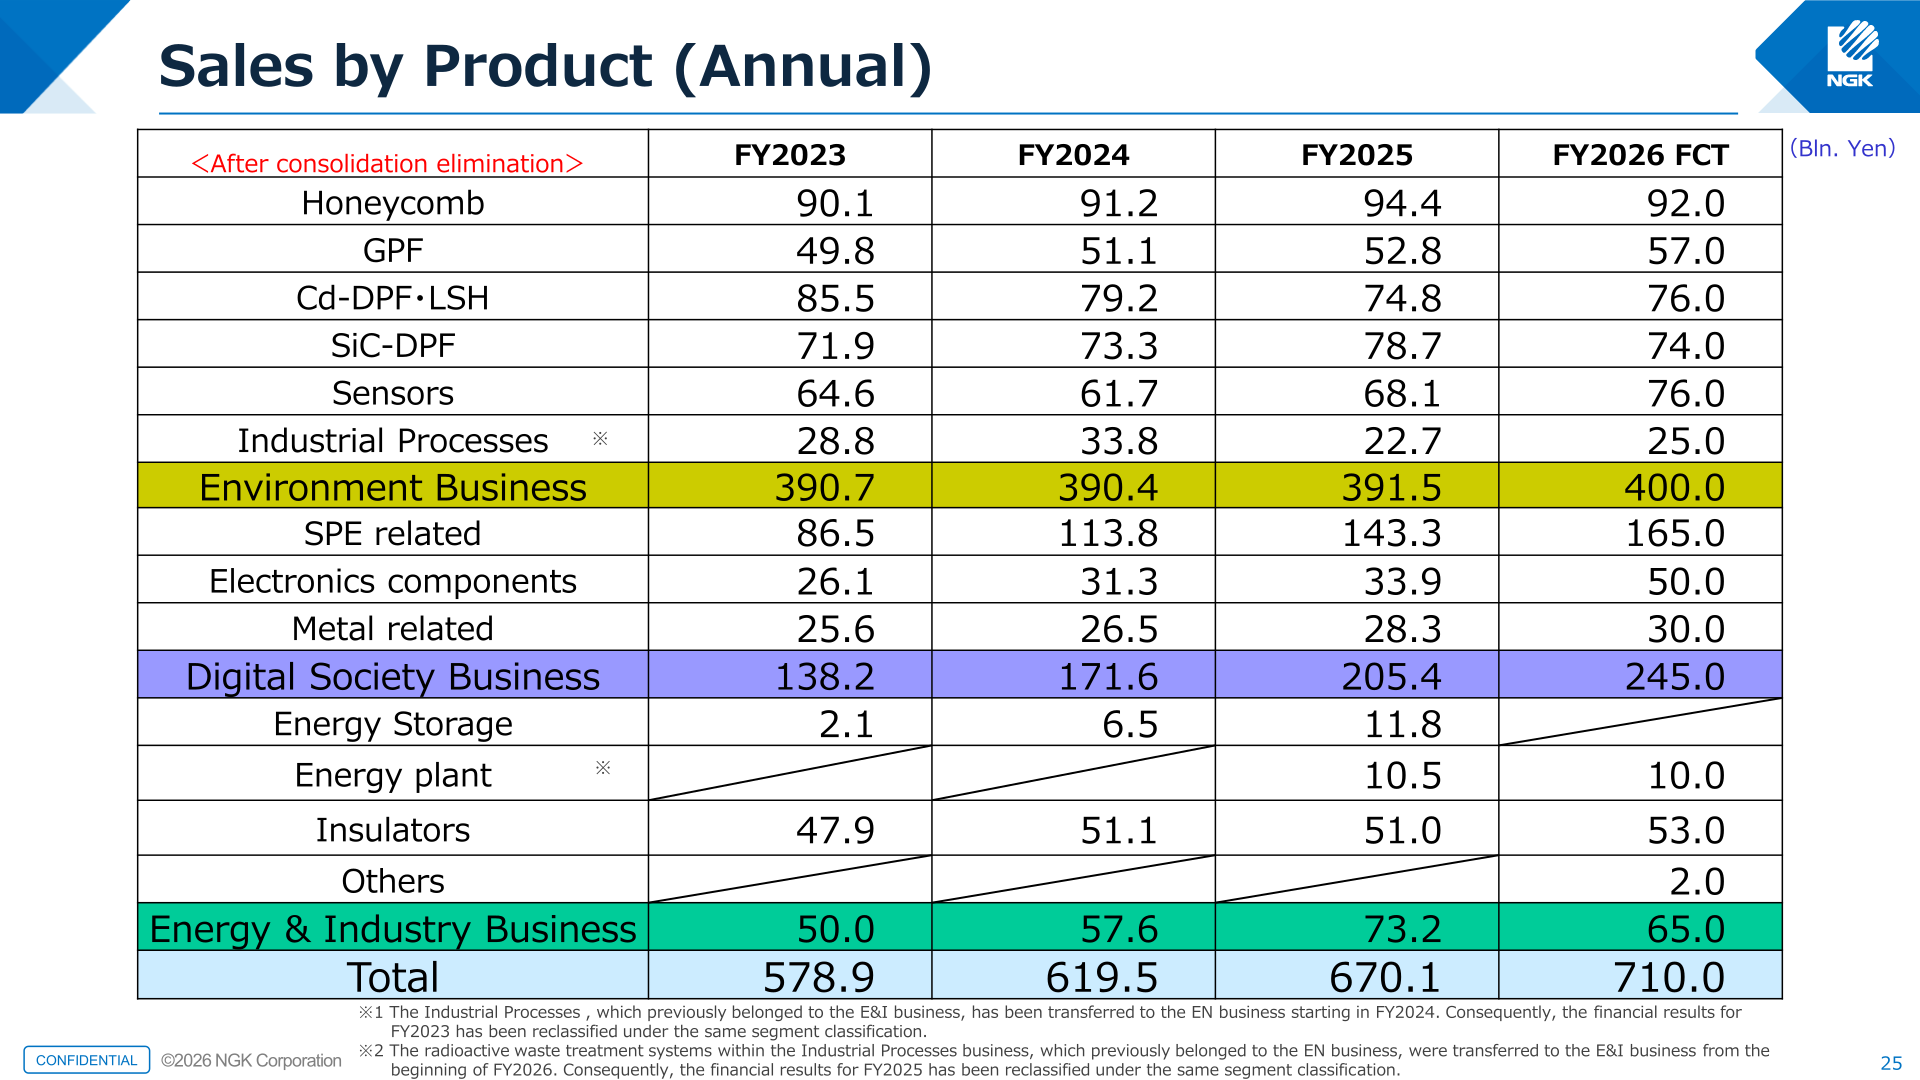
The business segments were changed effective from the beginning of FY2026, with the radioactive waste treatment systems transferred from the Environment segment to the Energy & Industry segment; FY2025 results have been reclassified and presented based on the same segment classification. On that basis, the Digital Society Business was the main growth driver, with sales of 205.4 billion yen against 171.6 billion yen in FY2024, while the Environment Business was broadly flat at 391.5 billion yen and the Energy & Industry Business rose to 73.2 billion yen.
| Sales by Product, after consolidation elimination (Bln. Yen) | FY2023 | FY2024 | FY2025 | FY2026 FCT |
|---|---|---|---|---|
| Honeycomb | 90.1 | 91.2 | 94.4 | 92.0 |
| GPF | 49.8 | 51.1 | 52.8 | 57.0 |
| Cd-DPF・LSH | 85.5 | 79.2 | 74.8 | 76.0 |
| SiC-DPF | 71.9 | 73.3 | 78.7 | 74.0 |
| Sensors | 64.6 | 61.7 | 68.1 | 76.0 |
| Industrial Processes | 28.8 | 33.8 | 22.7 | 25.0 |
| Environment Business | 390.7 | 390.4 | 391.5 | 400.0 |
| SPE related | 86.5 | 113.8 | 143.3 | 165.0 |
| Electronics components | 26.1 | 31.3 | 33.9 | 50.0 |
| Metal related | 25.6 | 26.5 | 28.3 | 30.0 |
| Digital Society Business | 138.2 | 171.6 | 205.4 | 245.0 |
| Energy Storage | 2.1 | 6.5 | 11.8 | |
| Energy plant | 10.5 | 10.0 | ||
| Insulators | 47.9 | 51.1 | 51.0 | 53.0 |
| Others | 2.0 | |||
| Energy & Industry Business | 50.0 | 57.6 | 73.2 | 65.0 |
| Total | 578.9 | 619.5 | 670.1 | 710.0 |
| Segment Operating Income (Bln. Yen) | FY2024 | FY2025 (After Segment Change) | FY2026 FCT |
|---|---|---|---|
| Environment | 68.3 | 67.0 | 67.0 |
| Environment: Op. Income margin | 17.5% | 17.1% | 16.8% |
| Digital Society | 17.2 | 28.1 | 36.0 |
| Digital Society: Op. Income margin | 10.0% | 13.7% | 14.7% |
| Energy & Industry | (4.2) | 0.3 | 4.0 |
| Energy & Industry: Op. Income margin | 0.3% | 6.2% |
Within Digital Society, the presentation notes that growth in the semiconductor manufacturing equipment market is gaining momentum on AI-related demand, and SPE related sales rose to 143.3 billion yen from 113.8 billion yen. For HICERAM Carrier, demand for high-performance GPUs for AI servers is described as strong, and the company aims to achieve sales exceeding 10 billion yen by steadily ramping up production investment; DS Business capital expenditures totalled 82.7 billion yen for FY2021-FY2025 with a plan of 250.0 billion yen for FY2026-FY2030, and DS Business sales are targeted at approximately 350.0 billion yen in FY2030 against 205.4 billion yen in FY2025. In Energy & Industry, the company will establish an Energy Plant Division to strengthen engineering and construction capabilities in power-related fields.
FY2026 Forecast
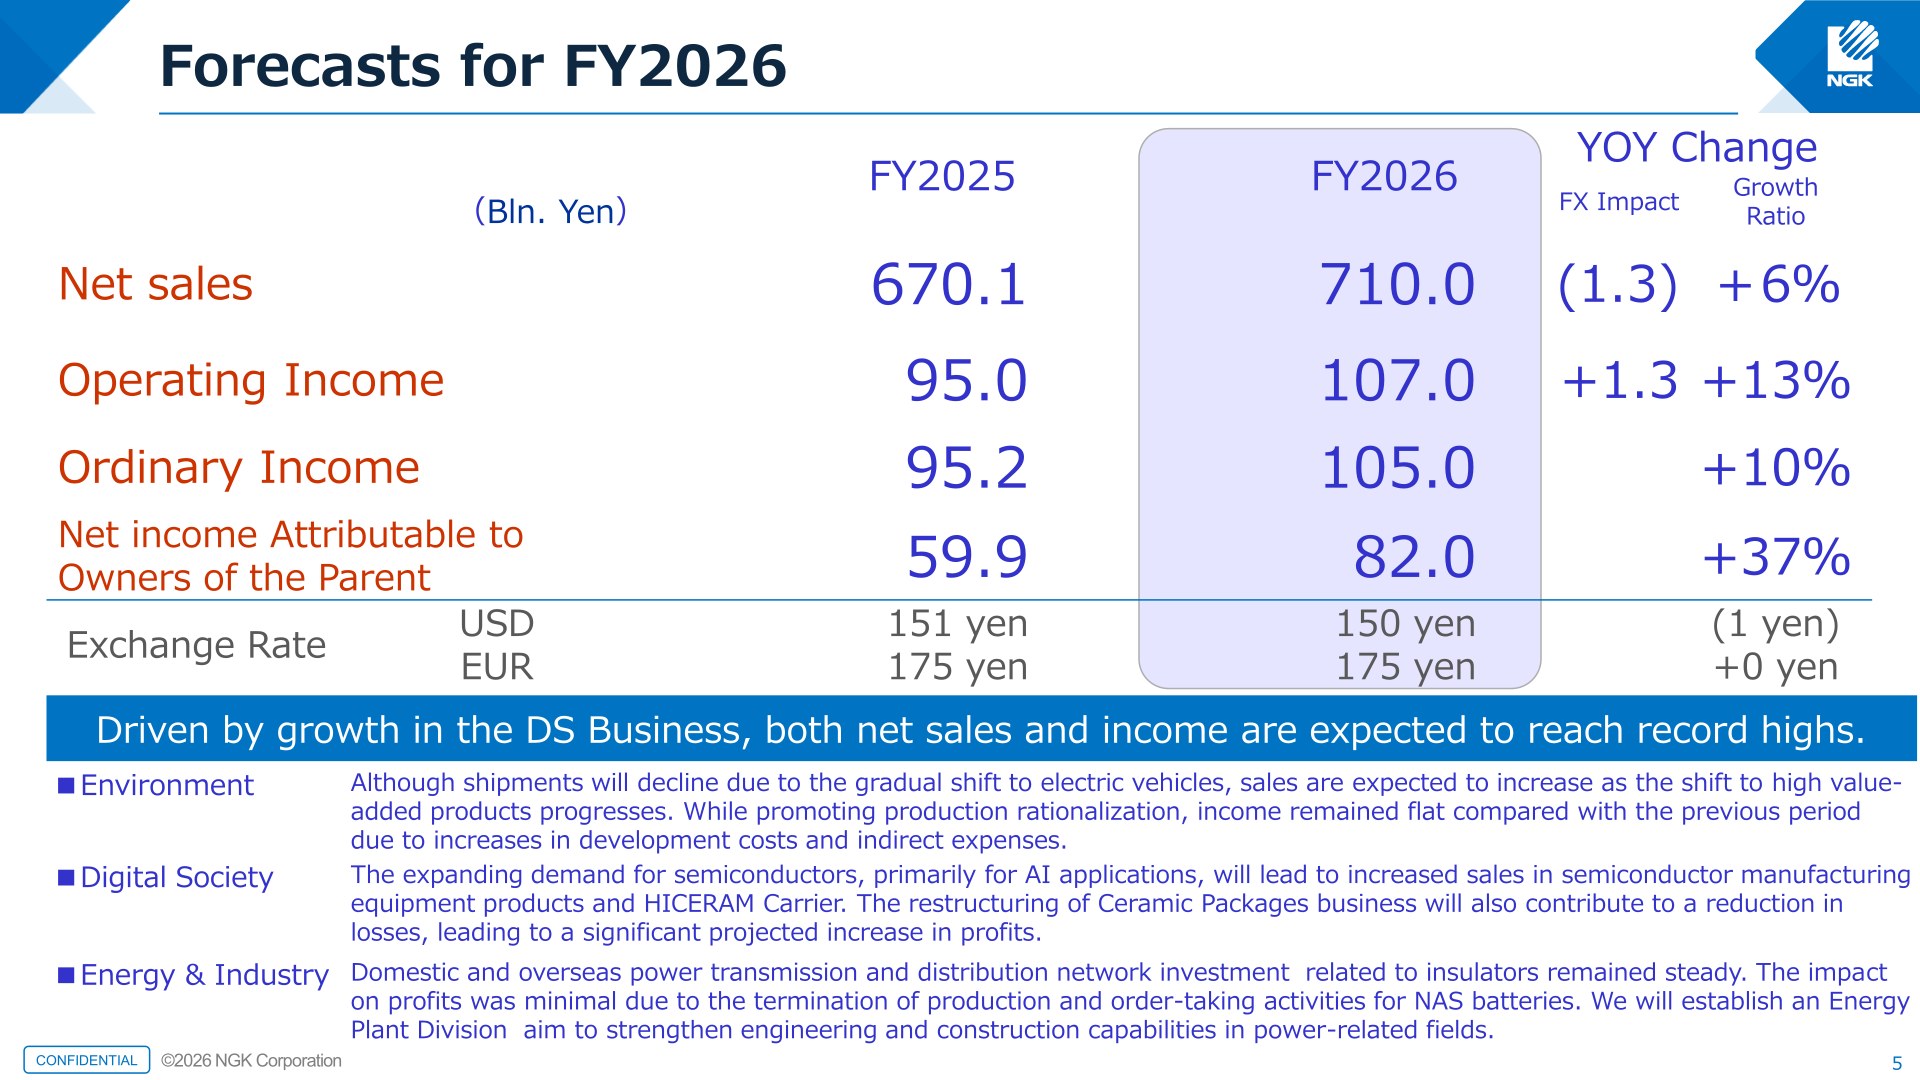
For FY2026 (ending March 31, 2027), driven by growth in the DS Business, both net sales and income are expected to reach record highs. Assumed exchange rates are 150 yen to the US dollar and 175 yen to the euro. The forecast factors in an expected cost increase of 2.0 billion yen from energy prices trending above planned levels due to soaring crude oil prices; regarding market deterioration risk arising from the Middle East situation, no impact has been reflected in the current earnings forecast at this stage.
| Item (Bln. Yen) | FY2025 | FY2026 | FX Impact | Growth Ratio |
|---|---|---|---|---|
| Net sales | 670.1 | 710.0 | (1.3) | +6% |
| Operating Income | 95.0 | 107.0 | +1.3 | +13% |
| Ordinary Income | 95.2 | 105.0 | +10% | |
| Net income Attributable to Owners of the Parent | 59.9 | 82.0 | +37% | |
| Exchange Rate USD | 151 yen | 150 yen | (1 yen) | |
| Exchange Rate EUR | 175 yen | 175 yen | +0 yen |
The change analysis for FY2026 attributes the increase in net sales from 670.1 billion yen to 710.0 billion yen to Environment +0.9, Digital Society +40.4, Energy & Industry (0.2) and Forex (1.3). The operating income bridge from 95.0 billion yen to 107.0 billion yen consists of Environment (2.5), Digital Society +7.9, Energy & Industry +5.3 and Forex +1.3, with the underlying breakdown being shipment volume change +27.9, cost savings +6.1, raw material and labor cost (8.8), R&D cost (7.2), product mix and price changes (4.0), head office expenses and indirect costs (2.6) and others (0.7). Capital expenditures are planned at 62.0 billion yen in FY2026 against 55.8 billion yen in FY2025, mainly for production increases in the Digital Society Business, while R&D input is planned to rise to 39.0 billion yen from 31.8 billion yen (an R&D/sales ratio of 5.5% versus 4.7%). Cash flow from operating activities was 138.0 billion yen in FY2025 and is forecast at 126.0 billion yen in FY2026, with investing activities of (77.1) and (66.0) respectively.
Shareholder Returns
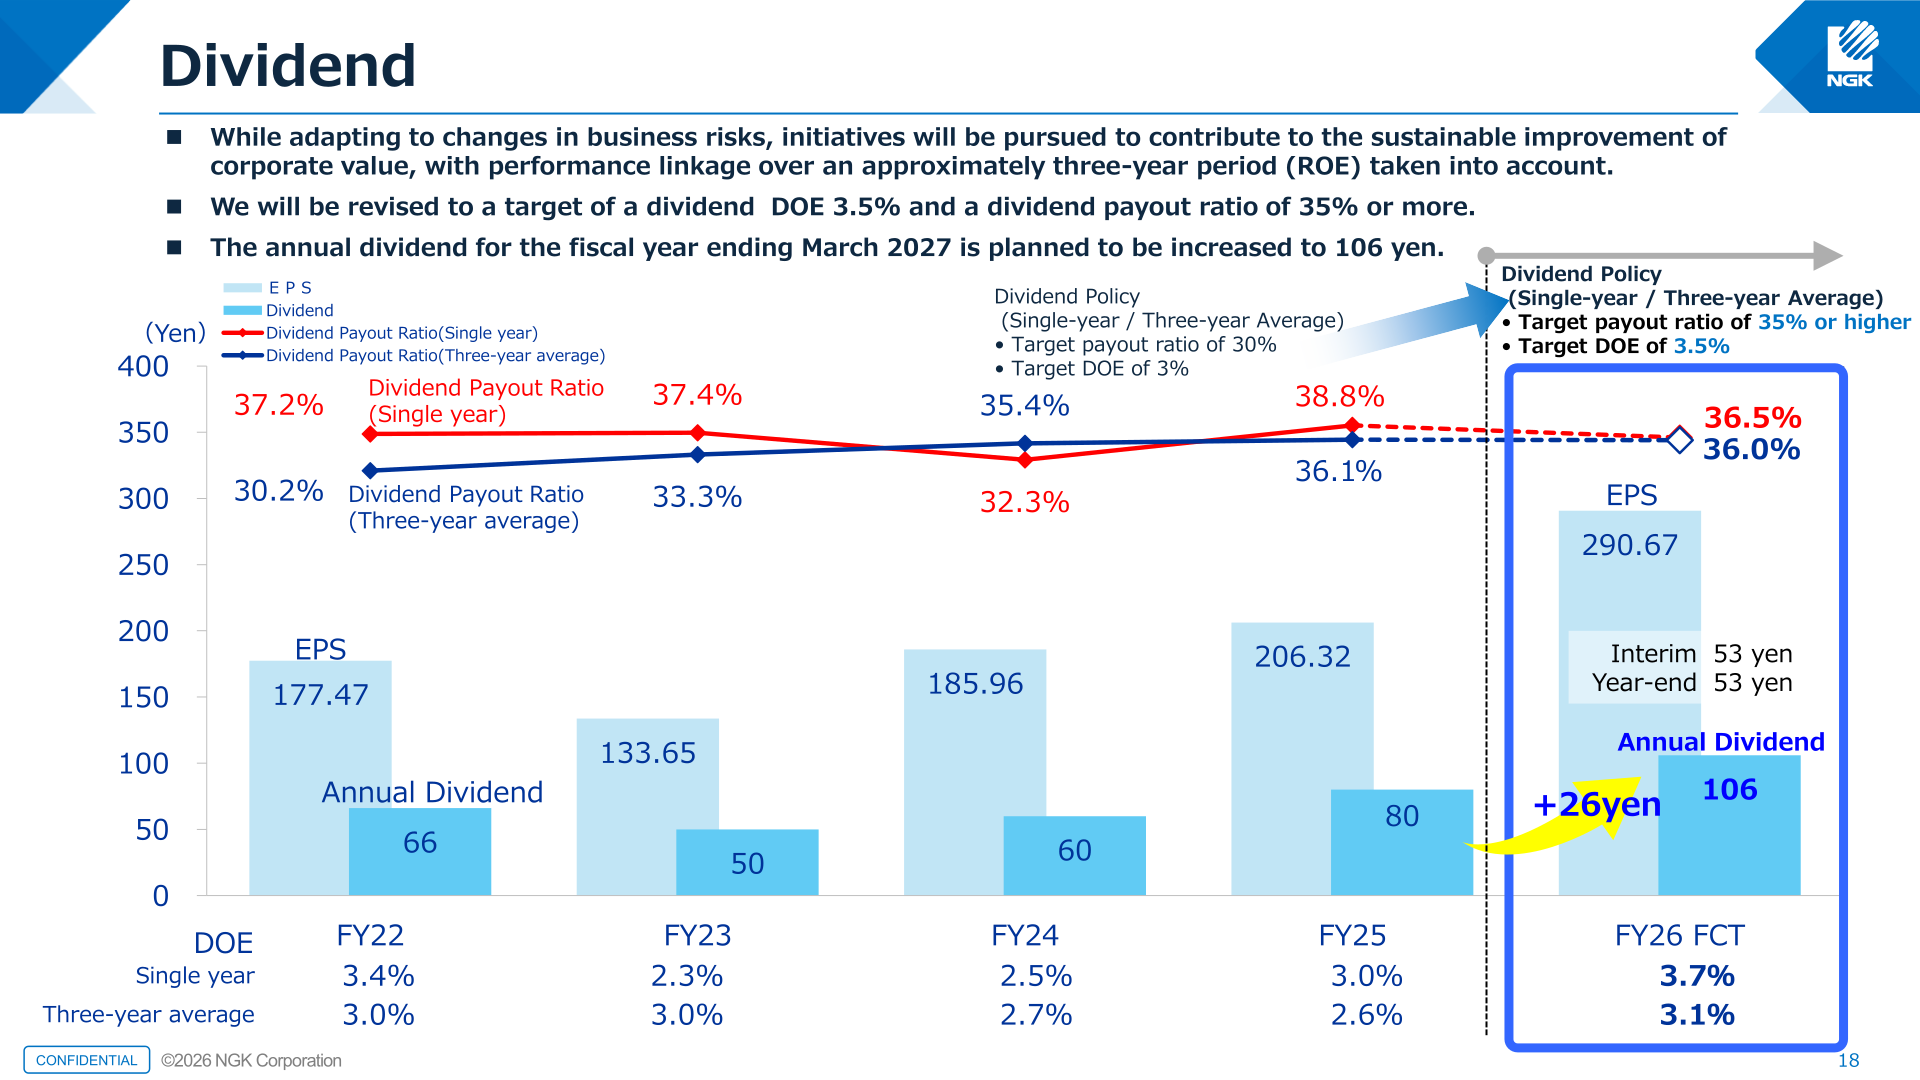
The annual dividend for FY2025 was 80 yen per share, up from 60 yen in FY2024, against EPS of 206.32 yen, for a single-year payout ratio of 38.8% (three-year average 36.1%) and a single-year DOE of 3.0%. The dividend policy has been revised to a target DOE of 3.5% and a target payout ratio of 35% or higher, and the annual dividend for the fiscal year ending March 2027 is planned to be increased to 106 yen (interim 53 yen, year-end 53 yen), an increase of 26 yen. Alongside dividends, the company disclosed on April 30, 2026 an acquisition of own shares of up to 6.5 million shares (2.3% of the total number of outstanding shares excluding treasury shares) for a total value of up to 33 billion yen, through the Off-Auction Own Share Repurchase Trading System (N-NET3), with the result of the acquisition to be announced after the close of trading at 8:45 a.m. on May 1, 2026. All of the acquired shares are to be cancelled, with the cancellation scheduled for June 1, 2026.
| Item | FY2022 | FY2023 | FY2024 | FY2025 | FY2026 FCT |
|---|---|---|---|---|---|
| EPS (Yen) | 177.47 | 133.65 | 185.96 | 206.32 | 290.67 |
| Dividend (Yen) | 66 | 50 | 60 | 80 | 106 |
| Dividend Payout Ratio (Single year) | 37.2% | 37.4% | 32.3% | 38.8% | 36.5% |
| Dividend Payout Ratio (Three-year average) | 30.2% | 33.3% | 35.4% | 36.1% | 36.0% |
| DOE (Single year) | 3.4% | 2.3% | 2.5% | 3.0% | 3.7% |
| DOE (Three-year average) | 3.0% | 3.0% | 2.7% | 2.6% | 3.1% |
| ROE | 9.0% | 6.1% | 7.8% | 7.8% | 10.0% |
Medium-Term Plan and Topics
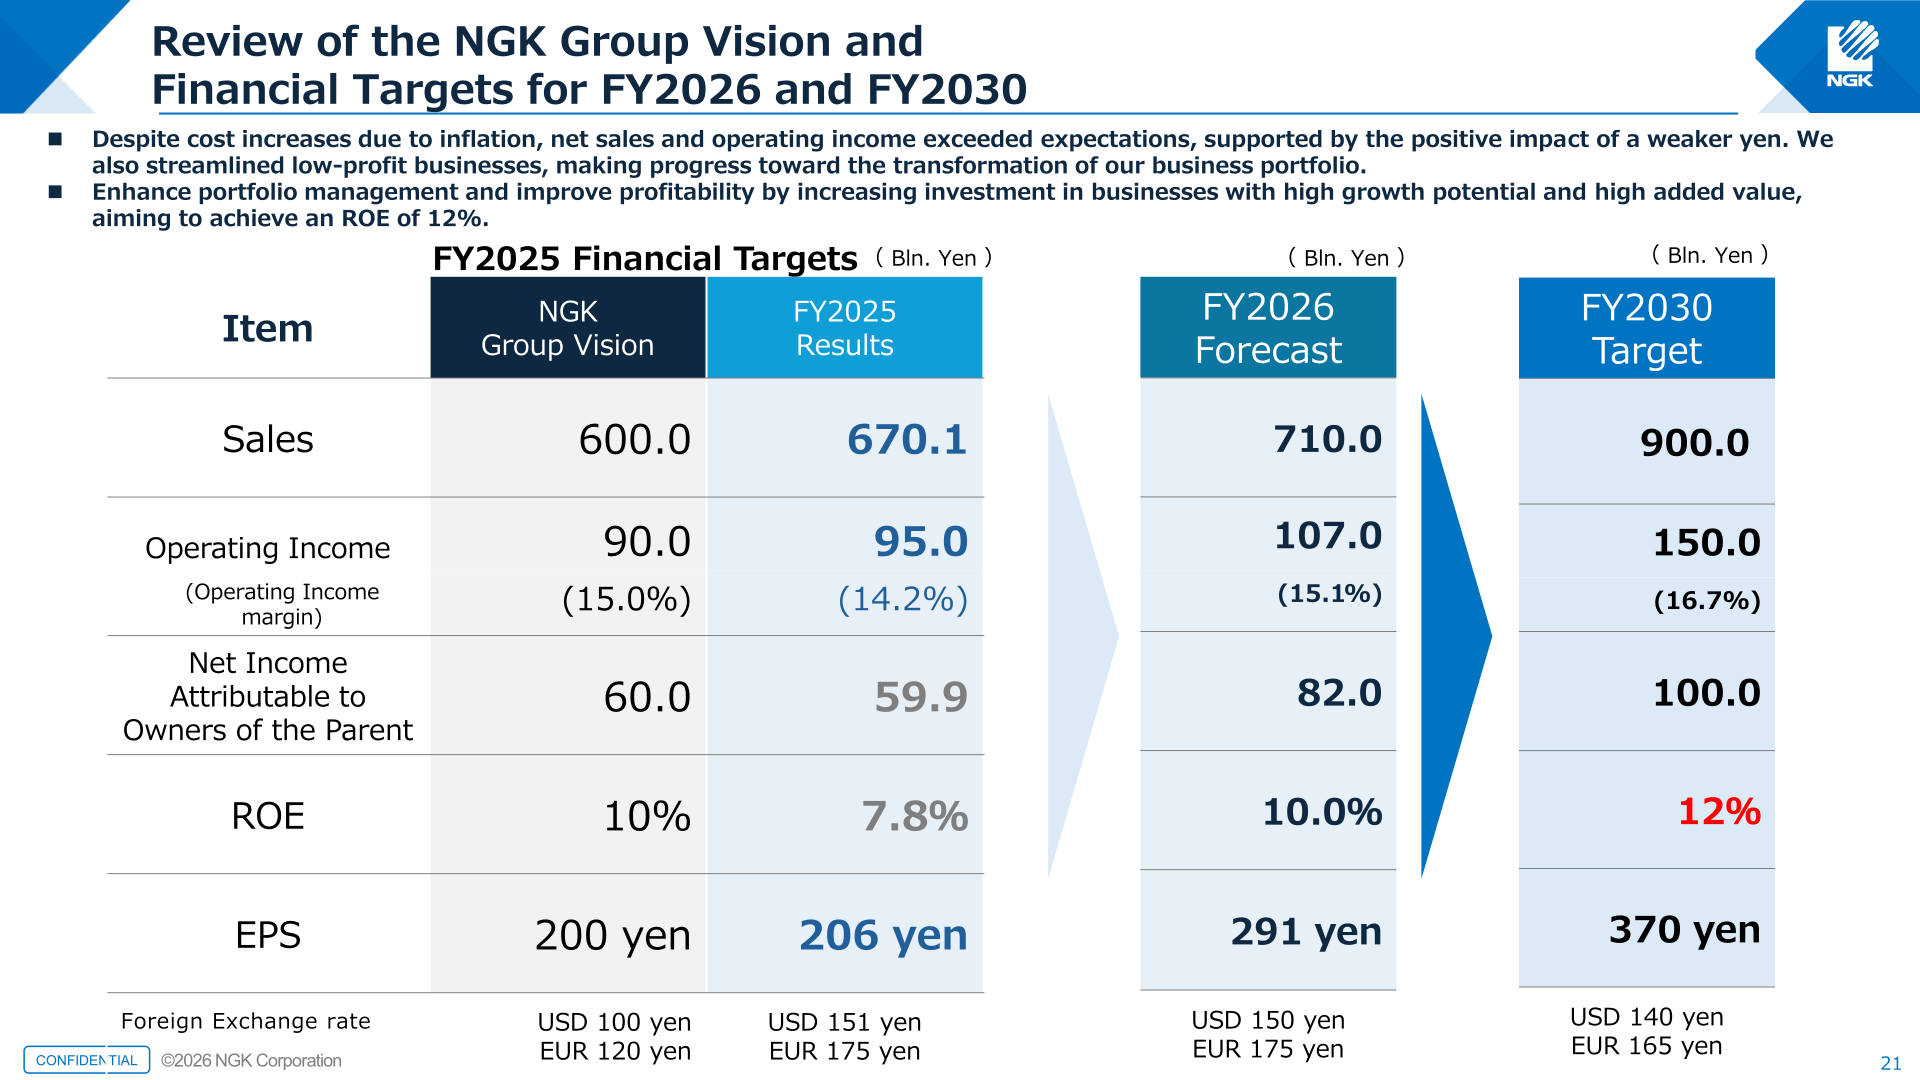
Against the NGK Group Vision targets for FY2025 of 600.0 billion yen in sales, 90.0 billion yen in operating income (15.0% margin), 60.0 billion yen in net income attributable to owners of the parent, ROE of 10% and EPS of 200 yen (assuming 100 yen to the US dollar and 120 yen to the euro), actual results were sales of 670.1 billion yen, operating income of 95.0 billion yen (14.2%), net income of 59.9 billion yen, ROE of 7.8% and EPS of 206 yen at rates of 151 yen and 175 yen. The presentation states that net sales and operating income exceeded expectations despite cost increases due to inflation, supported by the positive impact of a weaker yen. The FY2030 targets are sales of 900.0 billion yen, operating income of 150.0 billion yen (16.7% margin), net income of 100.0 billion yen, ROE of 12% and EPS of 370 yen, assuming 140 yen to the US dollar and 165 yen to the euro.
| Item | NGK Group Vision (FY2025) | FY2025 Results | FY2026 Forecast | FY2030 Target |
|---|---|---|---|---|
| Sales (Bln. Yen) | 600.0 | 670.1 | 710.0 | 900.0 |
| Operating Income (Bln. Yen) | 90.0 | 95.0 | 107.0 | 150.0 |
| (Operating Income margin) | (15.0%) | (14.2%) | (15.1%) | (16.7%) |
| Net Income Attributable to Owners of the Parent (Bln. Yen) | 60.0 | 59.9 | 82.0 | 100.0 |
| ROE | 10% | 7.8% | 10.0% | 12% |
| EPS | 200 yen | 206 yen | 291 yen | 370 yen |
| Foreign Exchange rate | USD 100 yen / EUR 120 yen | USD 151 yen / EUR 175 yen | USD 150 yen / EUR 175 yen | USD 140 yen / EUR 165 yen |
On capital policy, the company raised its internal business hurdle rate (NGK ROIC) from 10% to 12% due to rising capital costs, and introduced a business restructuring and divestiture review process using operating income, NGK ROIC and free cash flow as screening indicators. The estimation of the capital cost shown in the presentation is an after-tax debt cost of 0.9%, capital cost of 9.3% (CAPM), D/E ratio of 0.30, WACC of 7.9% and pre-tax WACC of 11.3%. Under the New Value 1000 (NV1000) initiative, the target for FY2030 is new business sales of 100 billion yen. Cumulative inputs for FY2021-FY2025 were capital expenditures of 233.8 billion yen (against a Group Vision target of 250.0 billion yen) and R&D input of 142.7 billion yen (target 130.0 billion yen), with FY2026-FY2030 targets of 450.0 billion yen and 200.0 billion yen respectively. The company also changed its corporate name to NGK Corporation effective April 1, 2026, to accelerate initiatives to transform its business structure in line with the NGK Group Vision: Road to 2050.
This article is an analysis based on publicly available information and is not a recommendation to buy or sell any specific securities. Investment decisions are your own responsibility.
![[Obayashi] Investors’ Guide 2026 — The Complete 24-Article Breakdown](https://japan-equity.com/wp-content/uploads/2026/07/hub_cover-1024x1024.png)
![[Obayashi] IR & SR Policy — Feeding Dialogue Back into Management](https://japan-equity.com/wp-content/uploads/2026/07/p32_sq-1024x1024.jpg)
![[Obayashi] Real Estate Development — 18.7% Margin, ¥287.7bn Unrealized Gains](https://japan-equity.com/wp-content/uploads/2026/07/p20_sq-1024x1024.jpg)
![[Obayashi] Domestic Civil Engineering — Resilience Spending Supports 9.6% Margin](https://japan-equity.com/wp-content/uploads/2026/07/p11_sq-1024x1024.jpg)
![[Obayashi] Share Price & External Ratings — vs TOPIX, ESG Index Inclusion](https://japan-equity.com/wp-content/uploads/2026/07/p40_sq-1024x1024.jpg)
![[Construction] ¥75.5tn Investment, Shrinking Workforce — Big-5 Market Share](https://japan-equity.com/wp-content/uploads/2026/07/p12_sq-1024x1024.jpg)



![[Obayashi] Capital Policy & Shareholder Returns — ROE 10%+, DOE ~5%, ¥100bn Buyback](https://japan-equity.com/wp-content/uploads/2026/07/p27_sq-1024x1024.jpg)
![[Obayashi] Reducing Cross-Shareholdings — ¥285.2bn Sold in Five Years](https://japan-equity.com/wp-content/uploads/2026/07/p29_sq-1024x1024.jpg)
![[Obayashi] ¥750bn Investment Plan — ¥300bn to Development, ¥190bn to Tech/DX](https://japan-equity.com/wp-content/uploads/2026/07/p30_sq-1024x1024.jpg)
![[Obayashi] MTP2022 KPIs — Operating Profit ~2x Target, ROE 14.4%](https://japan-equity.com/wp-content/uploads/2026/07/p25_sq-1024x1024.jpg)
![[Obayashi] Cash Allocation — ¥420bn Investment CF Over Five Years](https://japan-equity.com/wp-content/uploads/2026/07/p26_sq-1024x1024.jpg)
![[Obayashi] Green Energy — 44 Plants, 344MW, and the Green Hydrogen Challenge](https://japan-equity.com/wp-content/uploads/2026/07/p21_sq-1024x1024.jpg)
![[Obayashi] Tackling the Labor Shortage — Robotics Construction®](https://japan-equity.com/wp-content/uploads/2026/07/p14_sq-1024x1024.jpg)
