
This article is based on publicly available IR materials and is not a recommendation to buy or sell any specific securities.
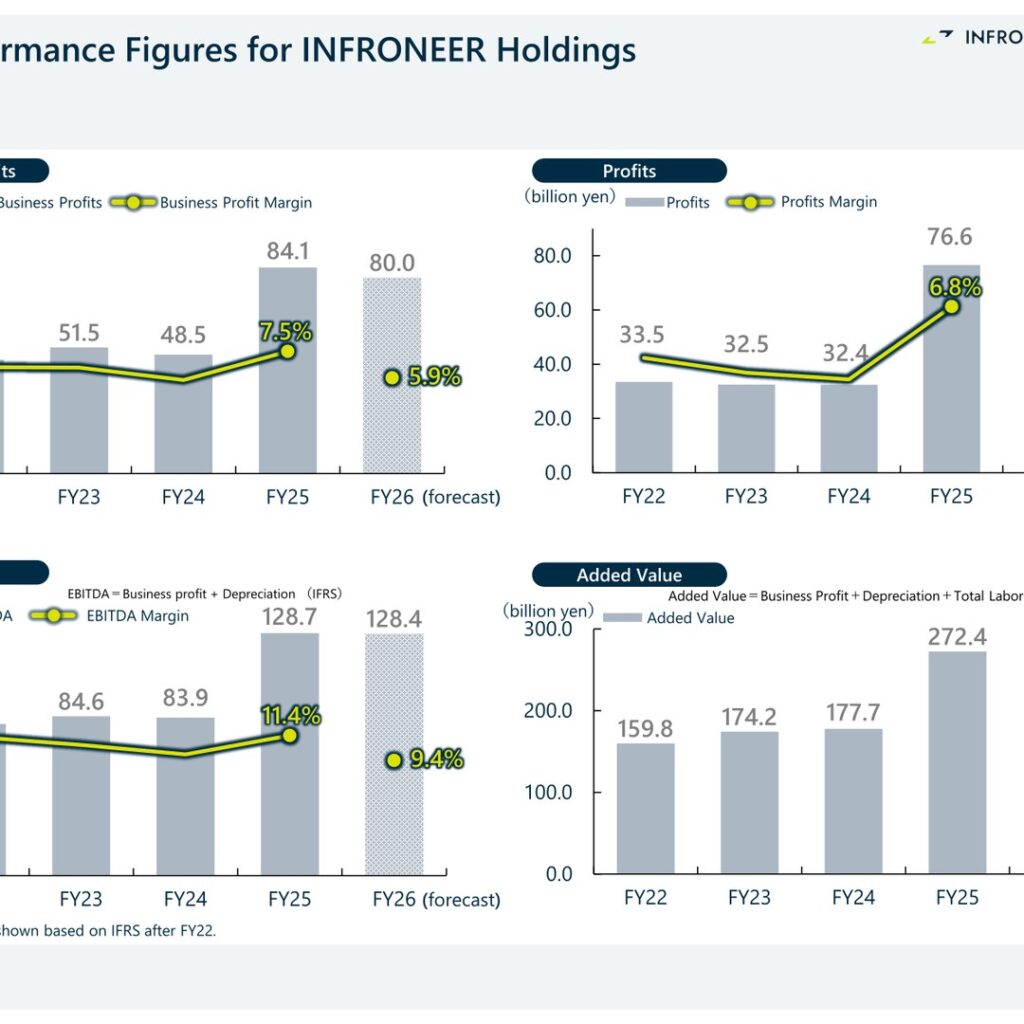
INFRONEER Holdings Inc. released its FY25 Financial Presentation on May 13, 2026, covering the fiscal year ended March 31, 2026. Net sales rose to 1,124.9 billion yen from 847.5 billion yen a year earlier, business profits climbed to 84.1 billion yen from 48.5 billion yen, and net income reached 76.6 billion yen from 32.4 billion yen. The company states that net sales, business profit, EBITDA and profit all reached record highs since the establishment of the holding company, with the full consolidation of Sumitomo Mitsui Construction (SMC) as a wholly owned subsidiary a central driver. ROE (ordinary shares) came in at 16.0%, against the Medium-term Vision 2027 target of 12.0%.
Consolidated Results (Full-Year Actual)
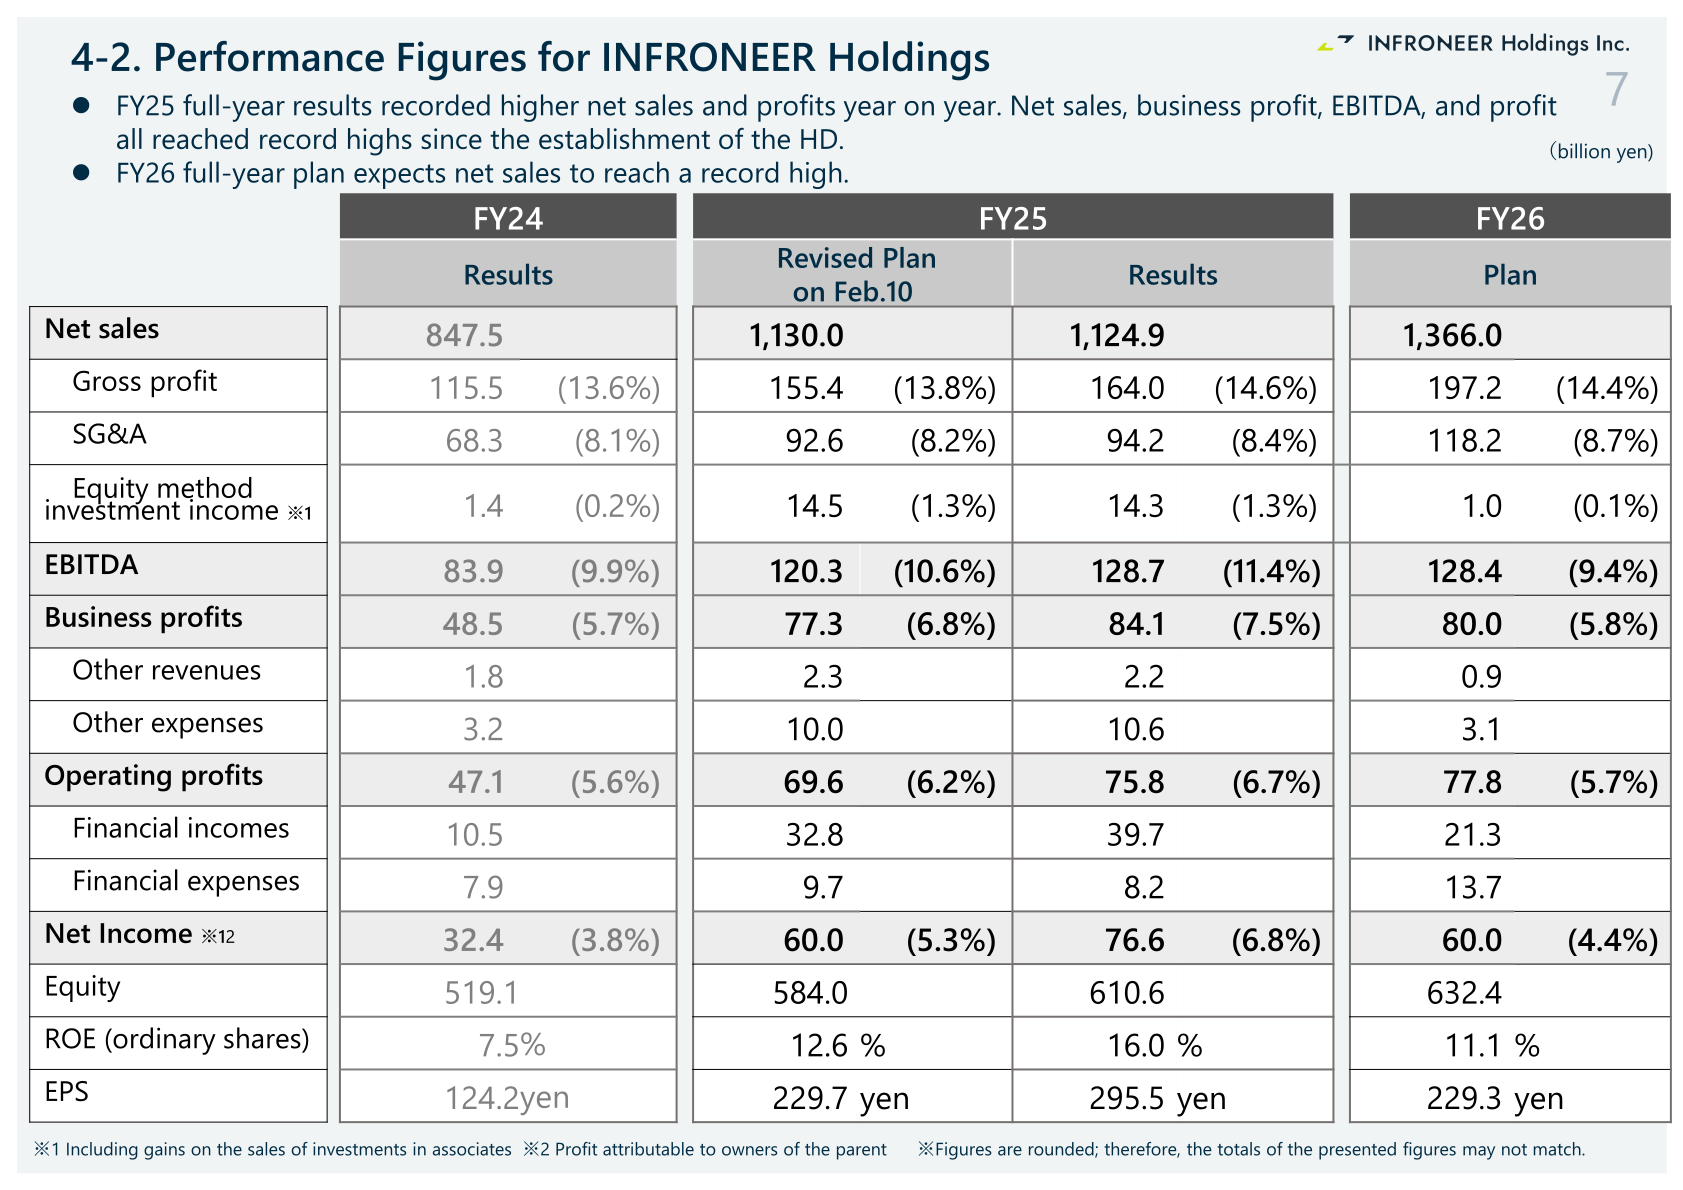
Results came in above the plan revised on February 10, 2026 on every profit line: gross profit of 164.0 billion yen versus a revised plan of 155.4 billion yen, EBITDA of 128.7 billion yen versus 120.3 billion yen, business profits of 84.1 billion yen versus 77.3 billion yen, and net income of 76.6 billion yen versus 60.0 billion yen. Net sales of 1,124.9 billion yen were 5.1 billion yen short of the revised plan of 1,130.0 billion yen. Equity method investment income, which includes gains on the sales of investments in associates, expanded to 14.3 billion yen from 1.4 billion yen, and financial incomes rose to 39.7 billion yen from 10.5 billion yen. EPS was 295.5 yen against 124.2 yen in FY24. Figures are presented on an IFRS basis and are rounded, so totals may not match.
| Item (billion yen) | FY25 Results | FY24 Results | FY25 Revised Plan (Feb. 10) |
|---|---|---|---|
| Net sales | 1,124.9 | 847.5 | 1,130.0 |
| Gross profit | 164.0 (14.6%) | 115.5 (13.6%) | 155.4 (13.8%) |
| SG&A | 94.2 (8.4%) | 68.3 (8.1%) | 92.6 (8.2%) |
| Equity method investment income | 14.3 (1.3%) | 1.4 (0.2%) | 14.5 (1.3%) |
| EBITDA | 128.7 (11.4%) | 83.9 (9.9%) | 120.3 (10.6%) |
| Business profits | 84.1 (7.5%) | 48.5 (5.7%) | 77.3 (6.8%) |
| Other revenues | 2.2 | 1.8 | 2.3 |
| Other expenses | 10.6 | 3.2 | 10.0 |
| Operating profits | 75.8 (6.7%) | 47.1 (5.6%) | 69.6 (6.2%) |
| Financial incomes | 39.7 | 10.5 | 32.8 |
| Financial expenses | 8.2 | 7.9 | 9.7 |
| Net income (attributable to owners of the parent) | 76.6 (6.8%) | 32.4 (3.8%) | 60.0 (5.3%) |
| Equity | 610.6 | 519.1 | 584.0 |
| ROE (ordinary shares) | 16.0 % | 7.5% | 12.6 % |
| EPS | 295.5 yen | 124.2yen | 229.7 yen |
Segment Results
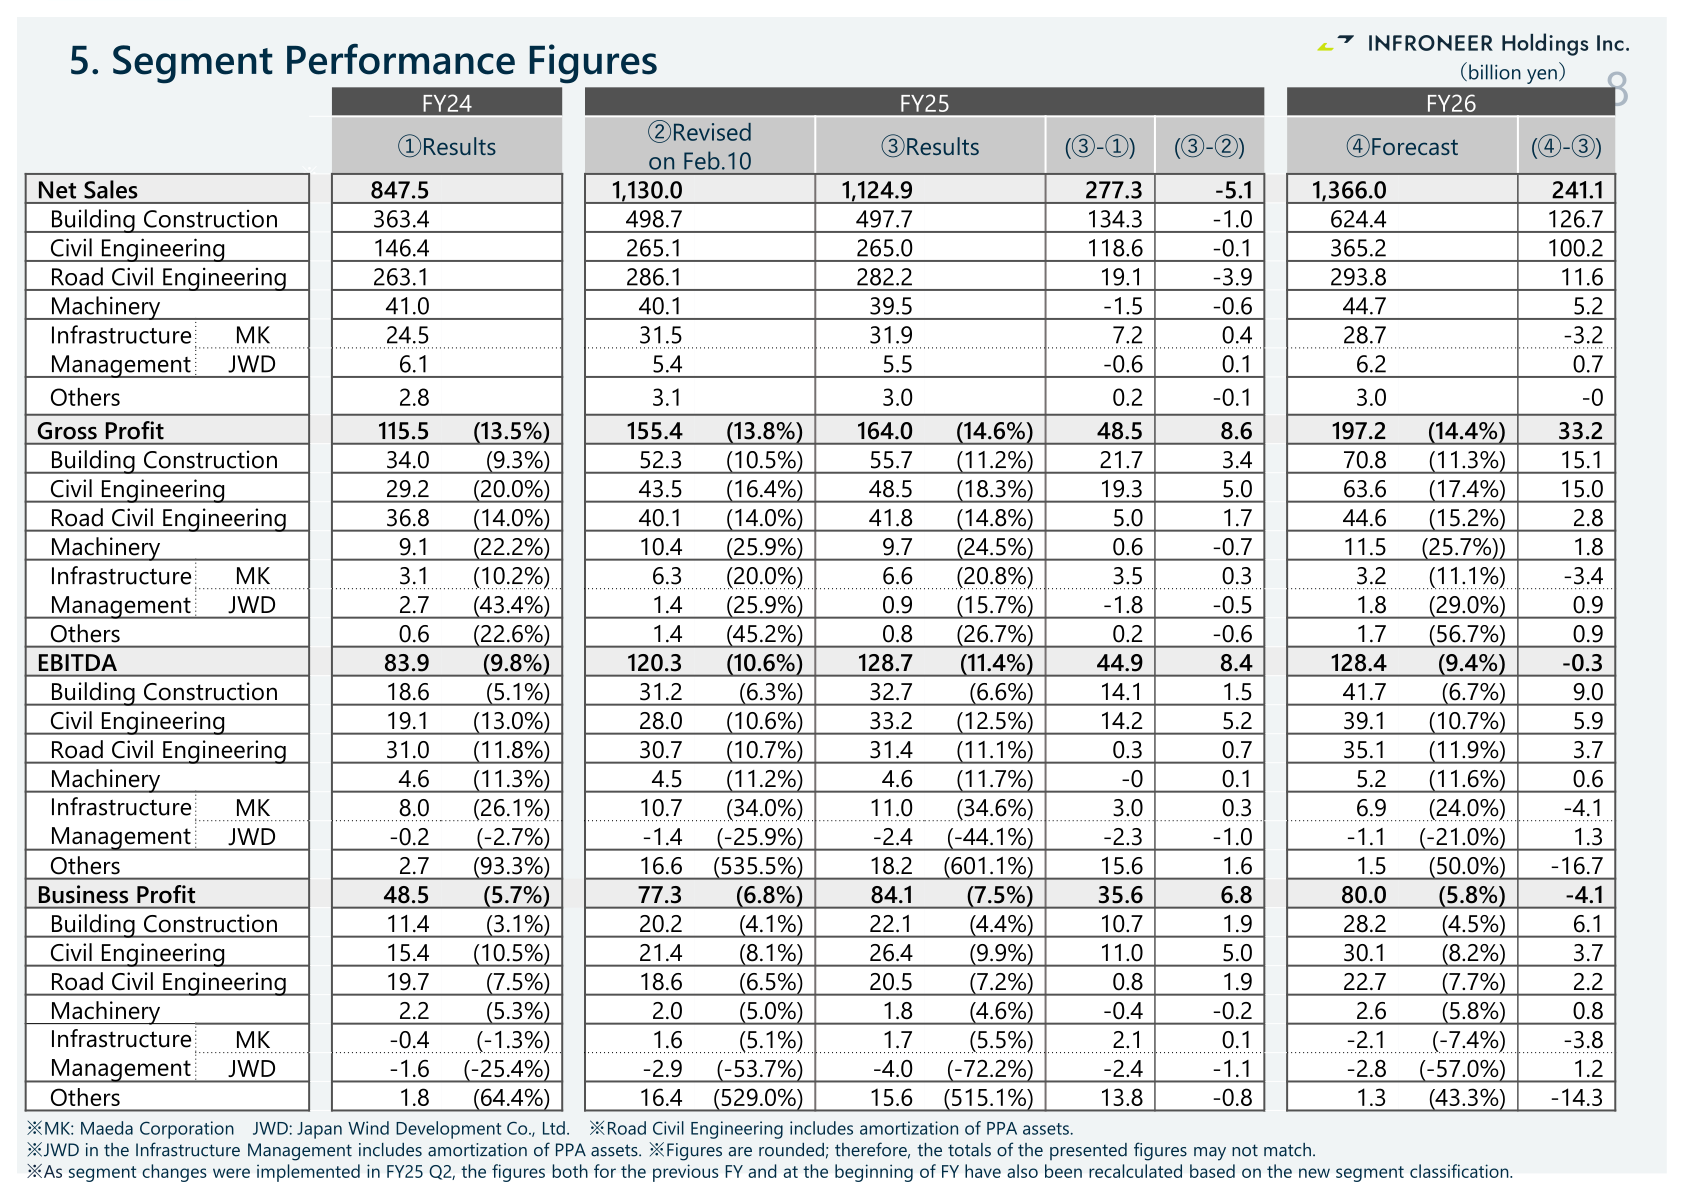
Building Construction net sales grew to 497.7 billion yen from 363.4 billion yen and business profit to 22.1 billion yen from 11.4 billion yen, as the integration of Sumitomo Mitsui Construction was added and SMC saw a significant recovery in profits once the impact of losses from large-scale domestic building construction projects was eliminated. Civil Engineering net sales rose to 265.0 billion yen from 146.4 billion yen and business profit to 26.4 billion yen from 15.4 billion yen. Road Civil Engineering increased net sales to 282.2 billion yen and business profit to 20.5 billion yen despite the implementation of a full two-day weekend system, helped by thorough management of profit margins at the time of order receipt and appropriate price pass-through. In Infrastructure Management, the Maeda Corporation Group (MK) lifted net sales to 31.9 billion yen with business profit of 1.7 billion yen on the steady progress of the concession business and gains on the sale of Komono Villa, while Japan Wind Development (JWD) recorded lower net sales of 5.5 billion yen and a business loss of 4.0 billion yen after a policy shift from selling projects to retaining ownership. Machinery net sales edged down to 39.5 billion yen on changes in distribution channels for certain products and a decline in overseas sales. As segment changes were implemented in FY25 Q2, prior-year and beginning-of-year figures have been recalculated on the new segment classification.
| Segment (billion yen) | Metric | FY25 Results | FY24 Results |
|---|---|---|---|
| Total | Net sales | 1,124.9 | 847.5 |
| Building Construction | Net sales | 497.7 | 363.4 |
| Civil Engineering | Net sales | 265.0 | 146.4 |
| Road Civil Engineering | Net sales | 282.2 | 263.1 |
| Machinery | Net sales | 39.5 | 41.0 |
| Infrastructure Management (MK) | Net sales | 31.9 | 24.5 |
| Infrastructure Management (JWD) | Net sales | 5.5 | 6.1 |
| Others | Net sales | 3.0 | 2.8 |
| Total | Business profit | 84.1 (7.5%) | 48.5 (5.7%) |
| Building Construction | Business profit | 22.1 (4.4%) | 11.4 (3.1%) |
| Civil Engineering | Business profit | 26.4 (9.9%) | 15.4 (10.5%) |
| Road Civil Engineering | Business profit | 20.5 (7.2%) | 19.7 (7.5%) |
| Machinery | Business profit | 1.8 (4.6%) | 2.2 (5.3%) |
| Infrastructure Management (MK) | Business profit | 1.7 (5.5%) | -0.4 (-1.3%) |
| Infrastructure Management (JWD) | Business profit | -4.0 (-72.2%) | -1.6 (-25.4%) |
| Others | Business profit | 15.6 (515.1%) | 1.8 (64.4%) |
Orders Received and Backlog
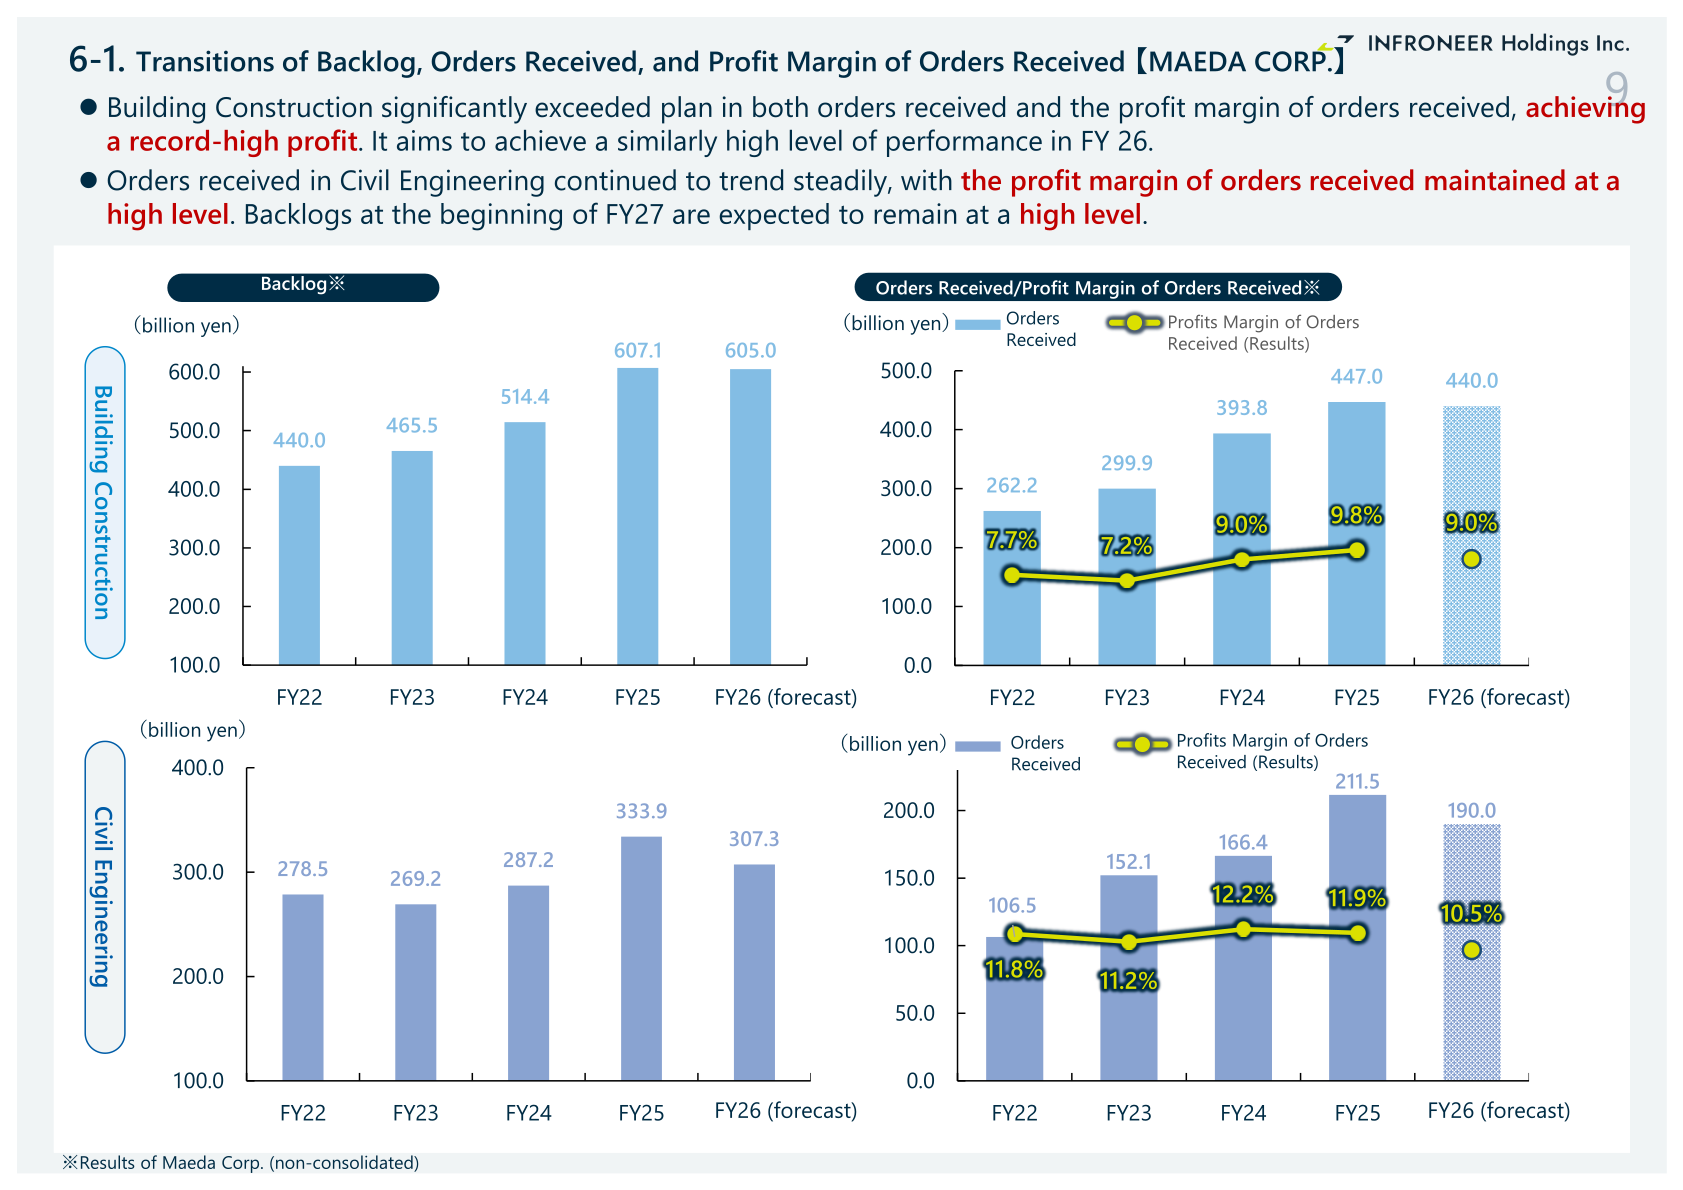
At MAEDA CORPORATION (non-consolidated), Building Construction orders received reached a record-high 447.0 billion yen against 393.8 billion yen in FY24, with the profit margin of orders received also at a record-high 9.8% versus 9.0%; backlog rose to 607.1 billion yen from 514.4 billion yen. Civil Engineering orders received reached 211.5 billion yen from 166.4 billion yen, described as the 200.0 billion yen level for the first time since FY16, with a profit margin of orders received of 11.9% and backlog of 333.9 billion yen. At Sumitomo Mitsui Construction and its overseas subsidiaries, Building Construction orders received rose to 211.4 billion yen from 154.3 billion yen with the profit margin of orders received at 12.2%, and Civil Engineering orders received rose to 139.8 billion yen from 104.3 billion yen with the profit margin of orders received at 12.0%. On a company basis, MAEDA CORPORATION (consolidated) posted net sales of 600.8 billion yen, operating profit of 40.5 billion yen and net income of 51.3 billion yen, while Sumitomo Mitsui Construction (consolidated) posted net sales of 398.4 billion yen, operating profit of 18.5 billion yen and net income of 15.8 billion yen against 0.9 billion yen in FY24.
FY26 Forecast
For FY26 the company plans net sales of 1,366.0 billion yen, which it expects to be a record high, with gross profit of 197.2 billion yen, EBITDA of 128.4 billion yen, business profits of 80.0 billion yen, operating profits of 77.8 billion yen and net income of 60.0 billion yen. Planned ROE is 11.1% and planned EPS 229.3 yen. By segment, Building Construction net sales are planned at 624.4 billion yen and Civil Engineering at 365.2 billion yen. From FY26 Q2, financial results will reflect the consolidation of Swing Corporation.
| Item (billion yen) | FY26 Plan | FY25 Results |
|---|---|---|
| Net sales | 1,366.0 | 1,124.9 |
| Gross profit | 197.2 (14.4%) | 164.0 (14.6%) |
| SG&A | 118.2 (8.7%) | 94.2 (8.4%) |
| EBITDA | 128.4 (9.4%) | 128.7 (11.4%) |
| Business profits | 80.0 (5.8%) | 84.1 (7.5%) |
| Operating profits | 77.8 (5.7%) | 75.8 (6.7%) |
| Net income | 60.0 (4.4%) | 76.6 (6.8%) |
| Equity | 632.4 | 610.6 |
| ROE (ordinary shares) | 11.1 % | 16.0 % |
| EPS | 229.3 yen | 295.5 yen |
Shareholder Returns
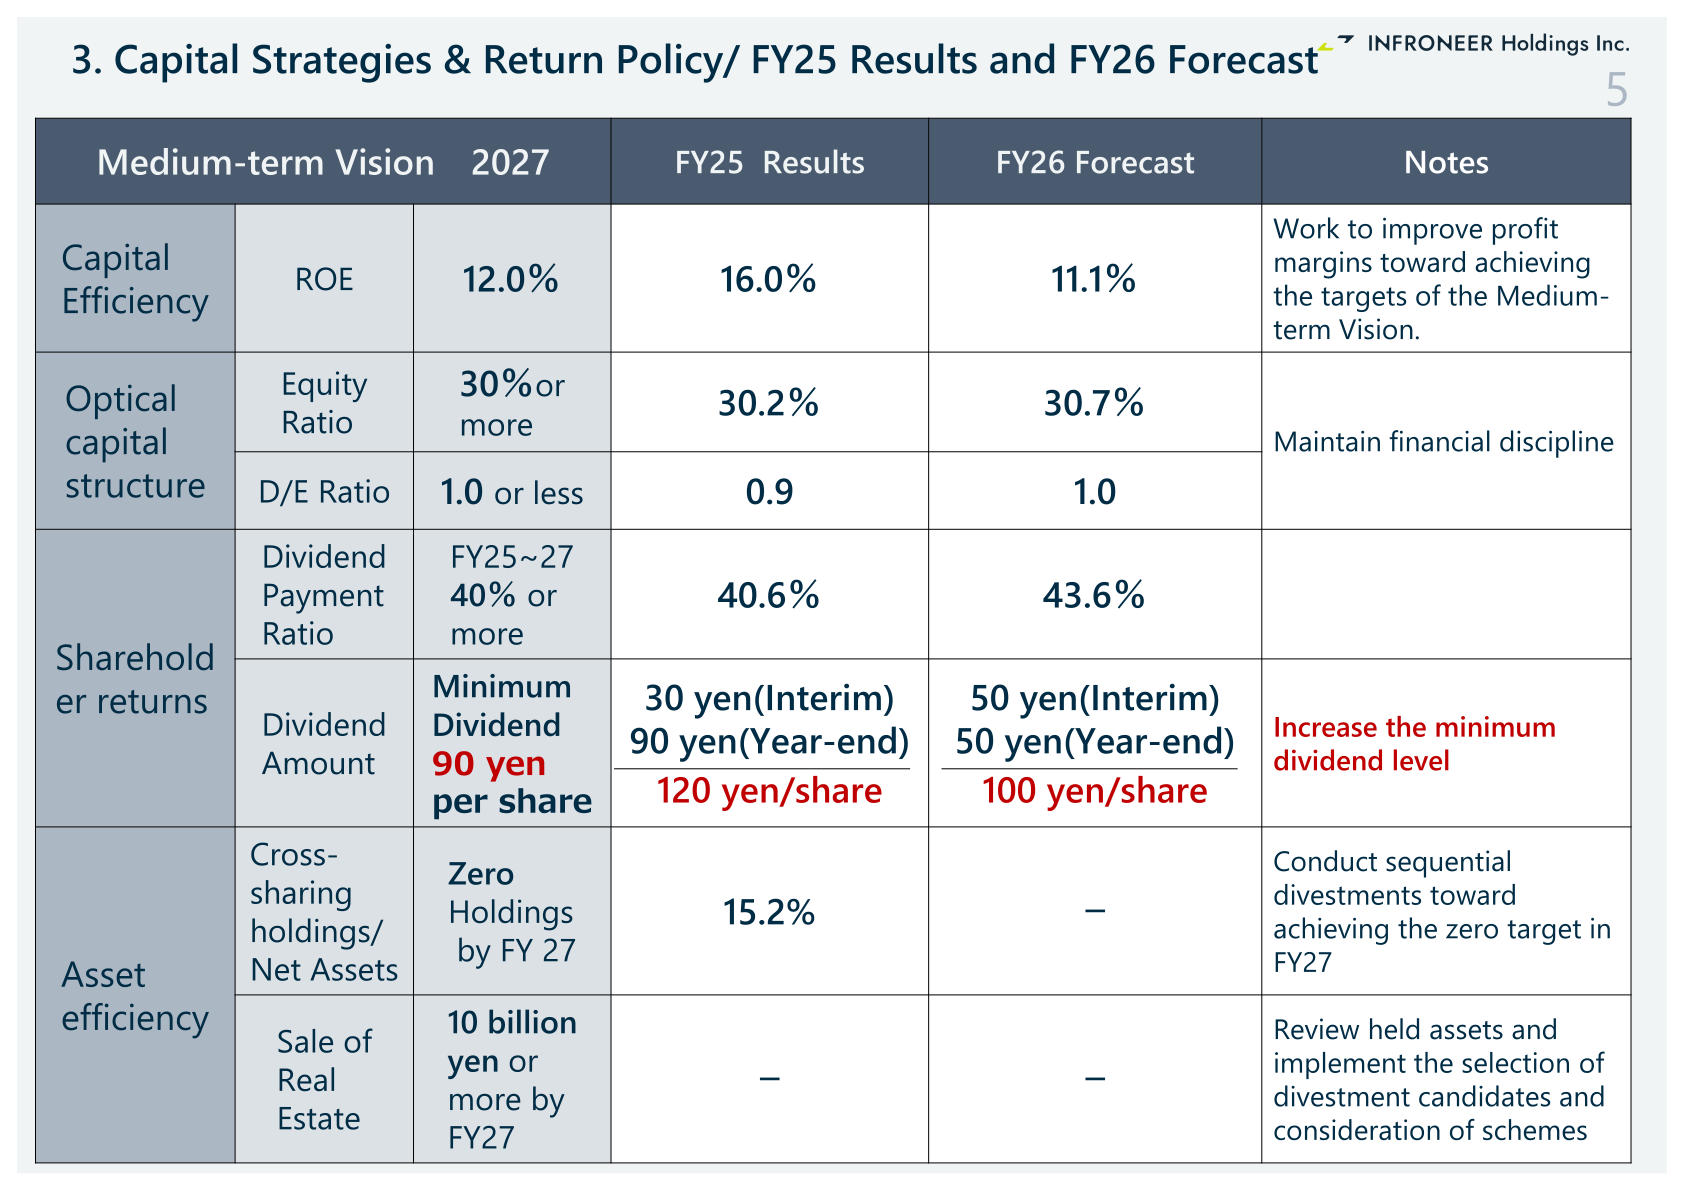
The FY25 dividend was 120 yen per share, comprising an interim dividend of 30 yen and a year-end dividend of 90 yen, for a dividend payment ratio of 40.6% against the Medium-term Vision 2027 policy of 40% or more for FY25 to FY27. For FY26 the company plans 100 yen per share, split 50 yen interim and 50 yen year-end, for a dividend payment ratio of 43.6%, and notes an increase in the minimum dividend level; the Medium-term Vision 2027 sets a minimum dividend of 90 yen per share. On asset efficiency, cross-shareholdings stood at 15.2% of net assets against a zero-holdings target by FY27, with sequential divestments planned, and the plan calls for real estate sales of 10 billion yen or more by FY27.
| Item | Medium-term Vision 2027 | FY25 Results | FY26 Forecast |
|---|---|---|---|
| ROE | 12.0% | 16.0% | 11.1% |
| Equity Ratio | 30%or more | 30.2% | 30.7% |
| D/E Ratio | 1.0 or less | 0.9 | 1.0 |
| Dividend Payment Ratio | FY25~27 40% or more | 40.6% | 43.6% |
| Dividend Amount | Minimum Dividend 90 yen per share | 120 yen/share (30 yen interim, 90 yen year-end) | 100 yen/share (50 yen interim, 50 yen year-end) |
| Cross-shareholdings / Net Assets | Zero Holdings by FY27 | 15.2% | ー |
| Sale of Real Estate | 10 billion yen or more by FY27 | ー | ー |
Financial Position and Topics
Total assets expanded to 2,023.1 billion yen at the end of FY25 from 1,450.7 billion yen, an increase of 572.4 billion yen, with the consolidation of SMC adding 294.1 billion yen to current assets and an increase in cash and equivalents of 170.4 billion yen among the main factors. Liabilities with interest, which include short-term and long-term borrowings, non-recourse loans and corporate bonds, rose to 573.3 billion yen from 395.2 billion yen, while net assets increased to 645.2 billion yen from 542.9 billion yen. SG&A increased by a total of 25.8 billion yen year on year, of which 15.6 billion yen related to SMC, leaving an increase excluding SMC of 10.2 billion yen. On the market side, the share price reached 2,654.5 yen on February 9, 2026, the highest since INFRONEER Holdings was established, and based on the closing price of 2,389 yen as of May 12, 2026 the company shows a PER of 8.1 times, a PBR (common stock) of 1.29 times and a dividend yield of 5.0%. For the bond-type class shares, the preferred dividend was 2.6 billion yen and issued common stock was 250.37 million shares.
This article is an analysis based on publicly available information and is not a recommendation to buy or sell any specific securities. Investment decisions are your own responsibility.
![[Obayashi] Investors’ Guide 2026 — The Complete 24-Article Breakdown](https://japan-equity.com/wp-content/uploads/2026/07/hub_cover-1024x1024.png)
![[Obayashi] IR & SR Policy — Feeding Dialogue Back into Management](https://japan-equity.com/wp-content/uploads/2026/07/p32_sq-1024x1024.jpg)
![[Obayashi] Real Estate Development — 18.7% Margin, ¥287.7bn Unrealized Gains](https://japan-equity.com/wp-content/uploads/2026/07/p20_sq-1024x1024.jpg)
![[Obayashi] Domestic Civil Engineering — Resilience Spending Supports 9.6% Margin](https://japan-equity.com/wp-content/uploads/2026/07/p11_sq-1024x1024.jpg)
![[Obayashi] Share Price & External Ratings — vs TOPIX, ESG Index Inclusion](https://japan-equity.com/wp-content/uploads/2026/07/p40_sq-1024x1024.jpg)
![[Construction] ¥75.5tn Investment, Shrinking Workforce — Big-5 Market Share](https://japan-equity.com/wp-content/uploads/2026/07/p12_sq-1024x1024.jpg)



![[Obayashi] Capital Policy & Shareholder Returns — ROE 10%+, DOE ~5%, ¥100bn Buyback](https://japan-equity.com/wp-content/uploads/2026/07/p27_sq-1024x1024.jpg)
![[Obayashi] Reducing Cross-Shareholdings — ¥285.2bn Sold in Five Years](https://japan-equity.com/wp-content/uploads/2026/07/p29_sq-1024x1024.jpg)
![[Obayashi] ¥750bn Investment Plan — ¥300bn to Development, ¥190bn to Tech/DX](https://japan-equity.com/wp-content/uploads/2026/07/p30_sq-1024x1024.jpg)
![[Obayashi] MTP2022 KPIs — Operating Profit ~2x Target, ROE 14.4%](https://japan-equity.com/wp-content/uploads/2026/07/p25_sq-1024x1024.jpg)
![[Obayashi] Cash Allocation — ¥420bn Investment CF Over Five Years](https://japan-equity.com/wp-content/uploads/2026/07/p26_sq-1024x1024.jpg)
![[Obayashi] Green Energy — 44 Plants, 344MW, and the Green Hydrogen Challenge](https://japan-equity.com/wp-content/uploads/2026/07/p21_sq-1024x1024.jpg)
![[Obayashi] Tackling the Labor Shortage — Robotics Construction®](https://japan-equity.com/wp-content/uploads/2026/07/p14_sq-1024x1024.jpg)
