
This article is based on publicly available IR materials and is not a recommendation to buy or sell any specific securities.
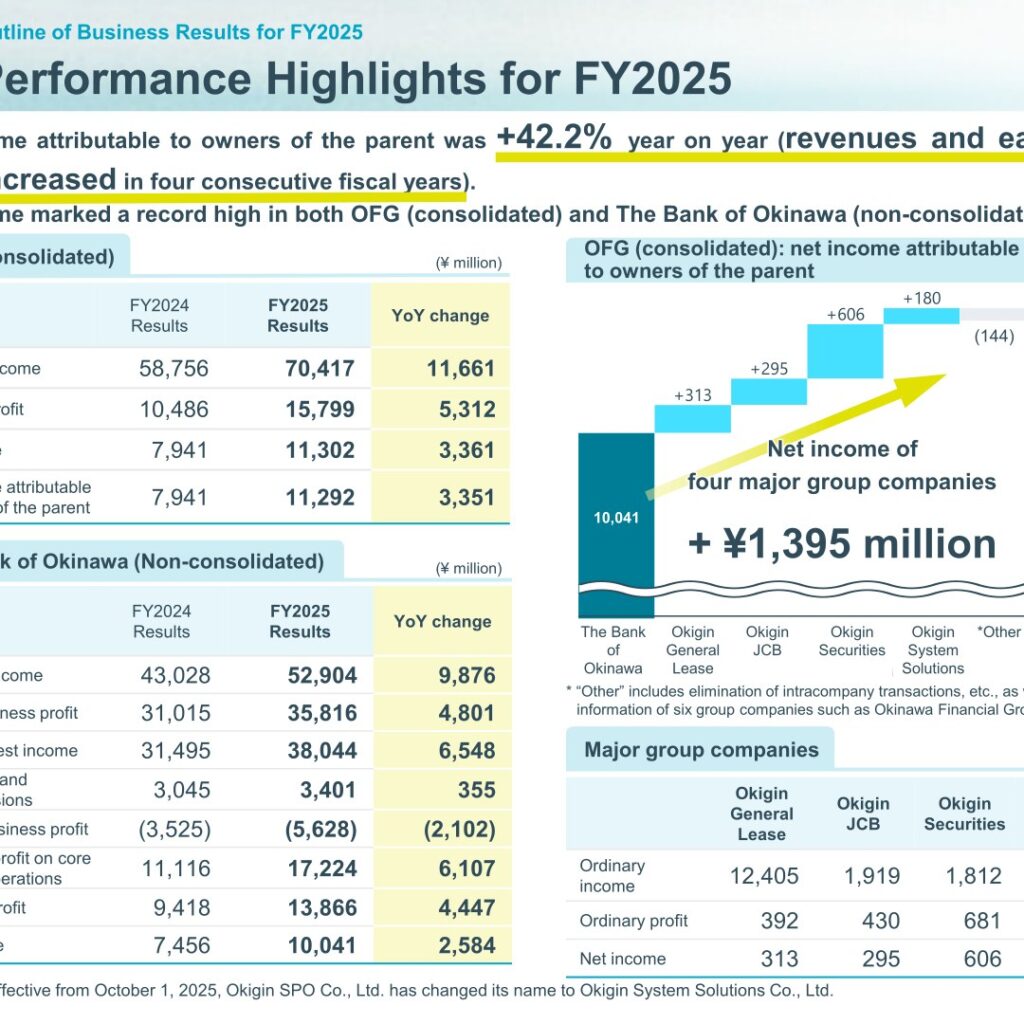
Okinawa Financial Group (OFG) reported FY2025 consolidated ordinary income of ¥70,417 million, up ¥11,661 million year on year, and consolidated ordinary profit of ¥15,799 million, up ¥5,312 million. Net income attributable to owners of the parent was up 42.2% year on year at ¥11,292 million, with revenues and earnings both increasing in four consecutive fiscal years. Net income marked a record high in both OFG (consolidated) and The Bank of Okinawa (non-consolidated). Financial results for FY2025 significantly exceeded the forecasts in all items, and the Company revised upward the final-year targets of its 2nd Medium-Term Business Plan.
Consolidated Results (Full-Year Actual)
Ordinary profit increased by ¥5,312 million year on year, due to an increase in ordinary income on core banking operations such as interest on loans and discounts, interest and dividends on securities, and fees and commissions, despite an increase in ordinary expenses due to interest on deposits and loss on sale of bonds. The materials break down the ¥11,661 million increase in ordinary income into interest on loans and discounts (+¥6,141 million), interest and dividends on securities (+¥2,913 million), other ordinary income (+¥1,073 million) and others (+¥1,533 million).
| Item (¥ million) | FY2025 Results | FY2024 Results | YoY change |
|---|---|---|---|
| Ordinary income | 70,417 | 58,756 | 11,661 |
| Ordinary profit | 15,799 | 10,486 | 5,312 |
| Net income | 11,302 | 7,941 | 3,361 |
| Net income attributable to owners of the parent | 11,292 | 7,941 | 3,351 |
At The Bank of Okinawa on a non-consolidated basis, business profit on core banking operations rose to ¥17,224 million from ¥11,116 million, driven by a ¥6,548 million increase in net interest income.
| The Bank of Okinawa, non-consolidated (¥ million) | FY2025 Results | FY2024 Results | YoY change |
|---|---|---|---|
| Ordinary income | 52,904 | 43,028 | 9,876 |
| Gross business profit | 35,816 | 31,015 | 4,801 |
| Net interest income | 38,044 | 31,495 | 6,548 |
| Net fees and commissions | 3,401 | 3,045 | 355 |
| Other business profit | (5,628) | (3,525) | (2,102) |
| Business profit on core banking operations | 17,224 | 11,116 | 6,107 |
| Ordinary profit | 13,866 | 9,418 | 4,447 |
| Net income | 10,041 | 7,456 | 2,584 |
Group Company Results
Net income of the four major group companies added ¥1,395 million, bridging The Bank of Okinawa’s non-consolidated net income of ¥10,041 million to consolidated net income attributable to owners of the parent of ¥11,292 million, with “Other” contributing ¥(144) million. “Other” includes elimination of intracompany transactions, etc., as well as the information of six group companies such as Okinawa Financial Group, Inc. Effective from October 1, 2025, Okigin SPO Co., Ltd. has changed its name to Okigin System Solutions Co., Ltd.
| Major group companies (¥ million) | Ordinary income | Ordinary profit | Net income |
|---|---|---|---|
| Okigin General Lease | 12,405 | 392 | 313 |
| Okigin JCB | 1,919 | 430 | 295 |
| Okigin Securities | 1,812 | 681 | 606 |
| Okigin System Solutions | 2,486 | 268 | 180 |
Loans, Deposits and Core Banking Metrics
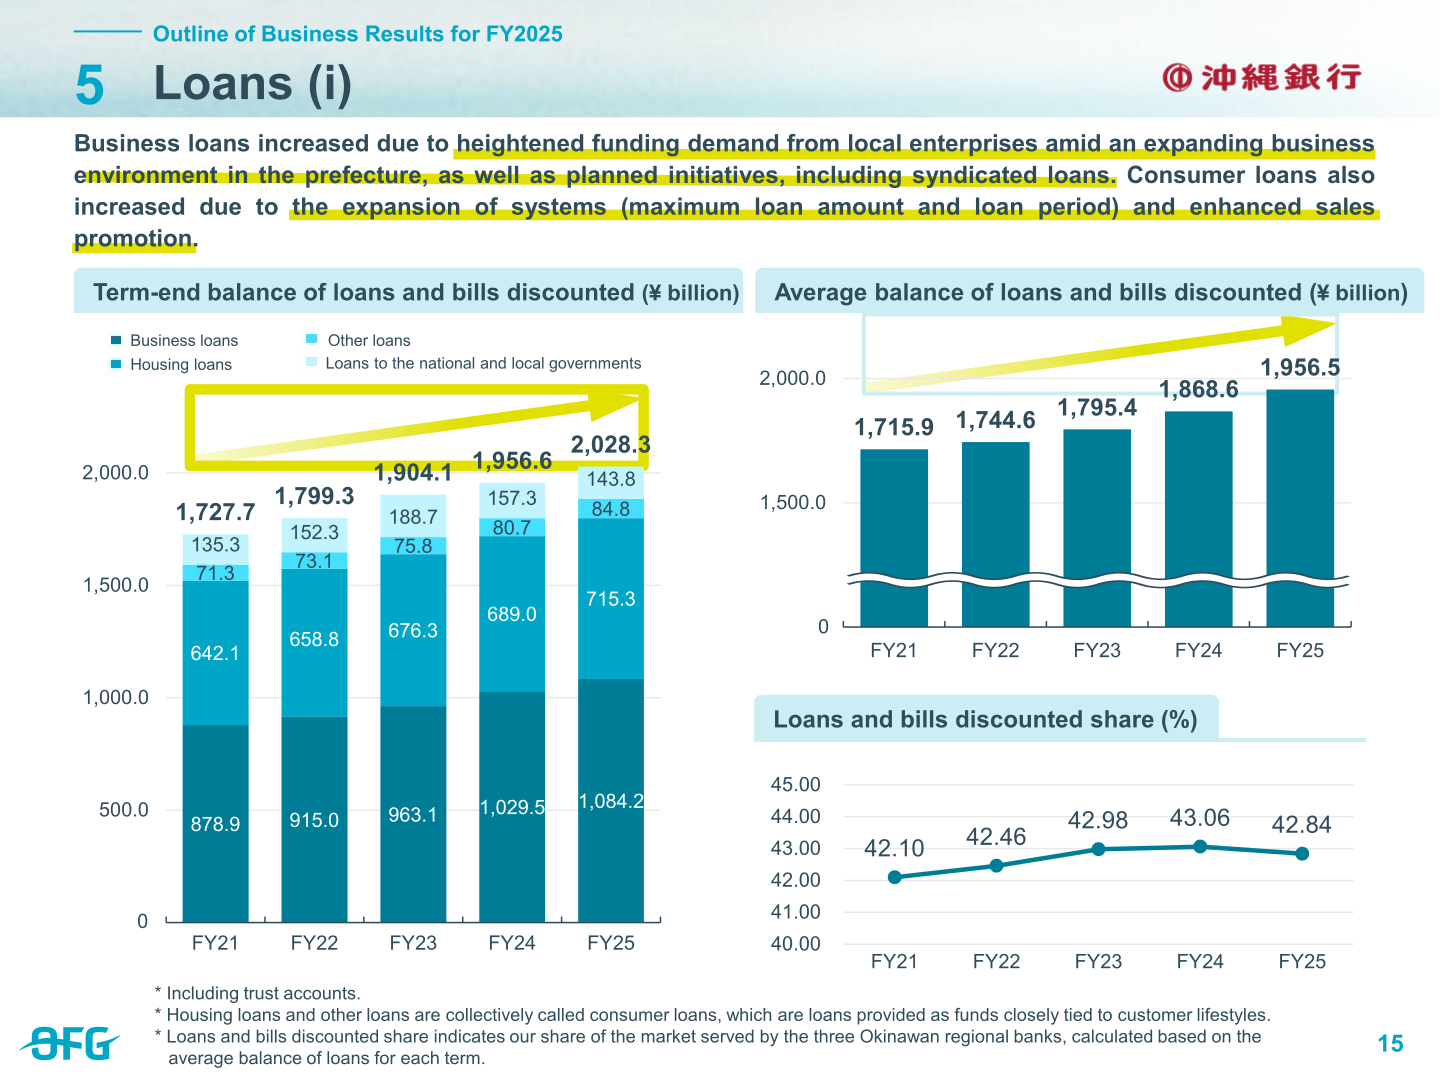
The term-end balance of loans and bills discounted rose to ¥2,028.3 billion, as business loans increased on heightened funding demand from local enterprises and planned initiatives including syndicated loans, while consumer loans also increased. The term-end balance of deposits fell by ¥53.4 billion year on year to ¥2,662.7 billion due to a decrease in deposits by public funds resulting from the periodic change of designated financial institution, partially offset by increases in both deposits by individuals and deposits by corporations. Business profit on customer services rose to ¥9,330 million and the business profit margin on customer services rose by 0.12 percentage points year on year to 0.34%. The balance of assets in custody increased by ¥79.2 billion year on year to ¥397.2 billion.
| Item | FY2025 | FY2024 |
|---|---|---|
| Term-end balance of loans and bills discounted (¥ billion) | 2,028.3 | 1,956.6 |
| Business loans (¥ billion) | 1,084.2 | 1,029.5 |
| Housing loans (¥ billion) | 715.3 | 689.0 |
| Other loans (¥ billion) | 84.8 | 80.7 |
| Loans to the national and local governments (¥ billion) | 143.8 | 157.3 |
| Term-end balance of deposits (¥ billion) | 2,662.7 | 2,716.2 |
| Interest on loans and discounts (¥ million) | 32,518 | 26,326 |
| Yield on loans and bills discounted (%) | 1.66 | 1.40 |
| Yield on deposits (%) | 0.19 | 0.06 |
| Loan / deposit spreads (%) | 1.47 | 1.34 |
| Business profit on customer services (¥ million) | 9,330 | 5,917 |
| Business profit margin on customer services (%) | 0.34 | 0.22 |
Expenses, Asset Quality and Capital
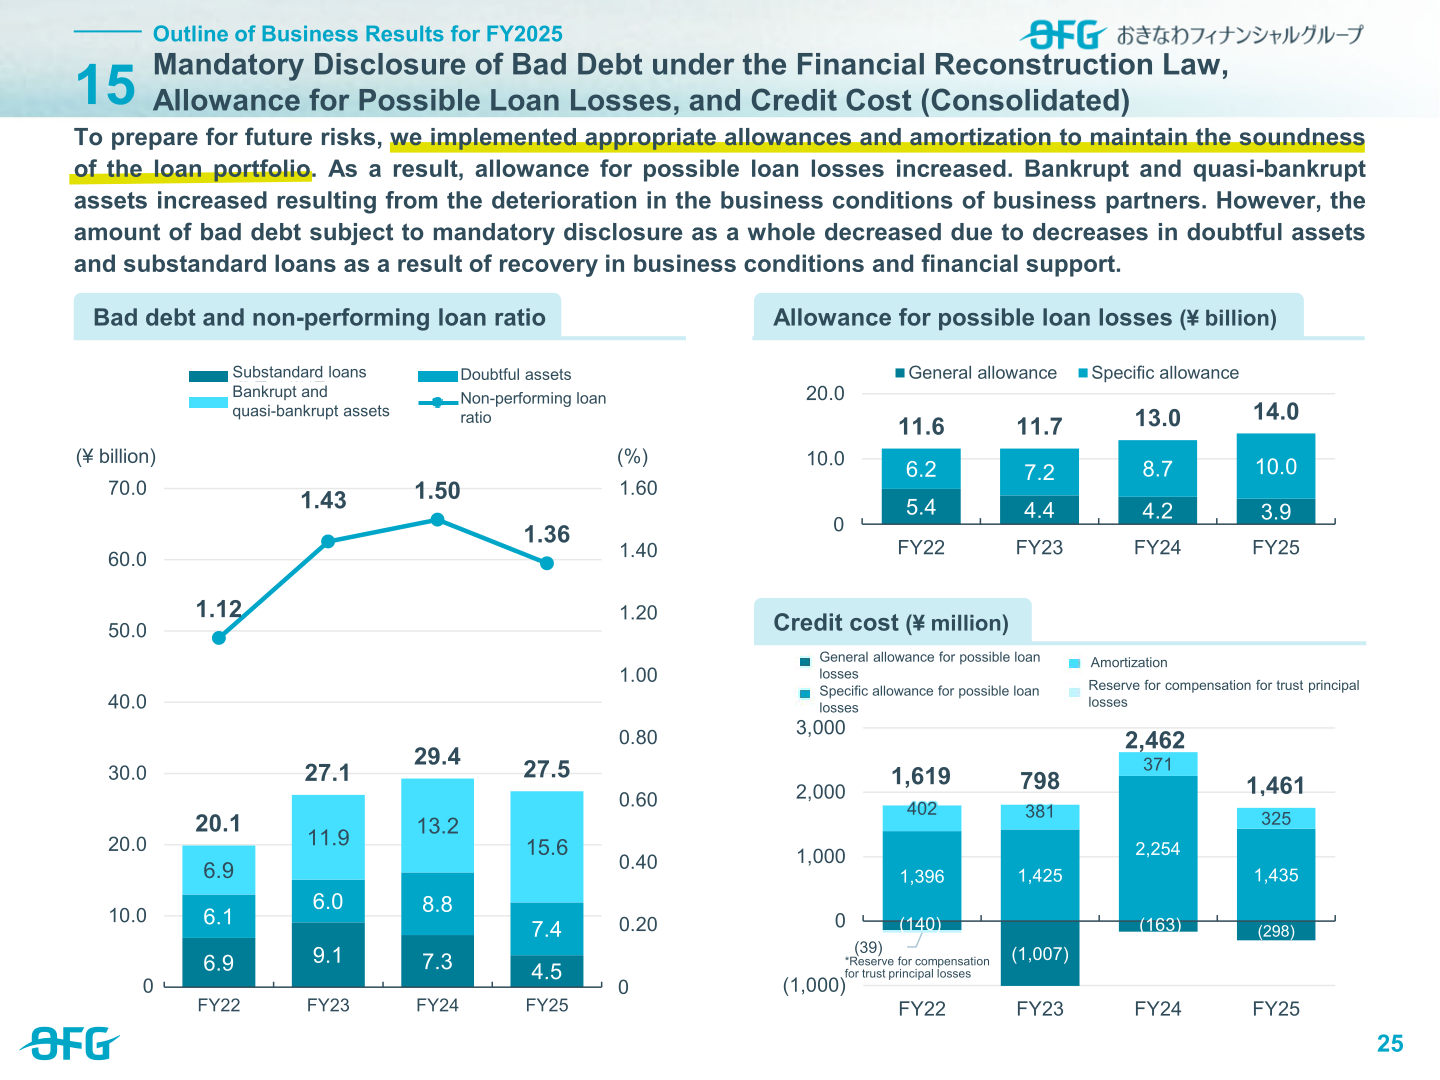
Expenses increased by ¥800 million year on year due to an increase in operating expenses associated with rising prices, but an increase in revenue from the core business exceeded the increased expenses: the OHR improved by 7.53 percentage points year on year to 62.82% and the core OHR improved by 9.18 percentage points year on year to 56.93%. On asset quality, allowance for possible loan losses increased as the Group implemented appropriate allowances and amortization, while the amount of bad debt subject to mandatory disclosure as a whole decreased. The non-consolidated non-performing loan ratio for The Bank of Okinawa decreased by 0.14 percentage points year on year to 1.33%, remaining at a low level below the regional bank average. Capital ratios were almost unchanged in both OFG (consolidated) and The Bank of Okinawa (non-consolidated) as an increase in capital offset higher risk-weighted assets; the Internal Loss Multiplier (ILM) method for operational risk was approved by the Financial Services Agency and has been applied from the current fiscal year.
| Item | FY2025 | FY2024 |
|---|---|---|
| Expenses, consolidated (¥ billion) | 25.2 | 24.4 |
| OHR, consolidated (%) | 62.82 | 70.35 |
| Core OHR, consolidated (%) | 56.93 | 66.11 |
| Bad debt subject to mandatory disclosure, consolidated (¥ billion) | 27.5 | 29.4 |
| Non-performing loan ratio, consolidated (%) | 1.36 | 1.50 |
| Allowance for possible loan losses, consolidated (¥ billion) | 14.0 | 13.0 |
| Credit cost, consolidated (¥ million) | 1,461 | 2,462 |
| Capital, consolidated (¥ billion) | 174.0 | 166.8 |
| Risk-weighted assets, consolidated (¥ billion) | 1,531.9 | 1,469.5 |
| Capital ratio (domestic standard), consolidated (%) | 11.36 | 11.35 |
| Capital ratio (domestic standard), The Bank of Okinawa (%) | 10.52 | 10.52 |
| Consolidated ROE (%) | 6.61 | 4.86 |
FY2026 Targets
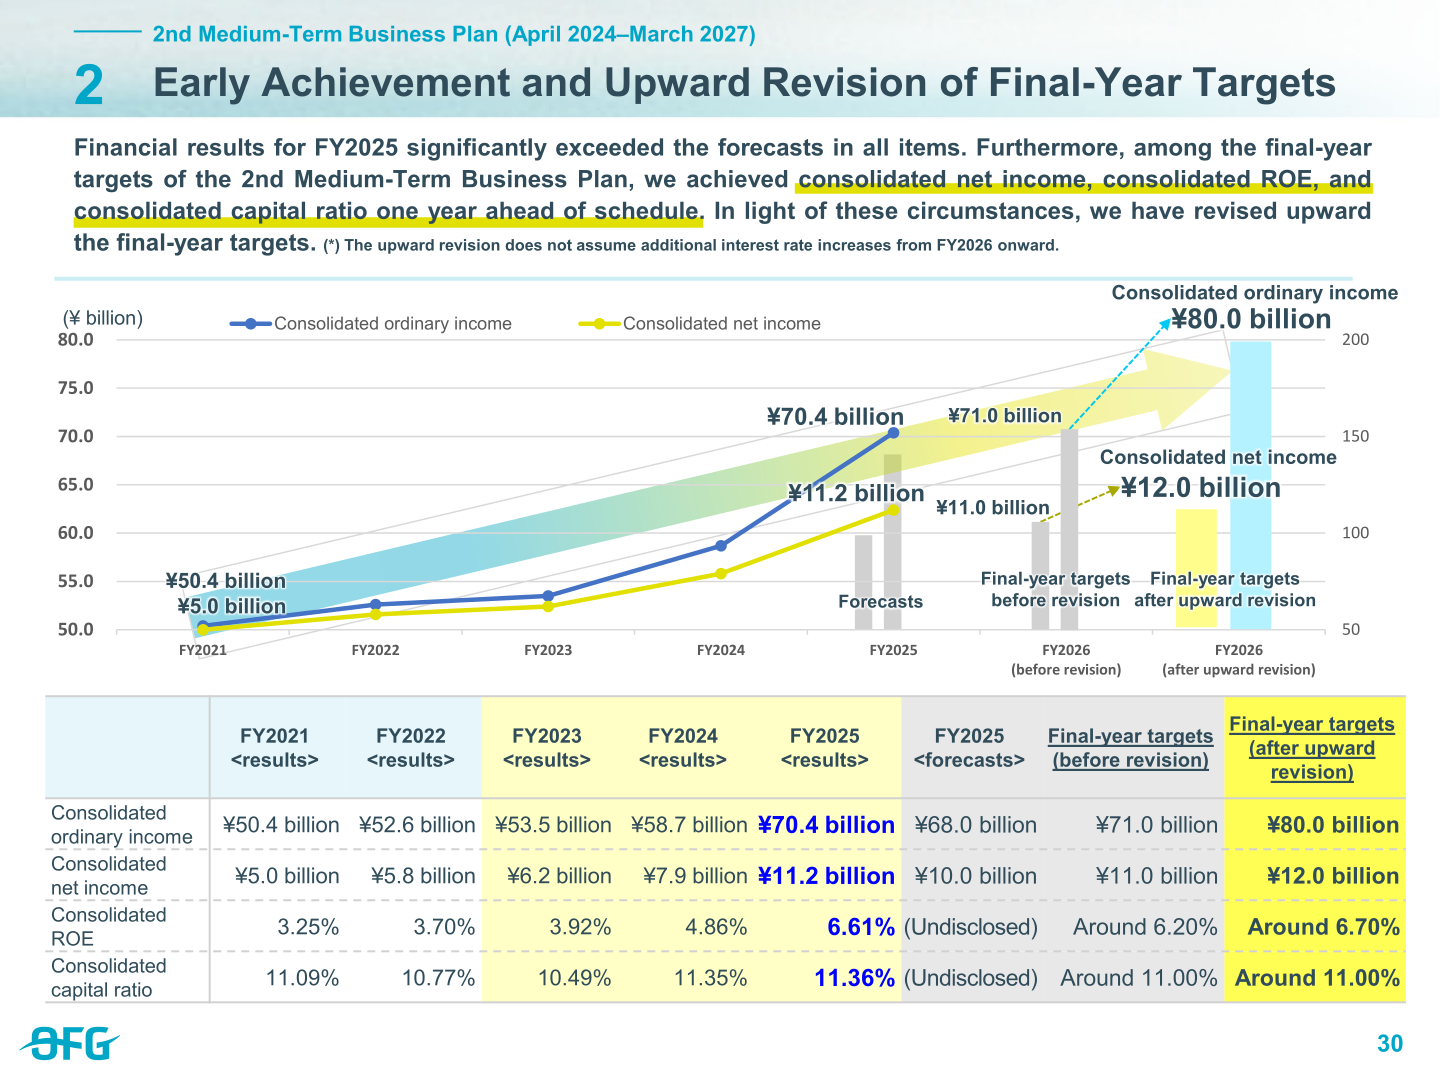
The materials do not present a separate FY2026 earnings forecast table; instead they show the final-year targets of the 2nd Medium-Term Business Plan (April 2024–March 2027), which the Company revised upward. Among the final-year targets, consolidated net income, consolidated ROE and consolidated capital ratio were achieved one year ahead of schedule. The upward revision does not assume additional interest rate increases from FY2026 onward. The revised final-year targets are for consolidated ordinary income of ¥80.0 billion, an increase of approximately ¥30.0 billion from FY2021 when OFG was established, and for consolidated net income of ¥12.0 billion, a 2.4-fold increase.
| Item | FY2026 final-year targets (after upward revision) | FY2026 final-year targets (before revision) | FY2025 Results |
|---|---|---|---|
| Consolidated ordinary income | ¥80.0 billion | ¥71.0 billion | ¥70.4 billion |
| Consolidated net income | ¥12.0 billion | ¥11.0 billion | ¥11.2 billion |
| Consolidated ROE | Around 6.70% | Around 6.20% | 6.61% |
| Consolidated capital ratio | Around 11.00% | Around 11.00% | 11.36% |
Shareholder Returns
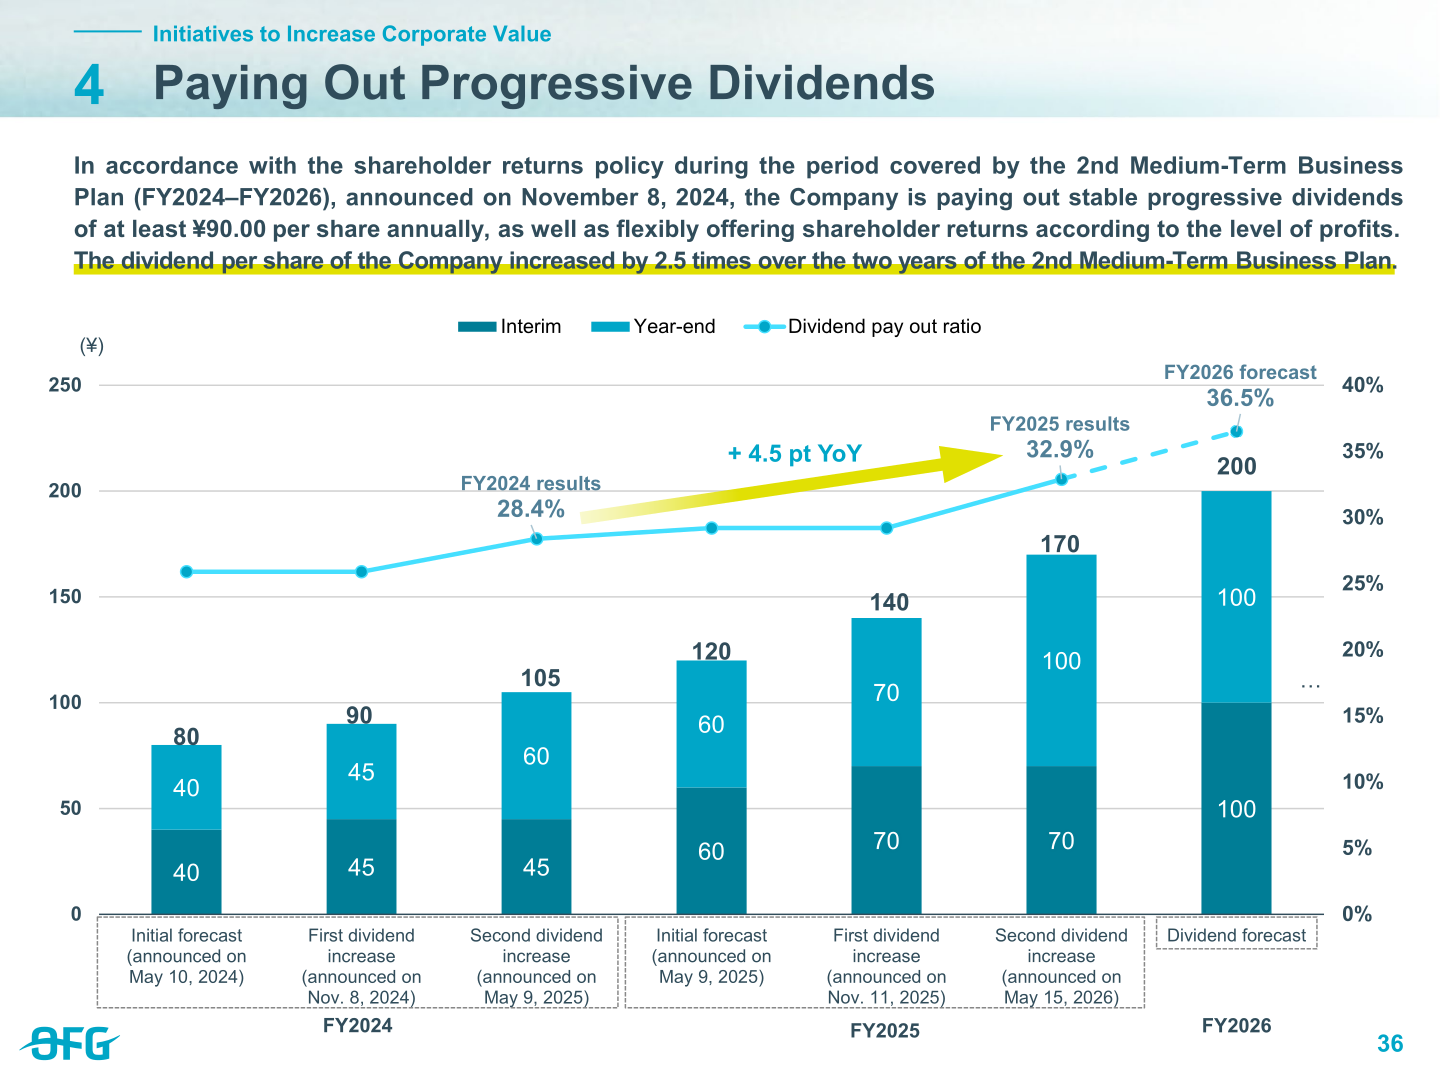
In accordance with the shareholder returns policy during the period covered by the 2nd Medium-Term Business Plan (FY2024–FY2026), announced on November 8, 2024, the Company is paying out stable progressive dividends of at least ¥90.00 per share annually, as well as flexibly offering shareholder returns according to the level of profits. Following a second dividend increase announced on May 15, 2026, the FY2025 annual dividend was ¥170 per share and the dividend payout ratio was 32.9%, up 4.5 percentage points year on year. The FY2026 dividend forecast is ¥200 per share with a payout ratio of 36.5%. The dividend per share of the Company increased by 2.5 times over the two years of the 2nd Medium-Term Business Plan.
| Dividend per share (¥) | FY2024 results | FY2025 results | FY2026 forecast |
|---|---|---|---|
| Interim | 45 | 70 | 100 |
| Year-end | 60 | 100 | 100 |
| Annual | 105 | 170 | 200 |
| Dividend payout ratio (%) | 28.4 | 32.9 | 36.5 |
Medium-Term Plan and Topics
As of March 31, 2026, the Group’s price-to-book (P/B) ratio stood at 0.69. Assuming that cost of shareholders’ equity is around 8%, the Group will work to increase its consolidated ROE to that level, with the 2nd Medium-Term Business Plan aiming for a consolidated ROE of around 6.70%. Viewing ROE as the product of return on risk-weighted assets (RORA) and the financial leverage ratio, the Group aims to increase RORA to around 0.75% and maintain the financial leverage ratio at around 9.0 by growing top-line revenue and controlling risk-weighted assets; RORA was 0.74% and the financial leverage ratio 8.97 in FY2025. Interest on loans and discounts RORA was 2.6% for FY2025, against an estimate of around 3.0% needed to reach the net income RORA target.
Under “Build a Base for Growth,” the Group intends to increase income from interest on loans and discounts by more than ¥13.0 billion in FY2026 compared with FY2021, and to raise The Bank of Okinawa’s non-interest income by around ¥1.5 billion from the FY2021 level; non-interest income (commissions) was ¥6.3 billion in FY2025 against a FY2026 policy level of ¥6.5 billion, while group companies’ figure was ¥19.2 billion against ¥19.9 billion. In July 2025, The Bank of Okinawa established Okigin Success Partners Co., Ltd., a joint venture with Nihon M&A Center Holdings Inc., to help solve business succession issues of companies in the prefecture. Income from customer supporting businesses reached ¥653 million in FY2025.
This article is an analysis based on publicly available information and is not a recommendation to buy or sell any specific securities. Investment decisions are your own responsibility.
![[Obayashi] Investors’ Guide 2026 — The Complete 24-Article Breakdown](https://japan-equity.com/wp-content/uploads/2026/07/hub_cover-1024x1024.png)
![[Obayashi] IR & SR Policy — Feeding Dialogue Back into Management](https://japan-equity.com/wp-content/uploads/2026/07/p32_sq-1024x1024.jpg)
![[Obayashi] Real Estate Development — 18.7% Margin, ¥287.7bn Unrealized Gains](https://japan-equity.com/wp-content/uploads/2026/07/p20_sq-1024x1024.jpg)
![[Obayashi] Domestic Civil Engineering — Resilience Spending Supports 9.6% Margin](https://japan-equity.com/wp-content/uploads/2026/07/p11_sq-1024x1024.jpg)
![[Obayashi] Share Price & External Ratings — vs TOPIX, ESG Index Inclusion](https://japan-equity.com/wp-content/uploads/2026/07/p40_sq-1024x1024.jpg)
![[Construction] ¥75.5tn Investment, Shrinking Workforce — Big-5 Market Share](https://japan-equity.com/wp-content/uploads/2026/07/p12_sq-1024x1024.jpg)



![[Obayashi] Capital Policy & Shareholder Returns — ROE 10%+, DOE ~5%, ¥100bn Buyback](https://japan-equity.com/wp-content/uploads/2026/07/p27_sq-1024x1024.jpg)
![[Obayashi] Reducing Cross-Shareholdings — ¥285.2bn Sold in Five Years](https://japan-equity.com/wp-content/uploads/2026/07/p29_sq-1024x1024.jpg)
![[Obayashi] ¥750bn Investment Plan — ¥300bn to Development, ¥190bn to Tech/DX](https://japan-equity.com/wp-content/uploads/2026/07/p30_sq-1024x1024.jpg)
![[Obayashi] MTP2022 KPIs — Operating Profit ~2x Target, ROE 14.4%](https://japan-equity.com/wp-content/uploads/2026/07/p25_sq-1024x1024.jpg)
![[Obayashi] Cash Allocation — ¥420bn Investment CF Over Five Years](https://japan-equity.com/wp-content/uploads/2026/07/p26_sq-1024x1024.jpg)
![[Obayashi] Green Energy — 44 Plants, 344MW, and the Green Hydrogen Challenge](https://japan-equity.com/wp-content/uploads/2026/07/p21_sq-1024x1024.jpg)
![[Obayashi] Tackling the Labor Shortage — Robotics Construction®](https://japan-equity.com/wp-content/uploads/2026/07/p14_sq-1024x1024.jpg)
